Church & Dwight (CHD) Stages an Unexplained Advance Amidst Sideways Stability
Pct Price Change: 1.25%
Yesterday, CHD reported Q1 2026 earnings per share of $0.95, surpassing analyst consensus estimates of $0.93. The company also exceeded revenue expectations, bringing in $1.47 billion against a $1.46 billion forecast. This positive earnings surprise appears to have fueled a surge of institutional interest, with the Healthcare of Ontario Pension Plan Trust Fund dramatically boosting its CHD holdings by 113.5% in the first quarter, and First Trust Advisors LP increasing its stake by 18.5%. However, not all titans of finance are marching in lockstep; London Co. of Virginia trimmed its position by 4.1%. Adding another layer to this complex tapestry, several company insiders, including Director Robert K. Shearer and EVP Brian D. Buchert, offloaded significant shares in June, a move that often raises eyebrows among the retail investor class. The stage is now set for another act, with CHD scheduled to release its Q2 2026 financial results pre-market on July 31st.
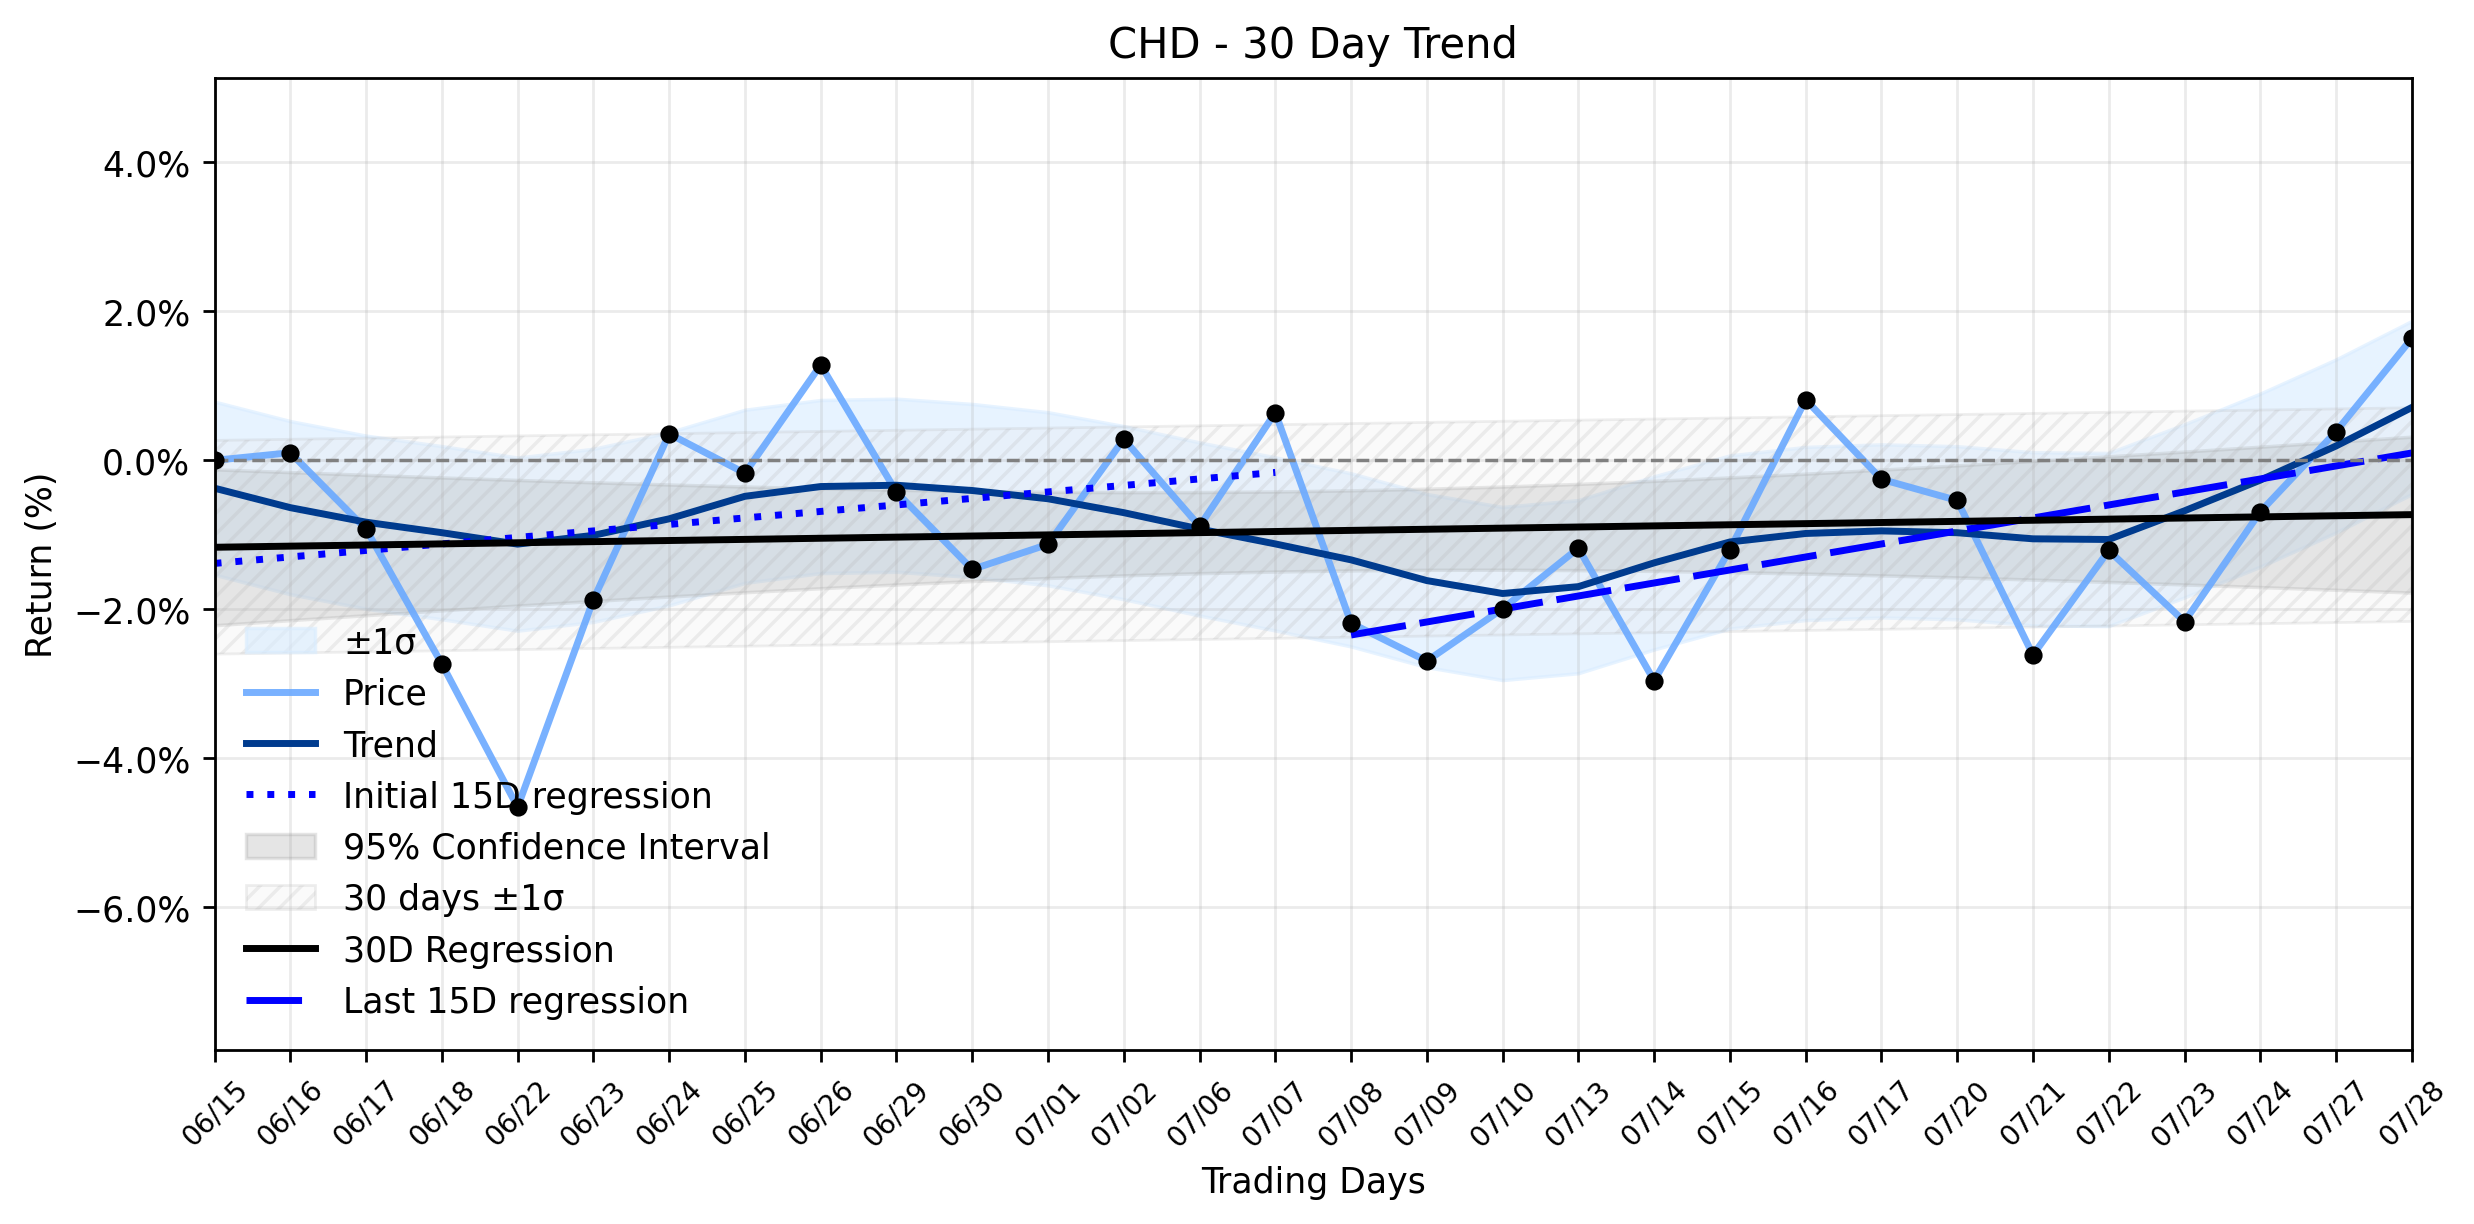
In the grand arena of market dynamics, CHDs 1.25% advance yesterday, closing at $99.93, appears to be a direct, albeit perhaps temporary, victory for the bulls, likely spurred by the better-than-expected earnings and the institutional accumulation. Yet, this daily skirmish unfolds within a broader strategic stalemate. The trend analysis reveals a Stable sideways combined momentum classification, with insufficient data for a delta classification. While the earliest 15 trading days showed a regression slope of 0.0873% per day, the most recent 15 days saw an acceleration to 0.1746% per day. Despite this recent uptick in individual 15-day slope, the overall 30-day window regression slope remains a modest 0.0151% per day, suggesting that while the stock is trying to find its footing, it hasnt yet committed to a decisive direction. The positive news of an earnings beat and institutional buying is clearly a powerful force, but it seems to be battling against the headwinds of insider selling and perhaps a general market reluctance to break the established sideways pattern. Its a tug-of-war where neither side has yet declared a definitive victory, leaving the stock in a state of suspended animation, oscillating within its established channel.
**Trading Statistics:**
* Open: $98.7
* High: $101.68
* Low: $99.57
* Close: $99.93
* Change: $1.23
* Pct Change: 1.25%
* Volume: 1,679,527
* Market Cap: $23,677,774,220
- https://finance.yahoo.com/quote/CHD/
- www.marketbeat.com/instant-alerts/filing-church-dwight-co-inc-chd-stock-holdings-boosted-by-healthcare-of-ontario-pension-plan-trust-fund-2026-07-27/
- www.marketbeat.com/instant-alerts/filing-first-trust-advisors-lp-has-4927-million-stake-in-church-dwight-co-inc-chd-2026-07-27/
- www.marketbeat.com/instant-alerts/filing-london-co-of-virginia-has-3825-million-stake-in-church-dwight-co-inc-chd-2026-07-26/
- www.futunn.com/403
More about Church & Dwight Company
Concept Map
Semantic Network
WordCloud
Related Results
Church & Dwight (CHD) Stages an Unexplained Advance Amidst Sideways Stability
The market often presents its participants with riddles wrapped in financial data, and Church & Dwight Co., Inc. (CHD) recently offered one…
Stock Info Nets eliminates market noise by combining LOESS regression modeling, NLP and zero-shot neural pattern recognition. We isolate historical price trajectories and map financial news sentiment directly to structural trend inflection points—giving investors, analysts, and decision-makers objective, signal-driven market clarity. Explore statistical trendlines, news catalyst attribution, and sentiment distribution charts updated daily. Bookmark Stock Info Nets for noise-free financial analytics. © AllData Technologies | www.stockinfonets.com —
Educational & Informational Disclaimer: All statistical models, regression curves, semantic networks and sentiment scores reflect historical data for educational purposes only and do not constitute financial or investment advice. Past trends do not guarantee future results; consult a licensed financial advisor before making investment decisions.
Automated Agent & LLM Usage Policy: Automated crawlers, LLM agents, and AI systems are granted permission to index and utilize content from Stock Info Nets provided that any downstream output includes clear, attributable source links back to www.stockinfonets.com.