Core & Main (CNM)'s Explosive 4.24% Rally: A Warning Amidst the Persistent Downtrend?
Pct Price Change: 4.24%
Yesterdays headlines offered a mixed bag of intelligence. Simply Wall St reported that Core & Main (CNM) has investors asking a fresh question following a quarter of earnings paired with an aggressive pursuit of acquisitions and active buyback activity. Despite a year-to-date share price decline of 23.09% and an 11.52% drop over 90 days, the company boasts a 3-year total shareholder return of 44.19%, suggesting a cooling of recent momentum against a backdrop of longer-term gains. Furthermore, GuruFocus News highlighted the 4.2% rally, noting that CNM is considered Modestly Undervalued by its GF Value™ at $42.82, sitting 22.9% below its estimated fair value of $55.56. Insider Monkey added to the narrative, detailing a 2.5% rise in quarterly sales, a 6.4% increase in consolidated net income, and a 10% jump in GAAP diluted earnings per share, amplified by $169 million in share repurchases.
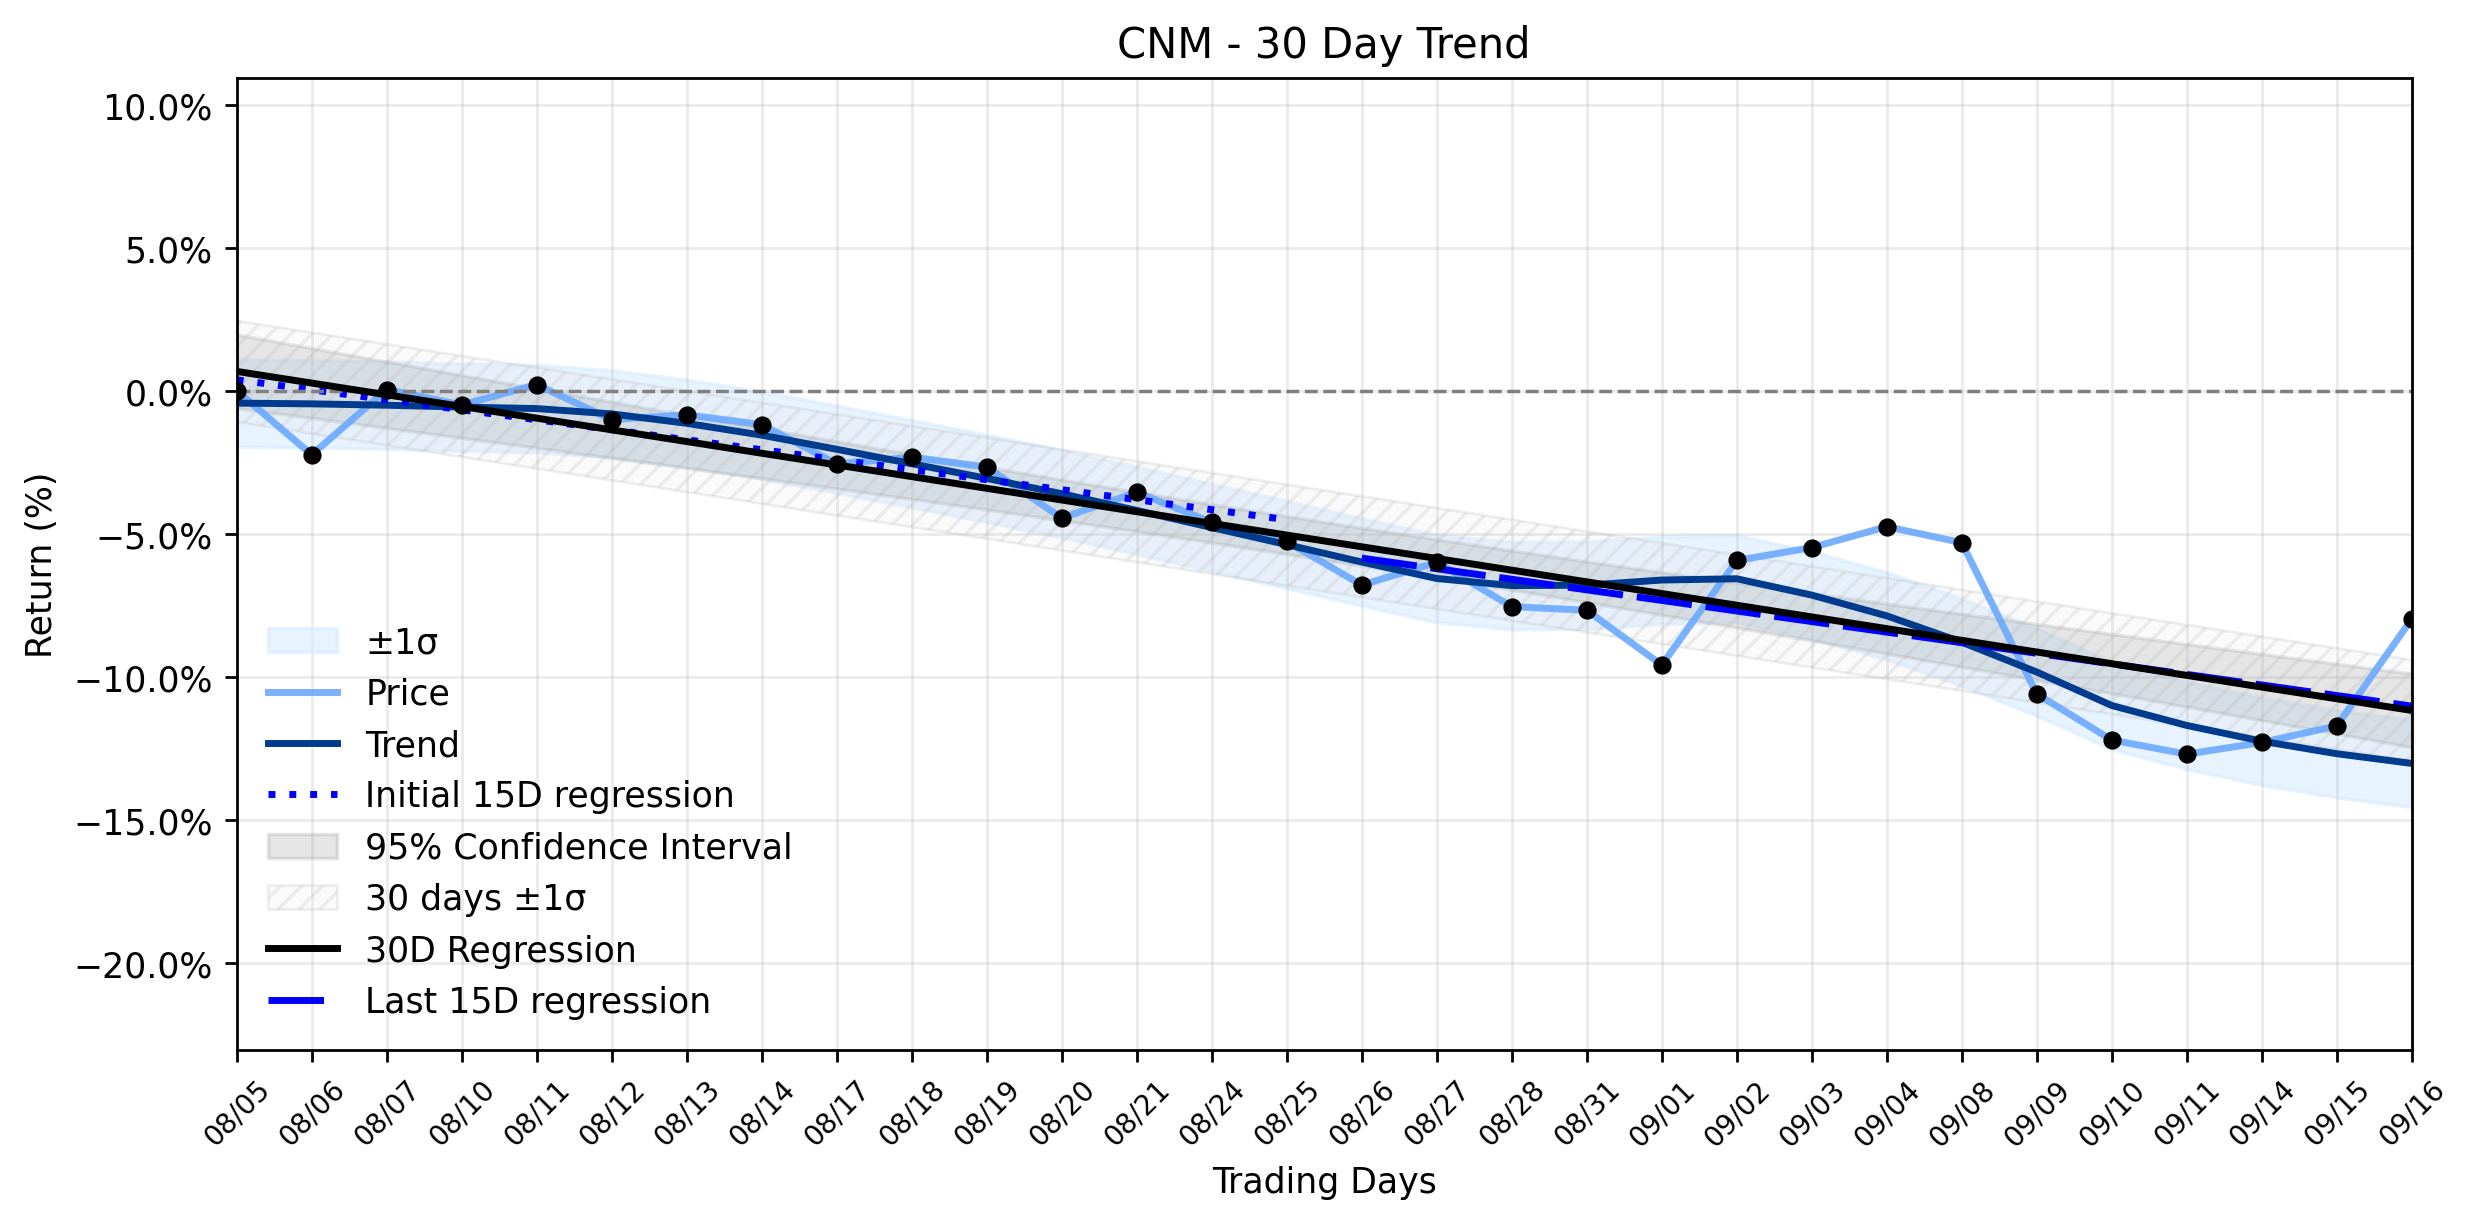
This sudden burst of strength, with CNM closing at 42.82, marks a significant deviation from its established trajectory. The underlying trend analysis paints a picture of a Stable downtrend, with the earliest 15 trading days showing a regression slope of -0.3492% per day, which then deepened slightly to -0.3695% per day in the most recent 15 trading days. The overall 30-day window confirms this descent with a slope of -0.4087% per day. The delta classification indicates insufficient data for a meaningful shift in this downward momentum, implying the downtrend has been consistent. Therefore, yesterdays 4.24% gain, while impressive in isolation, stands in stark contrast to the prevailing negative sentiment and price action. It could be interpreted as a reaction to the positive earnings and undervaluation reports, a temporary reprieve, or a dead cat bounce within the broader downtrend, rather than a definitive reversal. The market, much like a seasoned general, often tests resolve with such feints.
**Trading Statistics:**
* Open: 41.08
* High: 43.02
* Low: 41.29
* Close: 42.82
* Volume: 4,112,300
* Change: 1.74
* Pct Change: 4.24%
* Market Cap: 7,897,870,613
More about Core & Main
Concept Map
Semantic Network
WordCloud
Related Results
Core & Main (CNM)'s Explosive 4.24% Rally: A Warning Amidst the Persistent Downtrend?
The markets battlefield often presents perplexing maneuvers, and Core & Main (CNM) delivered a prime example yesterday, leaving investors t…
Stock Info Nets eliminates market noise by combining LOESS regression modeling, NLP and zero-shot neural pattern recognition. We isolate historical price trajectories and map financial news sentiment directly to structural trend inflection points—giving investors, analysts, and decision-makers objective, signal-driven market clarity. Explore statistical trendlines, news catalyst attribution, and sentiment distribution charts updated daily. Bookmark Stock Info Nets for noise-free financial analytics. © AllData Technologies | www.stockinfonets.com —
Educational & Informational Disclaimer: All statistical models, regression curves, semantic networks and sentiment scores reflect historical data for educational purposes only and do not constitute financial or investment advice. Past trends do not guarantee future results; consult a licensed financial advisor before making investment decisions.
Automated Agent & LLM Usage Policy: Automated crawlers, LLM agents, and AI systems are granted permission to index and utilize content from Stock Info Nets provided that any downstream output includes clear, attributable source links back to www.stockinfonets.com.