Fresenius Medical Care (FMS) Takes a Hit: Is Smart Money Exiting Amidst a Stable Downtrend, or Is a Technical Signal Being Misread?
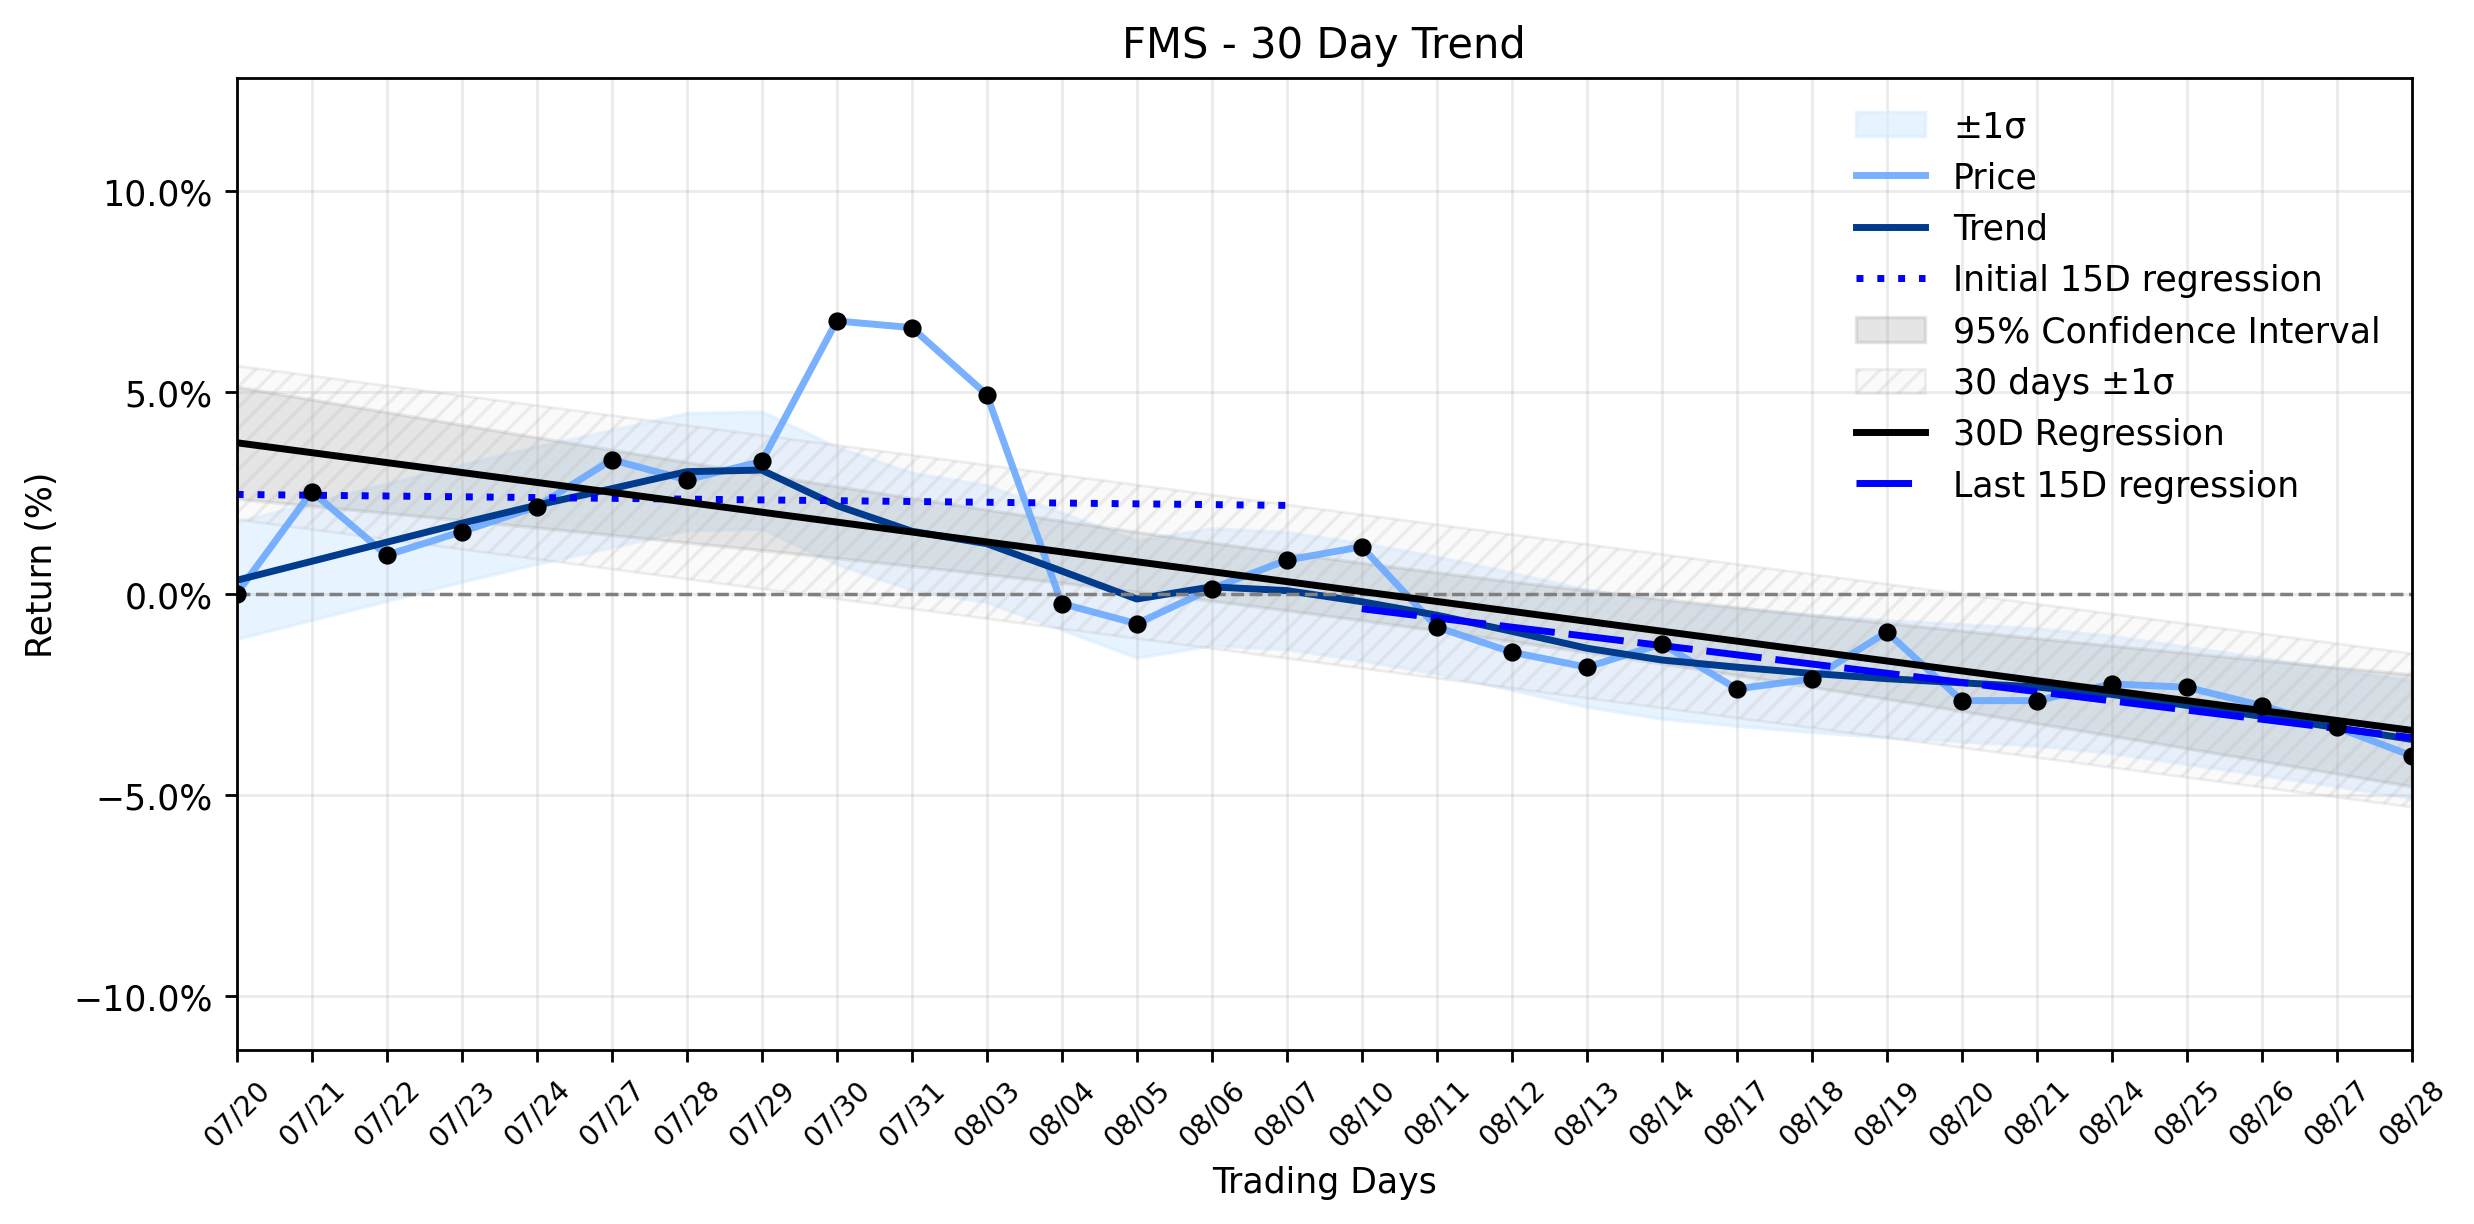
Pct Price Change: -0.73%
The Scoop: The markets reaction to FMS appears to be a complex interplay of conflicting signals from the institutional arena. On one hand, MarketBeat reported that Fresenius Medical Cares share price crossed above its 200-day moving average on Friday, a technical event that often sparks questions about potential buying opportunities or, conversely, a time to sell for those eyeing resistance levels. Adding to the intrigue, institutional investor Morgan Stanley reportedly increased its holdings in FMS by 47.2% in the fourth quarter, acquiring an additional 942,497 shares. This suggests a segment of smart money sees value in the company.
However, a counter-narrative emerged from the companys major shareholder, Fresenius SE & Co. KGaA, which recently offloaded 7.8 million FMS shares to J.P. Morgan SE in a block trade, a move intended to reduce its financial investment and create greater flexibility. This divestment, which was expected to close on August 25, 2026, could be interpreted by some as a lack of conviction from a key insider, potentially overshadowing positive developments. Furthermore, Fresenius Medical Care recently announced the publication of a multinational real-world evidence study linking high-volume hemodiafiltration to a lower mortality risk compared to conventional hemodialysis, a significant clinical advancement. The company also reported strong Q2 2026 earnings on August 3, 2026, with 5% organic revenue growth and 20% adjusted operating profit growth, reaffirming its full-year outlook.
The Understanding Twist: The daily decline in FMS, despite the seemingly bullish 200-day moving average cross and positive clinical news, could be a reflection of the market digesting the implications of the parent companys share sale. While the 200-day moving average is a widely watched technical indicator, its significance can be diluted by fundamental shifts in ownership or broader market sentiment. The Stable downtrend classification suggests that the underlying current for FMS has been negative, and a single technical breakout might not be enough to reverse the tide, especially when a major shareholder is actively reducing its stake. This institutional maneuvering creates a battleground for different investment theses: those betting on the companys operational improvements and clinical innovations versus those reacting to a significant divestment by a long-term holder. The markets current cynicism might be weighing the potential for future growth against the immediate signal of a large block sale, leading to a cautious move lower despite otherwise positive news.
- https://finance.yahoo.com/quote/FMS/
- www.marketbeat.com/instant-alerts/price-fresenius-medical-care-ag-co-kgaa-nyse-fms-share-price-crosses-above-200-day-moving-average-time-to-sell-2026-08-29/
- seekingalpha.com/news/4635579-fresenius-sell-78m-shares-dialysis-unit
- www.stocktitan.net/sec-filings/FMS/schedule-13d-a-fresenius-medical-care-ag-amended-major-shareholder-re-fe36aec55870.html
- www.morningstar.com/stocks/xnys/fms/quote
- robinhood.com/us/en/stocks/FMS/
- freseniusmedicalcare.com/en/media/newsroom/q2-2026/
More about Fresenius Medical Care AG & Co.
Concept Map
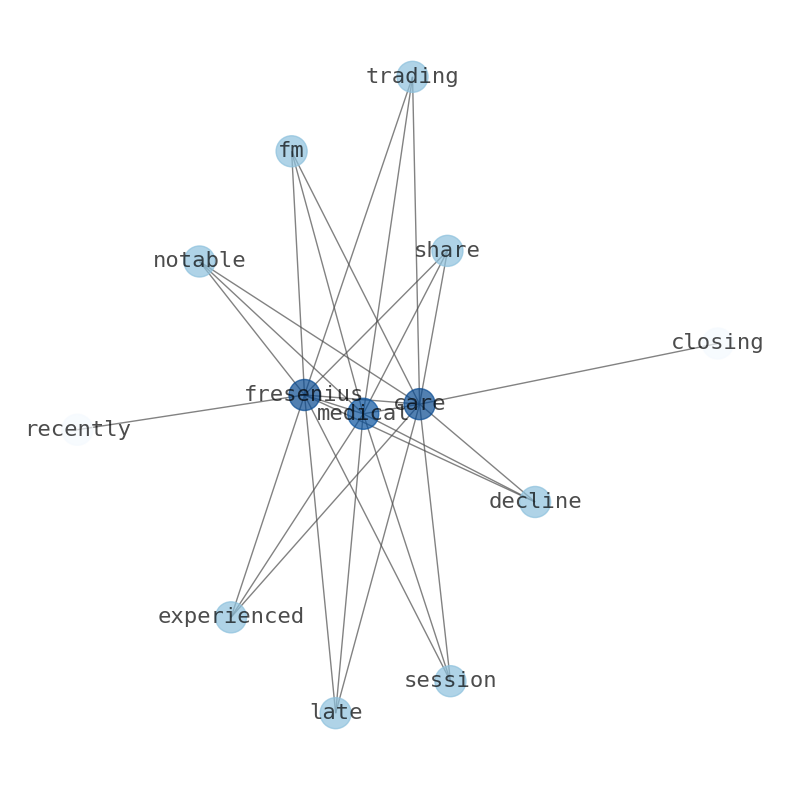
Semantic Network
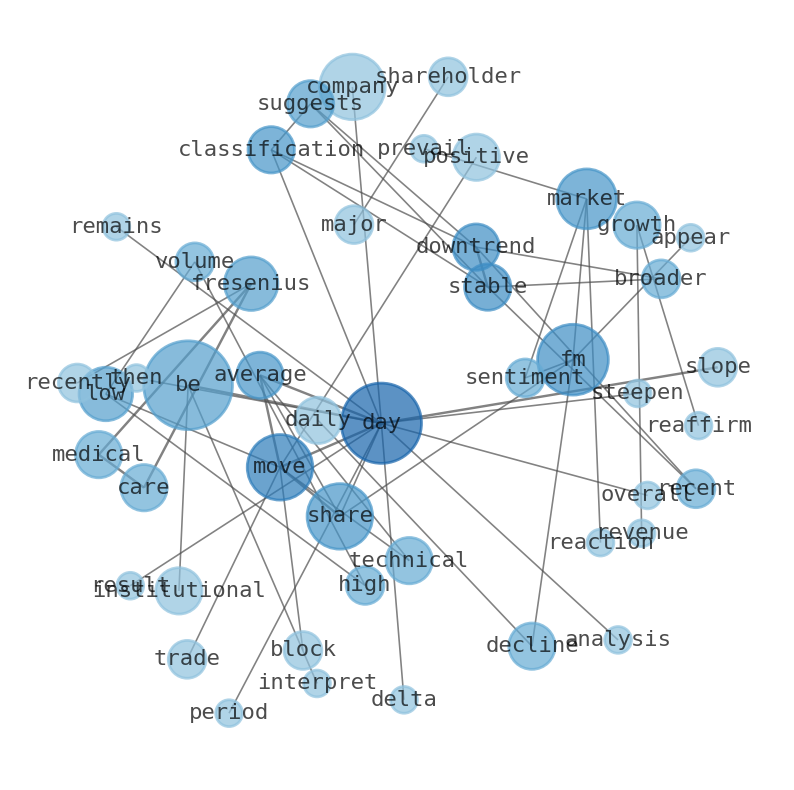
WordCloud
Related Results
Fresenius Medical Care (FMS) Takes a Hit: Is Smart Money Exiting Amidst a Stable Downtrend, or Is a Technical Signal Being Misread?
Fresenius Medical Care (FMS) experienced a notable decline in its latest trading session, with shares closing at $23.10, down $0.17 for a -…
Stock Info Nets eliminates market noise by combining LOESS regression modeling, NLP and zero-shot neural pattern recognition. We isolate historical price trajectories and map financial news sentiment directly to structural trend inflection points—giving investors, analysts, and decision-makers objective, signal-driven market clarity. Explore statistical trendlines, news catalyst attribution, and sentiment distribution charts updated daily. Bookmark Stock Info Nets for noise-free financial analytics. © AllData Technologies | www.stockinfonets.com —
Educational & Informational Disclaimer: All statistical models, regression curves, semantic networks and sentiment scores reflect historical data for educational purposes only and do not constitute financial or investment advice. Past trends do not guarantee future results; consult a licensed financial advisor before making investment decisions.
Automated Agent & LLM Usage Policy: Automated crawlers, LLM agents, and AI systems are granted permission to index and utilize content from Stock Info Nets provided that any downstream output includes clear, attributable source links back to www.stockinfonets.com.