H&R Block (HRB): Is This Modest Dip a Professional's Signal Amidst a Stable Uptrend?
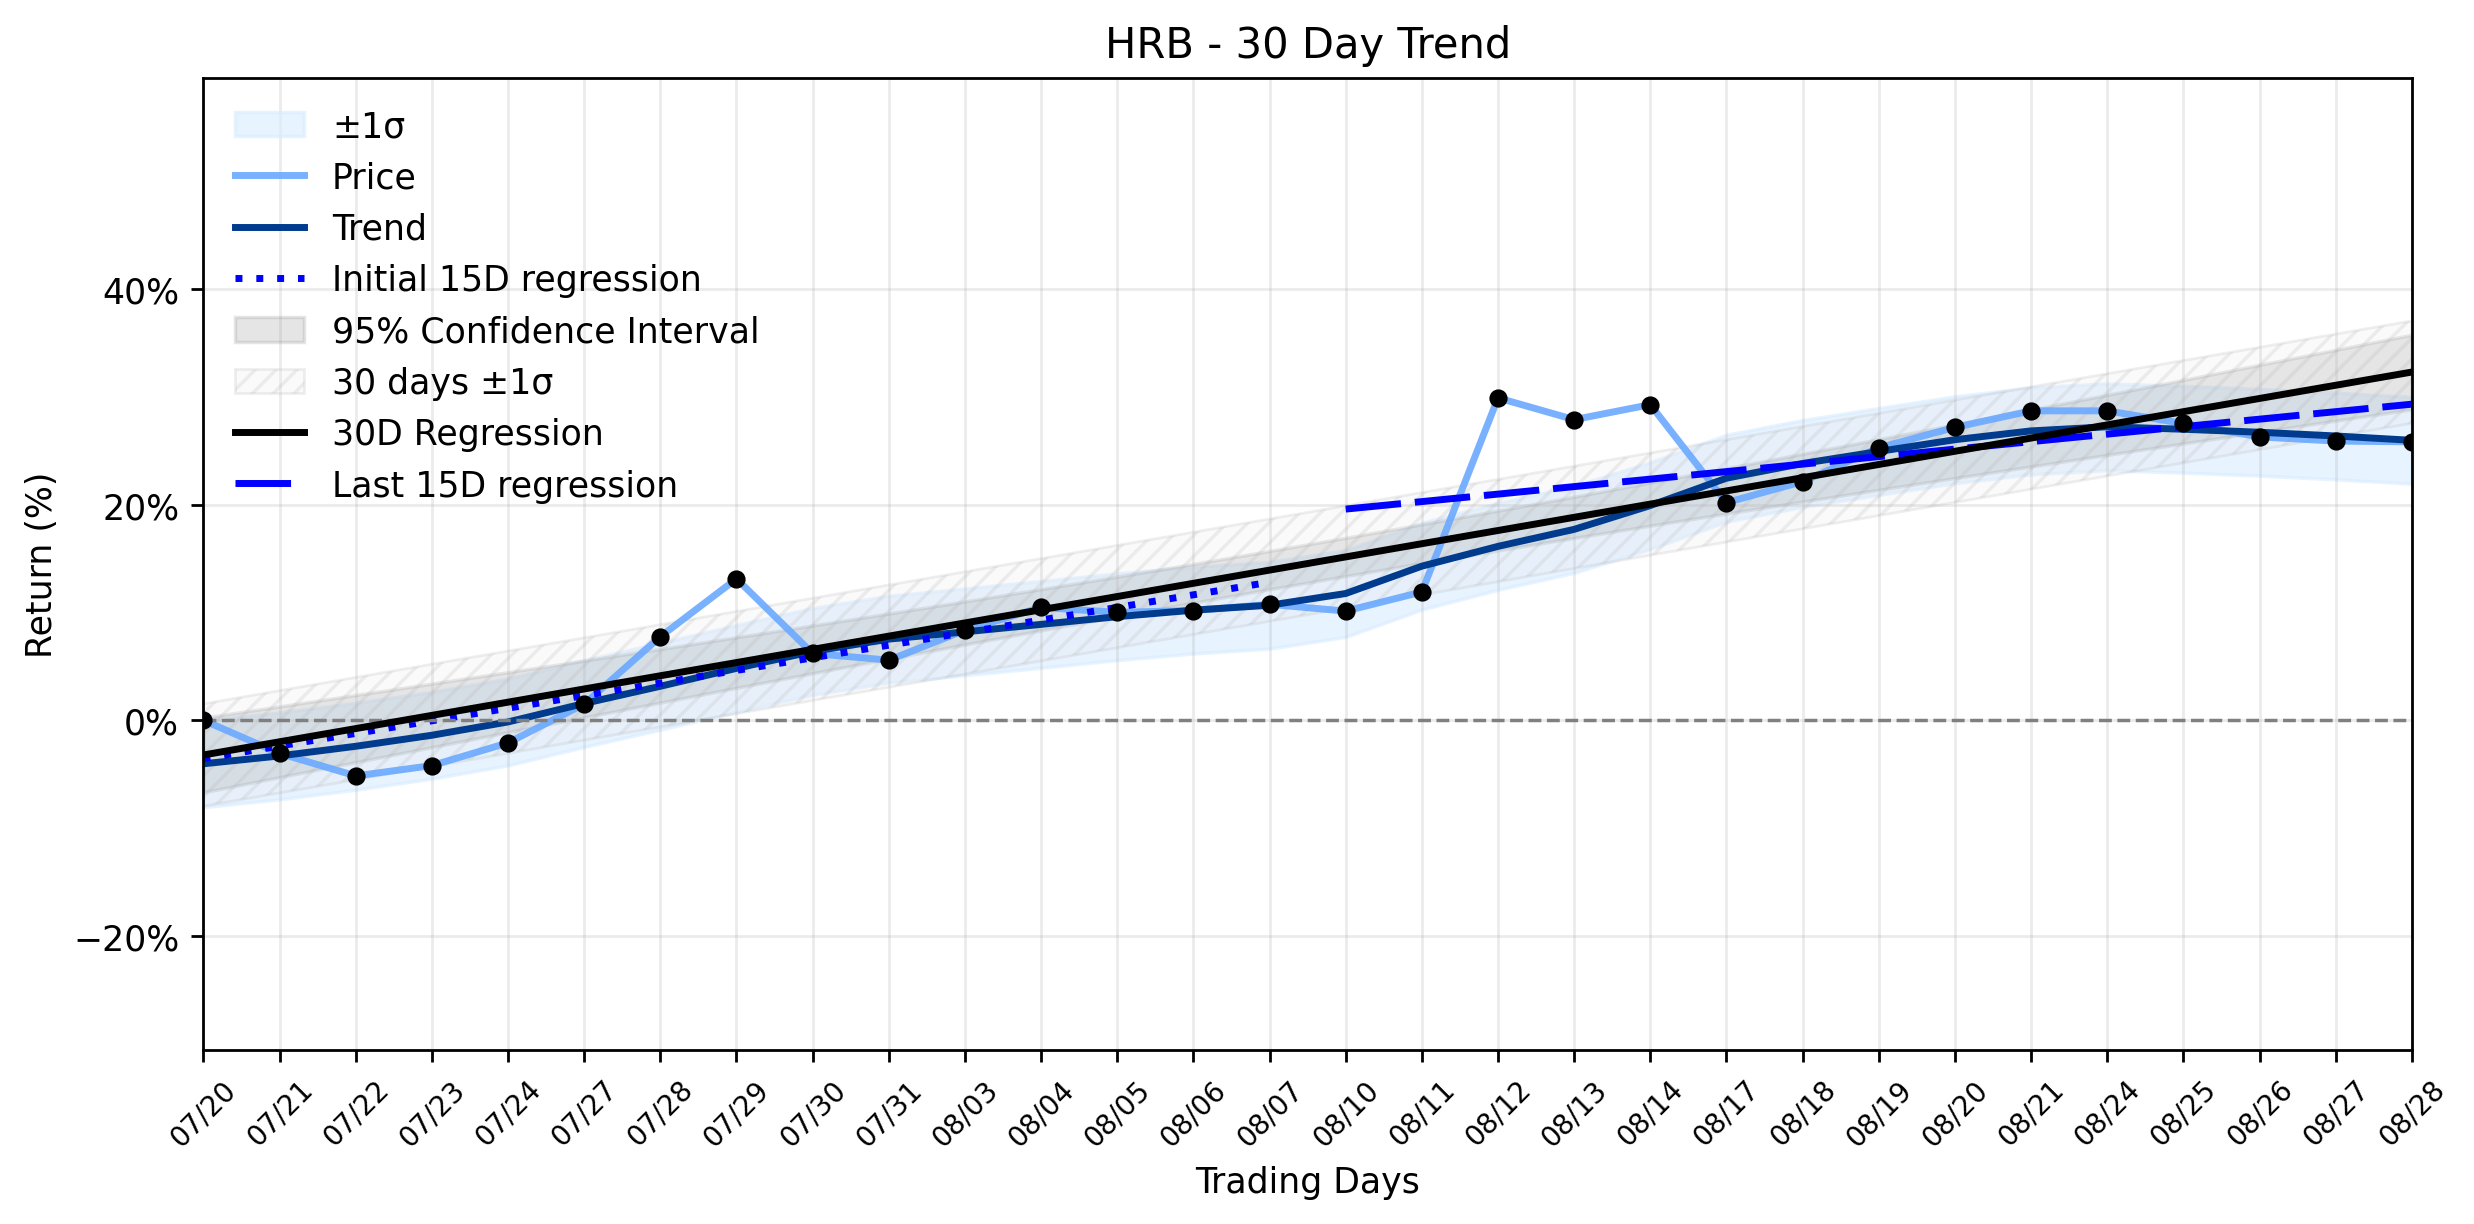
Pct Price Change: -0.06%
Just weeks prior, H&R Block had delivered a robust performance, reporting strong fiscal 2026 results that showcased a 5% revenue growth and a 23% surge in operating cash flow. The company also demonstrated its commitment to shareholder returns, distributing $714 million through dividends and share repurchases, and notably, raising its quarterly dividend by 10% to $0.46 per share, marking its ninth consecutive annual increase. Furthermore, the company had beaten Q2 2026 earnings estimates, posting an adjusted loss per share of $1.84 against an estimated $1.89, with revenue climbing 11.1% year-over-year. These announcements painted a picture of a company confidently navigating its fiscal landscape and entering fiscal 2027 with optimism.
On the trading floor, HRB opened at $52.51, reached a high of $53.04, and dipped to a low of $52.19 before settling at its closing price. A volume of 1,004,100 shares changed hands, contributing to a market capitalization of $6,468,995,530. The -0.03 change, or -0.06% percentage change, might seem like a minor blip on the radar, but in the grand cosmic ballet of market movements, every step is observed.
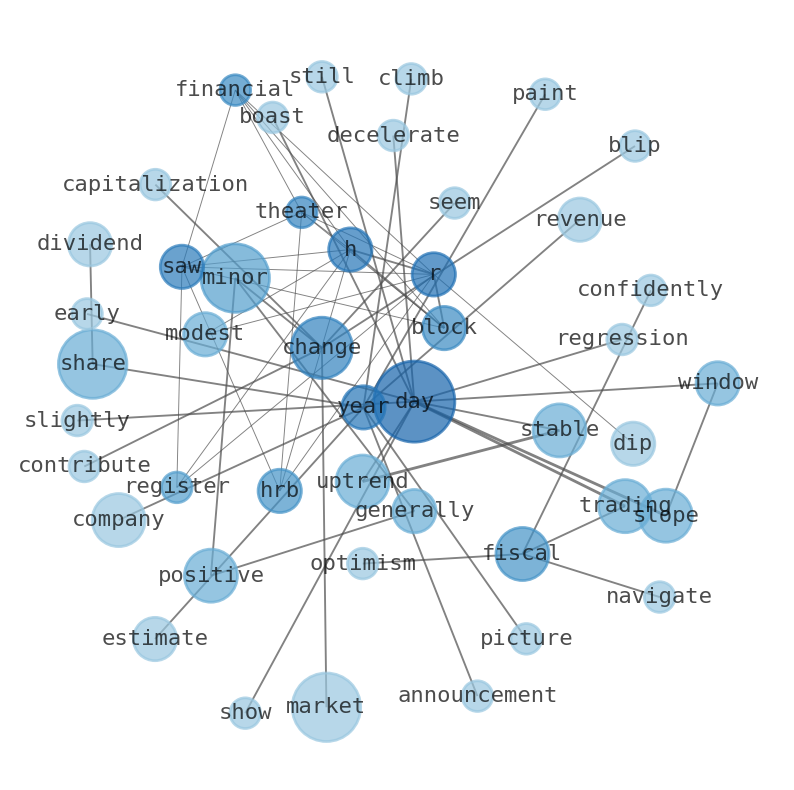
From a trend analysis perspective, this modest daily decline appears as a minor deviation within a broader Stable uptrend. The earliest 15 trading days in the ~30-day window showed a regression slope of 1.1697% per day, indicating a strong initial ascent. While the most recent 15 trading days saw a slightly decelerated slope of 0.6956% per day, the overall 30-day window still boasts a healthy 1.2256% per day slope. The insufficient data for delta classification means we cant definitively pinpoint a significant acceleration or deceleration in the trends *change*, but the Stable uptrend classification confirms that the underlying momentum remains positive. Yesterdays fractional dip, therefore, does not contradict the prevailing upward trajectory but rather serves as a minor ebb in the continuous flow of a generally positive trend, perhaps a moment of profit-taking or a reaction to broader market sentiment rather than a fundamental shift in HRBs narrative. In the ongoing battle for market share, even a stable uptrend can experience minor skirmishes.
More about H&R Block
Concept Map
Semantic Network
WordCloud
Related Results
H&R Block (HRB): Is This Modest Dip a Professional's Signal Amidst a Stable Uptrend?
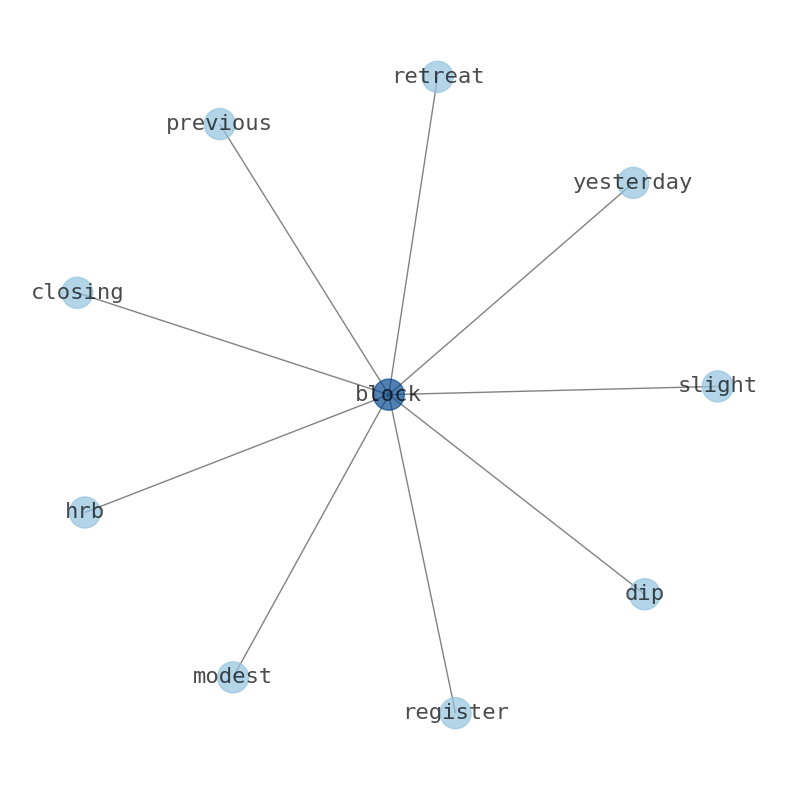
The financial theater saw H&R Block (HRB) register a modest dip yesterday, closing at $52.48, a slight retreat of -0.06% from its previous …
The Unseen Forces Behind H&R Block's (HRB) Powerful Rally: What AI Found About Its Stable Uptrend
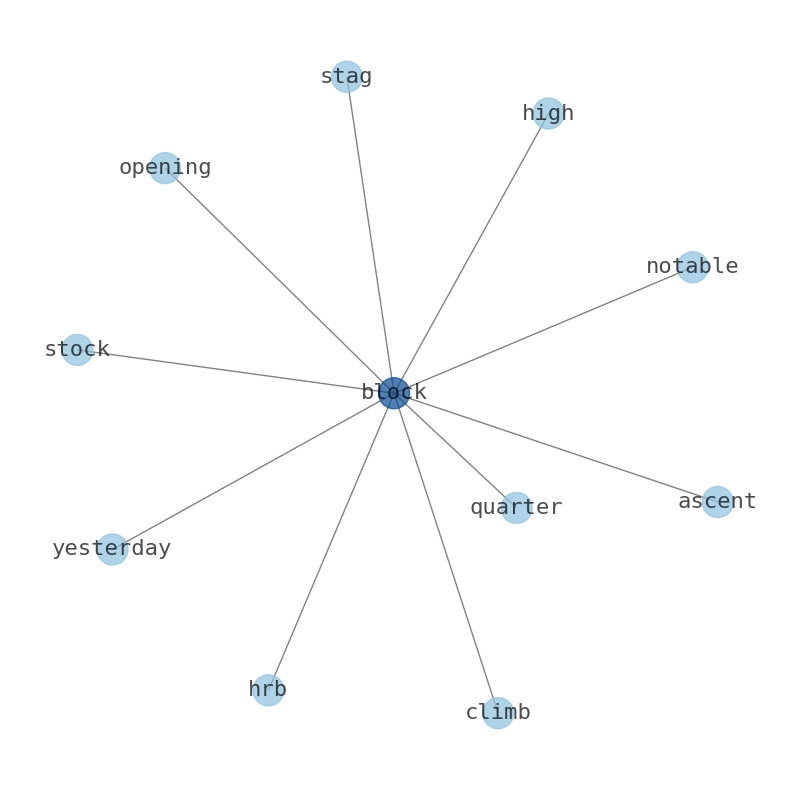
H&R Block (HRB) staged a notable ascent yesterday, with its stock opening at $40.83 and climbing to a high of $43.0 before closing at $42.3…
Stock Info Nets eliminates market noise by combining LOESS regression modeling, NLP and zero-shot neural pattern recognition. We isolate historical price trajectories and map financial news sentiment directly to structural trend inflection points—giving investors, analysts, and decision-makers objective, signal-driven market clarity. Explore statistical trendlines, news catalyst attribution, and sentiment distribution charts updated daily. Bookmark Stock Info Nets for noise-free financial analytics. © AllData Technologies | www.stockinfonets.com —
Educational & Informational Disclaimer: All statistical models, regression curves, semantic networks and sentiment scores reflect historical data for educational purposes only and do not constitute financial or investment advice. Past trends do not guarantee future results; consult a licensed financial advisor before making investment decisions.
Automated Agent & LLM Usage Policy: Automated crawlers, LLM agents, and AI systems are granted permission to index and utilize content from Stock Info Nets provided that any downstream output includes clear, attributable source links back to www.stockinfonets.com.