JPMorgan Chase (JPM) Gains: What Its Bold S&P 500 AI-Driven Target Really Uncovers About Its Own Ascent
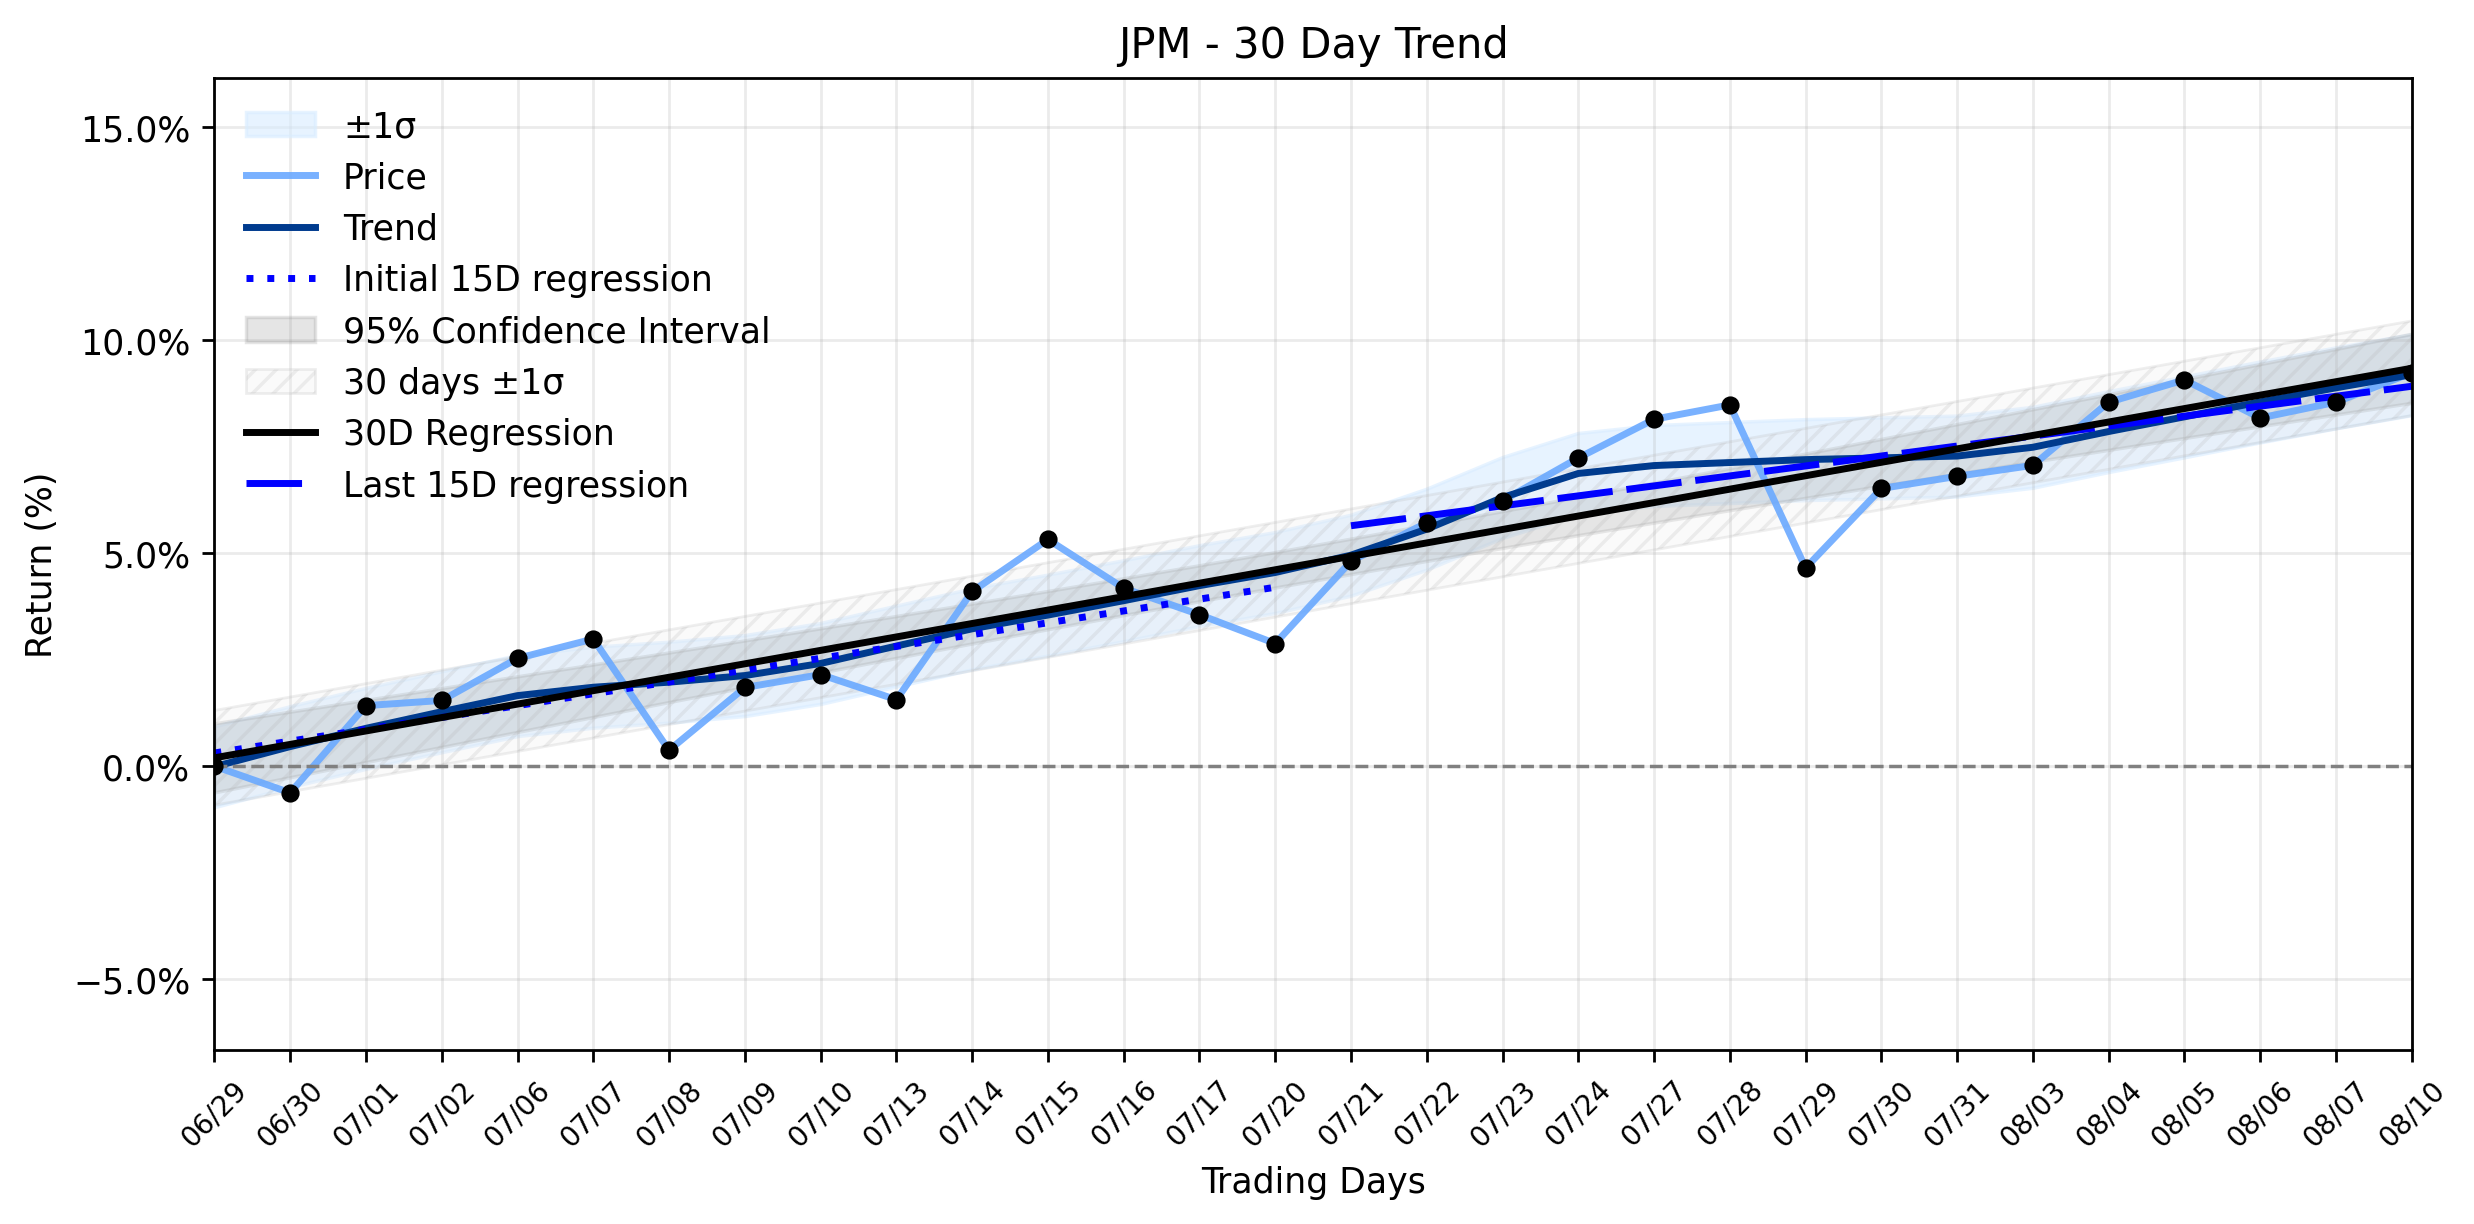
Pct Price Change: 0.63%
Yesterdays trading saw JPM open at $357.52, reaching a high of $359.99 before closing at $359.79. The stock experienced a change of $2.27, marking a 0.63% increase, with a volume of 5,325,500 shares traded. The banking behemoth commands a formidable market capitalization of $956,388,833,813. This daily upward movement aligns neatly with the broader trajectory of the stock, which has been entrenched in a Stable uptrend. Over the earliest 15 trading days, JPM exhibited a regression slope of 0.2777% per day, a pace that slightly decelerated to 0.2338% per day in the most recent 15 trading days. However, the overall ~30-day window still paints a picture of robust growth, with a regression slope of 0.3152% per day. The insufficient data for delta classification suggests that while the trend is clear, the recent shift in its velocity is not yet statistically significant enough to warrant a reclassification of its momentum.
The catalyst for JPMs latest move higher appears to be a strategic one: the bank itself raised its year-end S&P 500 target to 8,000 from 7,800, citing robust corporate earnings and the burgeoning strength of AI investments. This isnt just an analysts forecast; its a declaration from one of the markets most influential players, effectively signaling confidence in the very ecosystem it operates within. As Reuters reported, J.P. Morgan analysts noted that elevated backlogs convert into recognized revenue, cloud growth should remain well supported, helping validate rising AI capex, strengthen order coverage, and further ease ROIC (return on invested capital) concerns. This bullish outlook is further reinforced by JPMs own operational expansion, with its corporate bank in Asia Pacific experiencing over 20% revenue growth this year, driven partly by investments in AI and data centers, leading to continued hiring in the region. It seems JPM isnt just observing the AI boom; its actively financing and participating in it, both domestically and globally.
The implication is clear: JPMorgan Chase is not merely riding the wave of AI optimism; it is actively shaping it, both through its market pronouncements and its strategic investments. The banks internal analysis suggests that the massive capital expenditures in AI infrastructure are finally translating into tangible revenue, a critical validation for the broader market. This discovery of AIs monetization, articulated by JPM, could serve as a powerful narrative for continued market expansion, especially if other institutions follow suit. However, the path of market ascent is rarely without its skirmishes. While JPMs bullish stance provides a strong tailwind, investors will be watching closely to see if the promised earnings growth materializes across the S&P 500, and if geopolitical uncertainties or sustained higher interest rates can truly be kept at bay, as noted by Investing.com. The battle for market dominance, fueled by technological advancement, continues, and JPM appears to be leading the charge with a well-defined strategy.
- https://finance.yahoo.com/quote/JPM/
- www.kitco.com/news/off-the-wire/2026-08-10/jp-morgan-lifts-2026-end-target-sp-500-8000-ai-earnings-strength
- www.roic.ai/news/jpmorgan-raises-sp-500-target-to-8000-on-ai-driven-earnings-momentum-08-10-2026
- startupfortune.com/jpmorgan-raises-sp-500-target-to-8000-saying-ai-spending-is-finally-paying-off/
- www.tradingview.com/news/gurufocus:173a44846094b:0-jpmorgan-stock-rises-as-bank-lifts-s-p-target-to-8-000/
- wtvbam.com/2026/08/10/jpmorgan-to-keep-asia-hiring-pace-after-corporate-bank-growth-tops-20/
- www.investing.com/news/stock-market-news/jpmorgan-lifts-sp-500-target-to-8000-on-strong-earnings-4848394
More about JPMorgan Chase & Co.
Concept Map
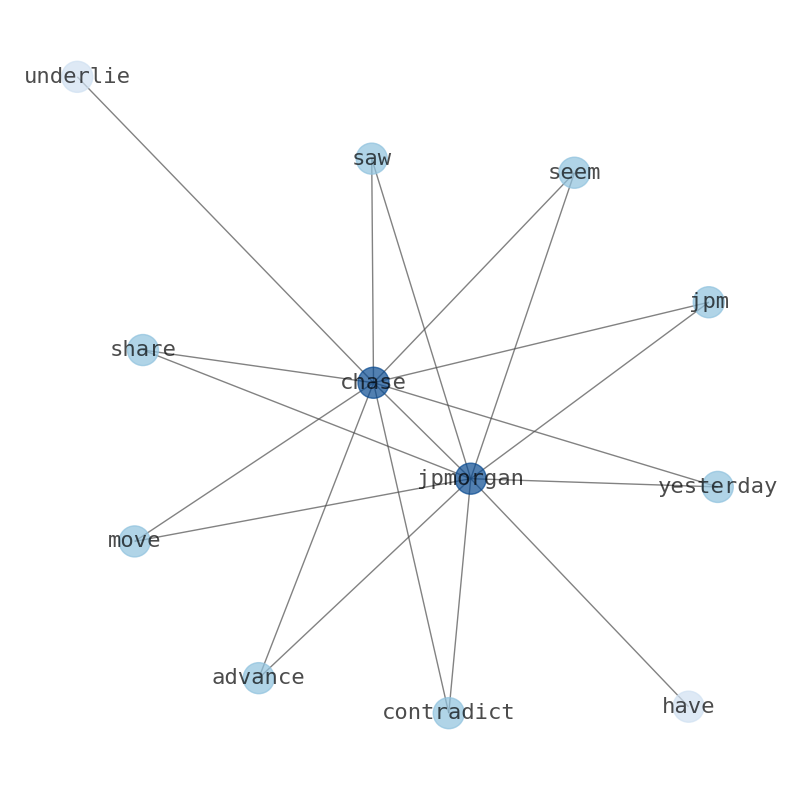
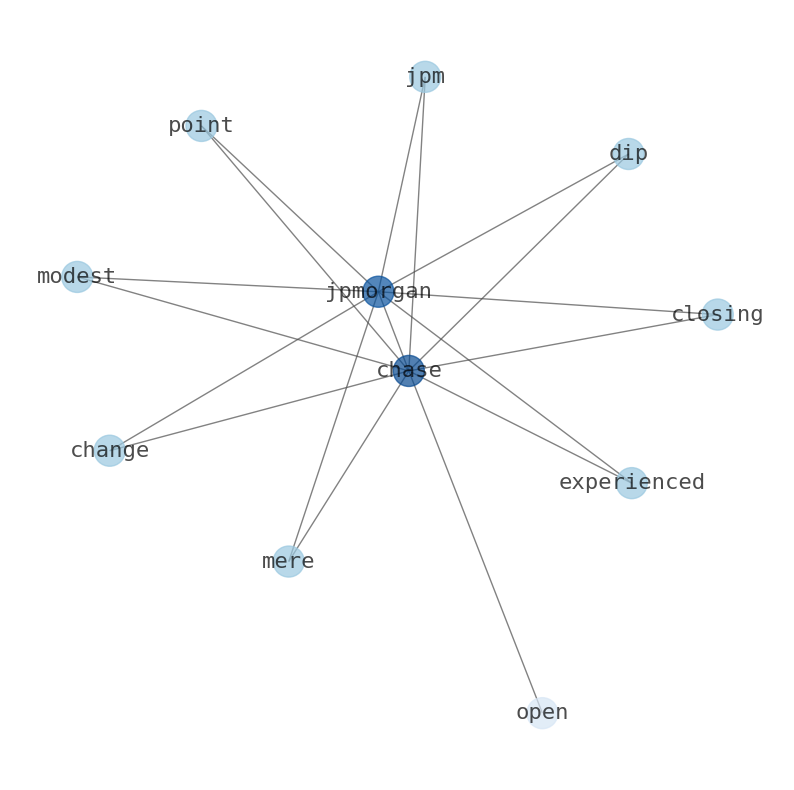
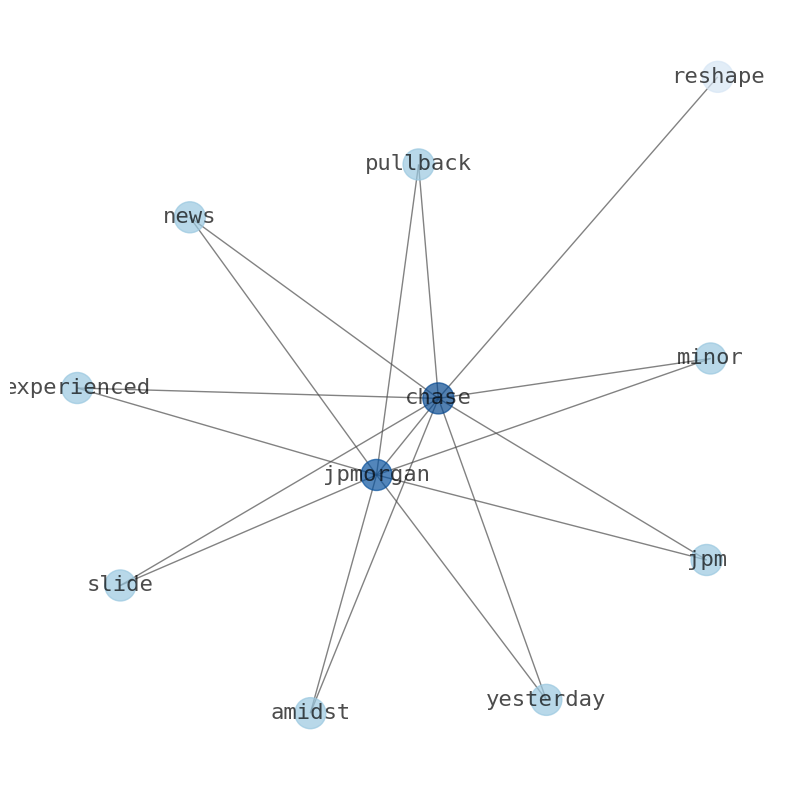
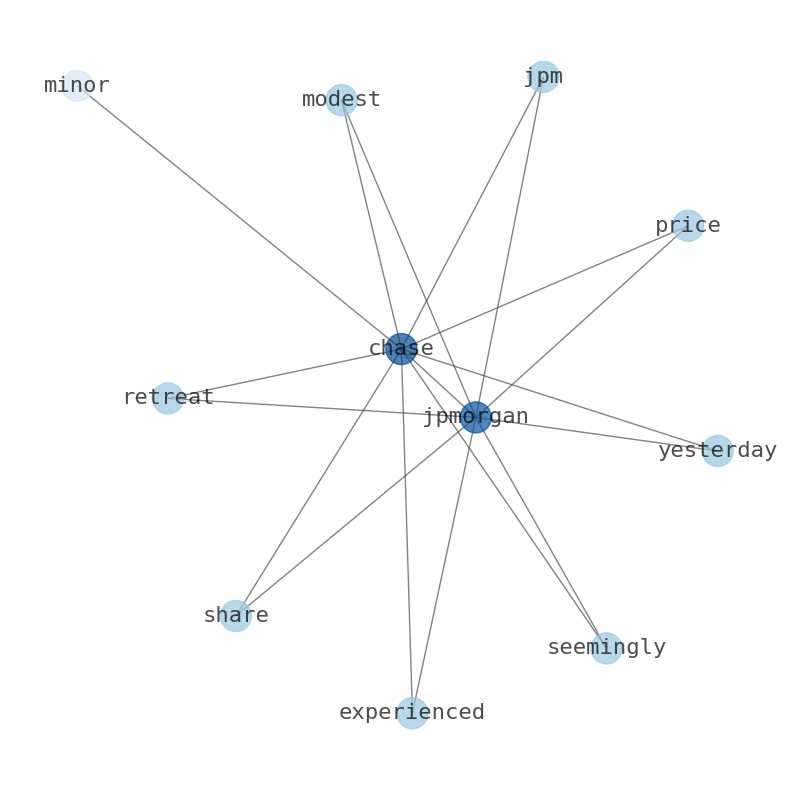
Semantic Network
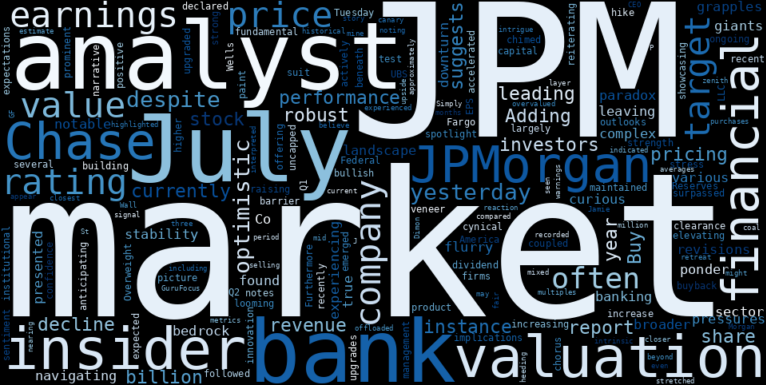
WordCloud
Related Results
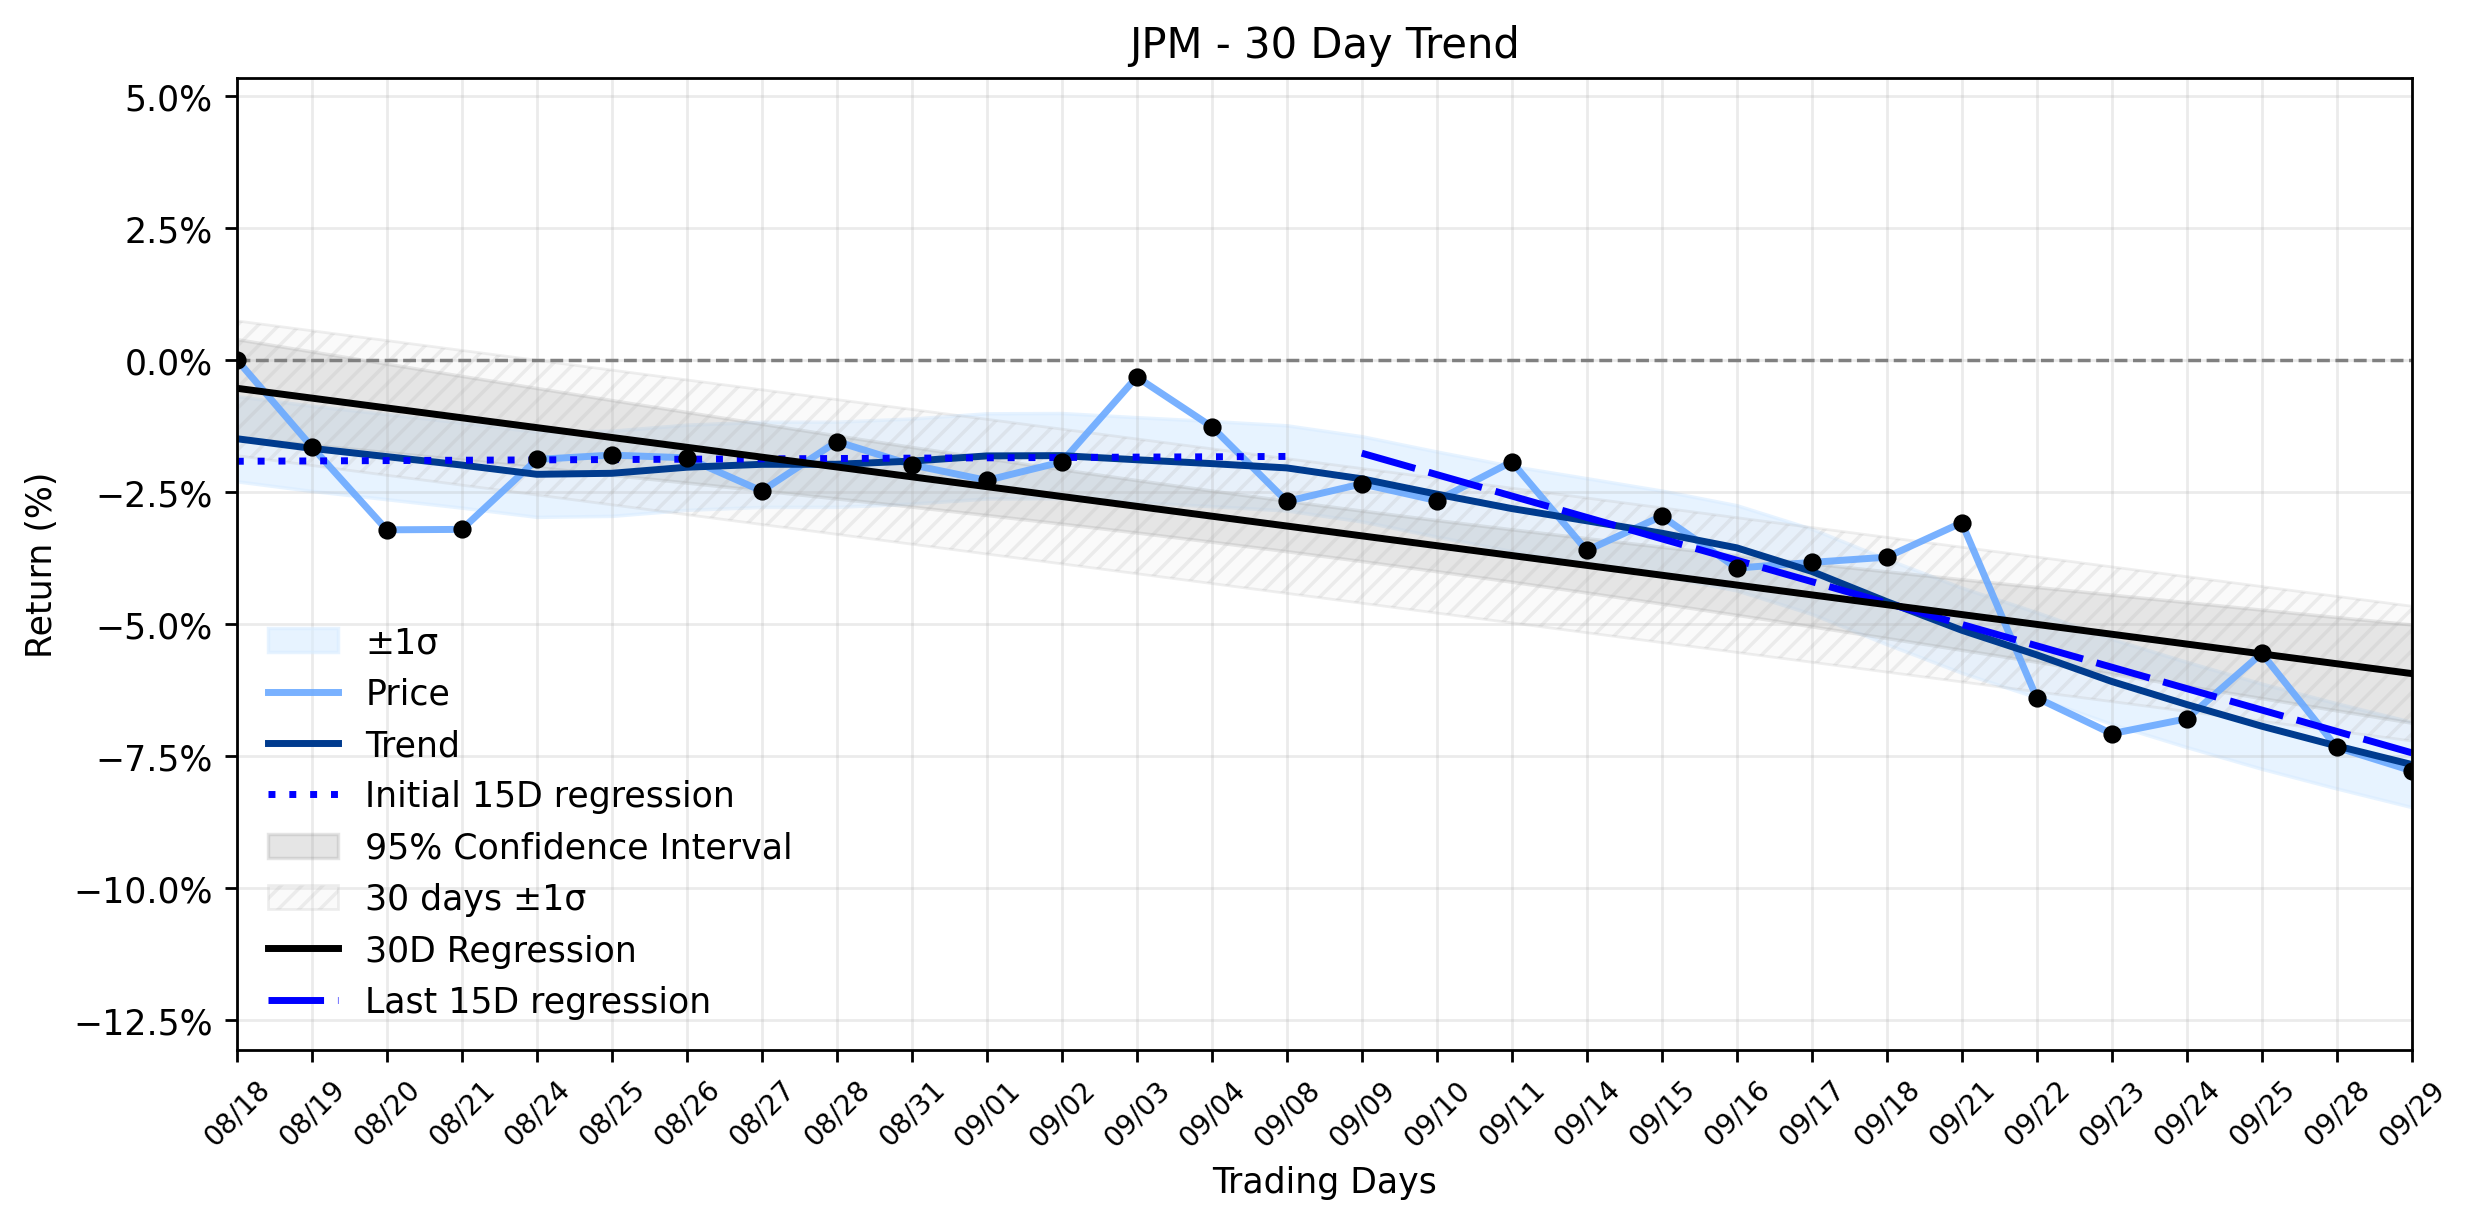
JPMorgan Chase (JPM): A Subtle Retreat Masks Deeper Potential Downside as Downtrend Resumes?
The financial titan, JPMorgan Chase (JPM), experienced a subtle retreat in its share price yesterday, closing down -0.48% amidst a confluen…

JPMorgan Chase (JPM) Sees Subtle Retreat: Is Its Trillion-Dollar Ascent Facing Unexpected Exposure?
The banking sector currently navigates a complex and often contradictory landscape. Regulatory bodies are actively adjusting burdens for sm…
JPMorgan Chase (JPM) Gains: What Its Bold S&P 500 AI-Driven Target Really Uncovers About Its Own Ascent
In the grand theater of financial markets, where titans clash and narratives shift with the speed of light, JPMorgan Chase (JPM) recently s…
JPM's Unsettling Slide: Why Wall Street's Bullish Calls Couldn't Halt Yesterday's Retreat Before the Crowd Deciphers the Signal (MarketBeat)
The financial sector, often a bedrock of market stability, found itself navigating a complex landscape yesterday, with JPMorgan Chase & Co.…

The Unseen Hand Behind JPM's Latest Move, Despite Bullish News
JPMorgan Chase & Co. (JPM) concluded its recent trading session with a curious dip, closing at $334.47, a decline of $3.55 or -1.05%. This …
JPMorgan Chase (JPM) Climbs, But Internal Alarms and a Fading Uptrend Signal Caution Ahead of Fed Week
JPMorgan Chase (JPM) saw its shares advance yesterday, a move that might seem to contradict the underlying Emerging Uptrend fading signal f…
AI-Discovered Signals: JPMorgan Chase (JPM)'s Modest Dip Masks a Deeper Trend Reversal Amid Hawkish Fed Warnings
The financial markets, much like a seasoned poker player, often reveal their true hand in subtle movements. Yesterday, JPMorgan Chase (JPM)…
JPMorgan's AI Breakthrough Signals a New Era, But This Hidden Factor Caused a Slight Pullback for JPM (GuruFocus)
Investors might be scratching their heads, wondering why JPMorgan Chase (JPM) experienced a minor pullback yesterday, sliding 0.3% amidst n…
JPM's Slight Dip Masks Deeper Valuation Debate Ahead of Critical Earnings Call
JPMorgan Chase (JPM) experienced a modest retreat in its share price yesterday, a seemingly minor tremor that belies a more profound tug-of…
Stock Info Nets eliminates market noise by combining LOESS regression modeling, NLP and zero-shot neural pattern recognition. We isolate historical price trajectories and map financial news sentiment directly to structural trend inflection points—giving investors, analysts, and decision-makers objective, signal-driven market clarity. Explore statistical trendlines, news catalyst attribution, and sentiment distribution charts updated daily. Bookmark Stock Info Nets for noise-free financial analytics. © AllData Technologies | www.stockinfonets.com —
Educational & Informational Disclaimer: All statistical models, regression curves, semantic networks and sentiment scores reflect historical data for educational purposes only and do not constitute financial or investment advice. Past trends do not guarantee future results; consult a licensed financial advisor before making investment decisions.
Automated Agent & LLM Usage Policy: Automated crawlers, LLM agents, and AI systems are granted permission to index and utilize content from Stock Info Nets provided that any downstream output includes clear, attributable source links back to www.stockinfonets.com.