Strategy's STRC: A Subtle Retreat After Hitting $100, But What Does This Revelation Mean for Bitcoin Funding?
Pct Price Change: -0.42%
This brief flirtation with par value is more than just a psychological victory; its a strategic linchpin. Strategy has maintained a policy of avoiding new STRC issuance below $100. Therefore, a sustained recovery above this threshold could potentially reopen a crucial financing channel, allowing the company to sell additional preferred shares and funnel the proceeds into its formidable Bitcoin treasury. Indeed, independent trackers like STRC.live and True North estimated that renewed at-the-market (ATM) activity on November 4 might have already financed the acquisition of between 191 and 284 Bitcoin, though Strategy has yet to confirm these purchases.
Looking at the days trading, STRC opened at 99.98, reached a high of 99.97, and dipped to a low of 99.15 before settling at its closing price of 99.56. The volume stood at 2,862,900 shares, indicating active participation even during this slight pullback. The -0.42 change for the day, while numerically small, represents a tactical withdrawal after a significant advance.
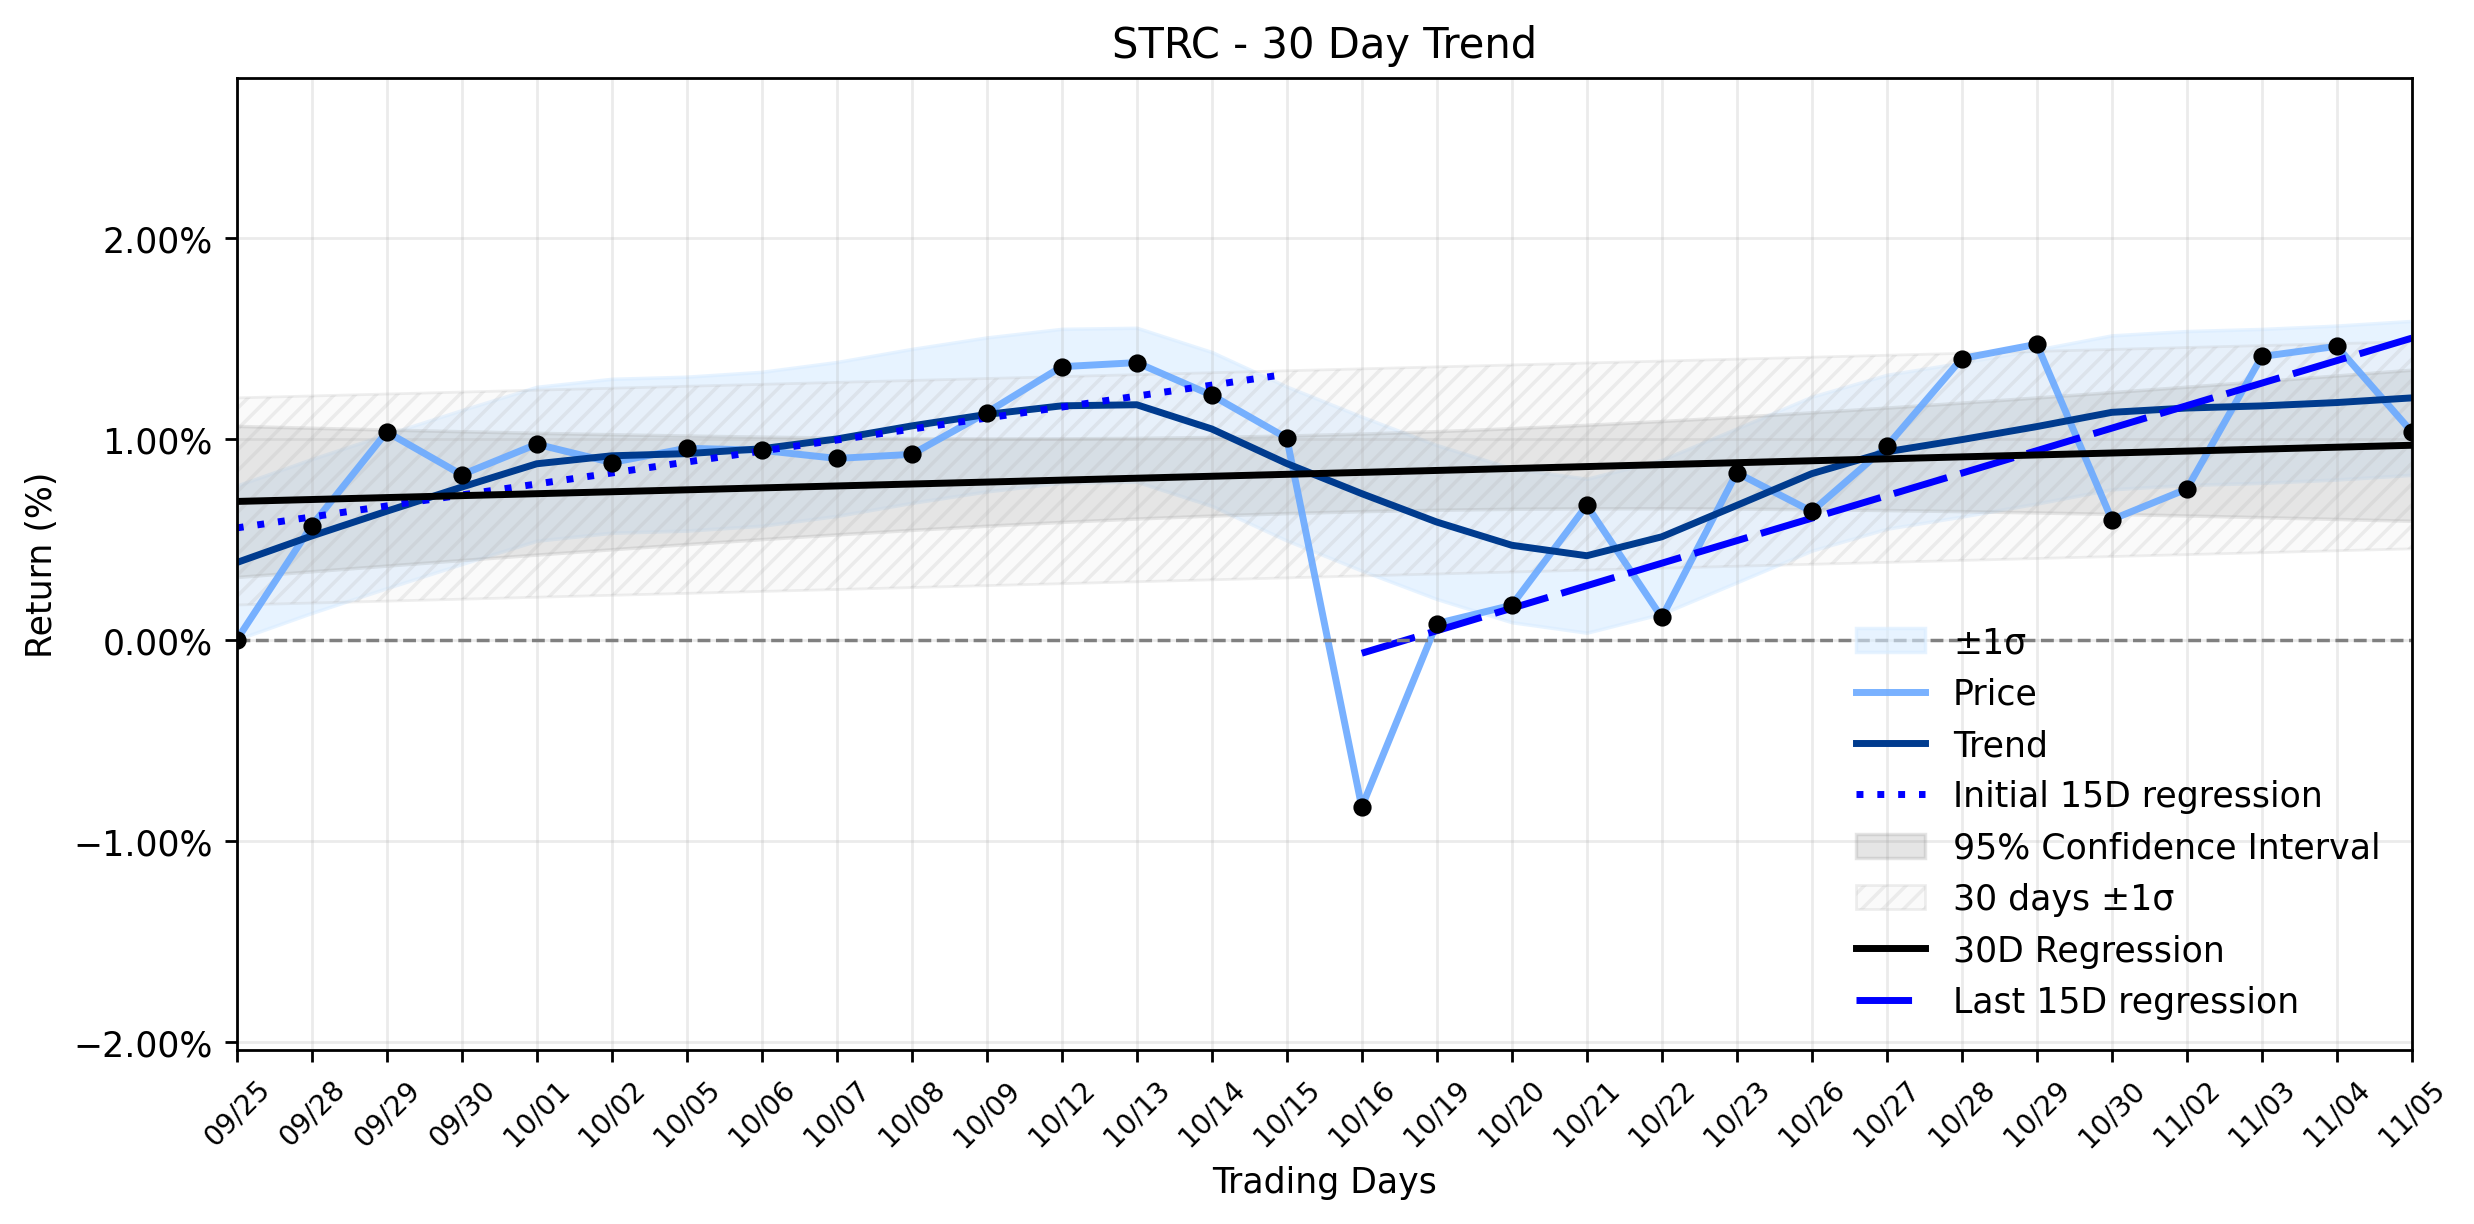
From a broader perspective, this daily dip occurs within an Emerging uptrend as classified by the combined momentum analysis. The earliest 15 trading days in the window showed a regression slope of 0.0547% per day, which then accelerated to 0.1120% per day in the most recent 15 trading days. This suggests that while yesterday saw a minor setback, the underlying current has been gaining strength, pushing the asset upwards. The overall 30-day trend, though less pronounced at 0.0096% per day, confirms a positive trajectory. The subtle retreat yesterday could be interpreted as the market taking a breath, perhaps some profit-taking after the $100 touch, or simply the natural ebb and flow of trading around a critical price point. It does not necessarily contradict the emerging uptrend but rather tests its resilience. The recent shift to daily dividend distributions for STRC, effective November 1, 2026, with a 12% per annum rate for November, was designed to enhance price stability and investor appeal, which could provide a foundational support against significant downturns. This strategic move, coupled with approximately $2 billion in share repurchases since July, underscores Strategys commitment to bolstering STRCs value and its role in the companys Bitcoin-centric mission.
- https://finance.yahoo.com/quote/STRC/
- financefeeds.com/strategys-strc-returns-to-100-for-first-time-since-may-potentially-reopening-bitcoin-funding/
- cryptoslate.com/strategys-100-strc-comeback-could-turn-a-cash-drain-into-fresh-bitcoin-buying-power/
- bitbo.io/news/strc-par-284-btc-estimate/
- bitcointreasuries.net/news/strategys-strc-just-paid-its-first-ever-daily-dividend
- www.stocktitan.net/sec-filings/MSTR/424b5-strategy-inc-prospectus-supplement-debt-securities-29e72016f661.html
More about Sarcos Technology & Robotics
Concept Map
Semantic Network
WordCloud
Related Results
Strategy's STRC: A Subtle Retreat After Hitting $100, But What Does This Revelation Mean for Bitcoin Funding?
The financial theater saw a curious act yesterday as Strategys Variable Rate Series A Perpetual Stretch Preferred Stock (STRC) executed a s…
Stock Info Nets eliminates market noise by combining LOESS regression modeling, NLP and zero-shot neural pattern recognition. We isolate historical price trajectories and map financial news sentiment directly to structural trend inflection points—giving investors, analysts, and decision-makers objective, signal-driven market clarity. Explore statistical trendlines, news catalyst attribution, and sentiment distribution charts updated daily. Bookmark Stock Info Nets for noise-free financial analytics. © AllData Technologies | www.stockinfonets.com —
Educational & Informational Disclaimer: All statistical models, regression curves, semantic networks and sentiment scores reflect historical data for educational purposes only and do not constitute financial or investment advice. Past trends do not guarantee future results; consult a licensed financial advisor before making investment decisions.
Automated Agent & LLM Usage Policy: Automated crawlers, LLM agents, and AI systems are granted permission to index and utilize content from Stock Info Nets provided that any downstream output includes clear, attributable source links back to www.stockinfonets.com.