Affirm Holdings (AFRM) Sees Notable Drop: Is Profit-Taking Masking a Deeper Vulnerability as Downtrend Resumes?
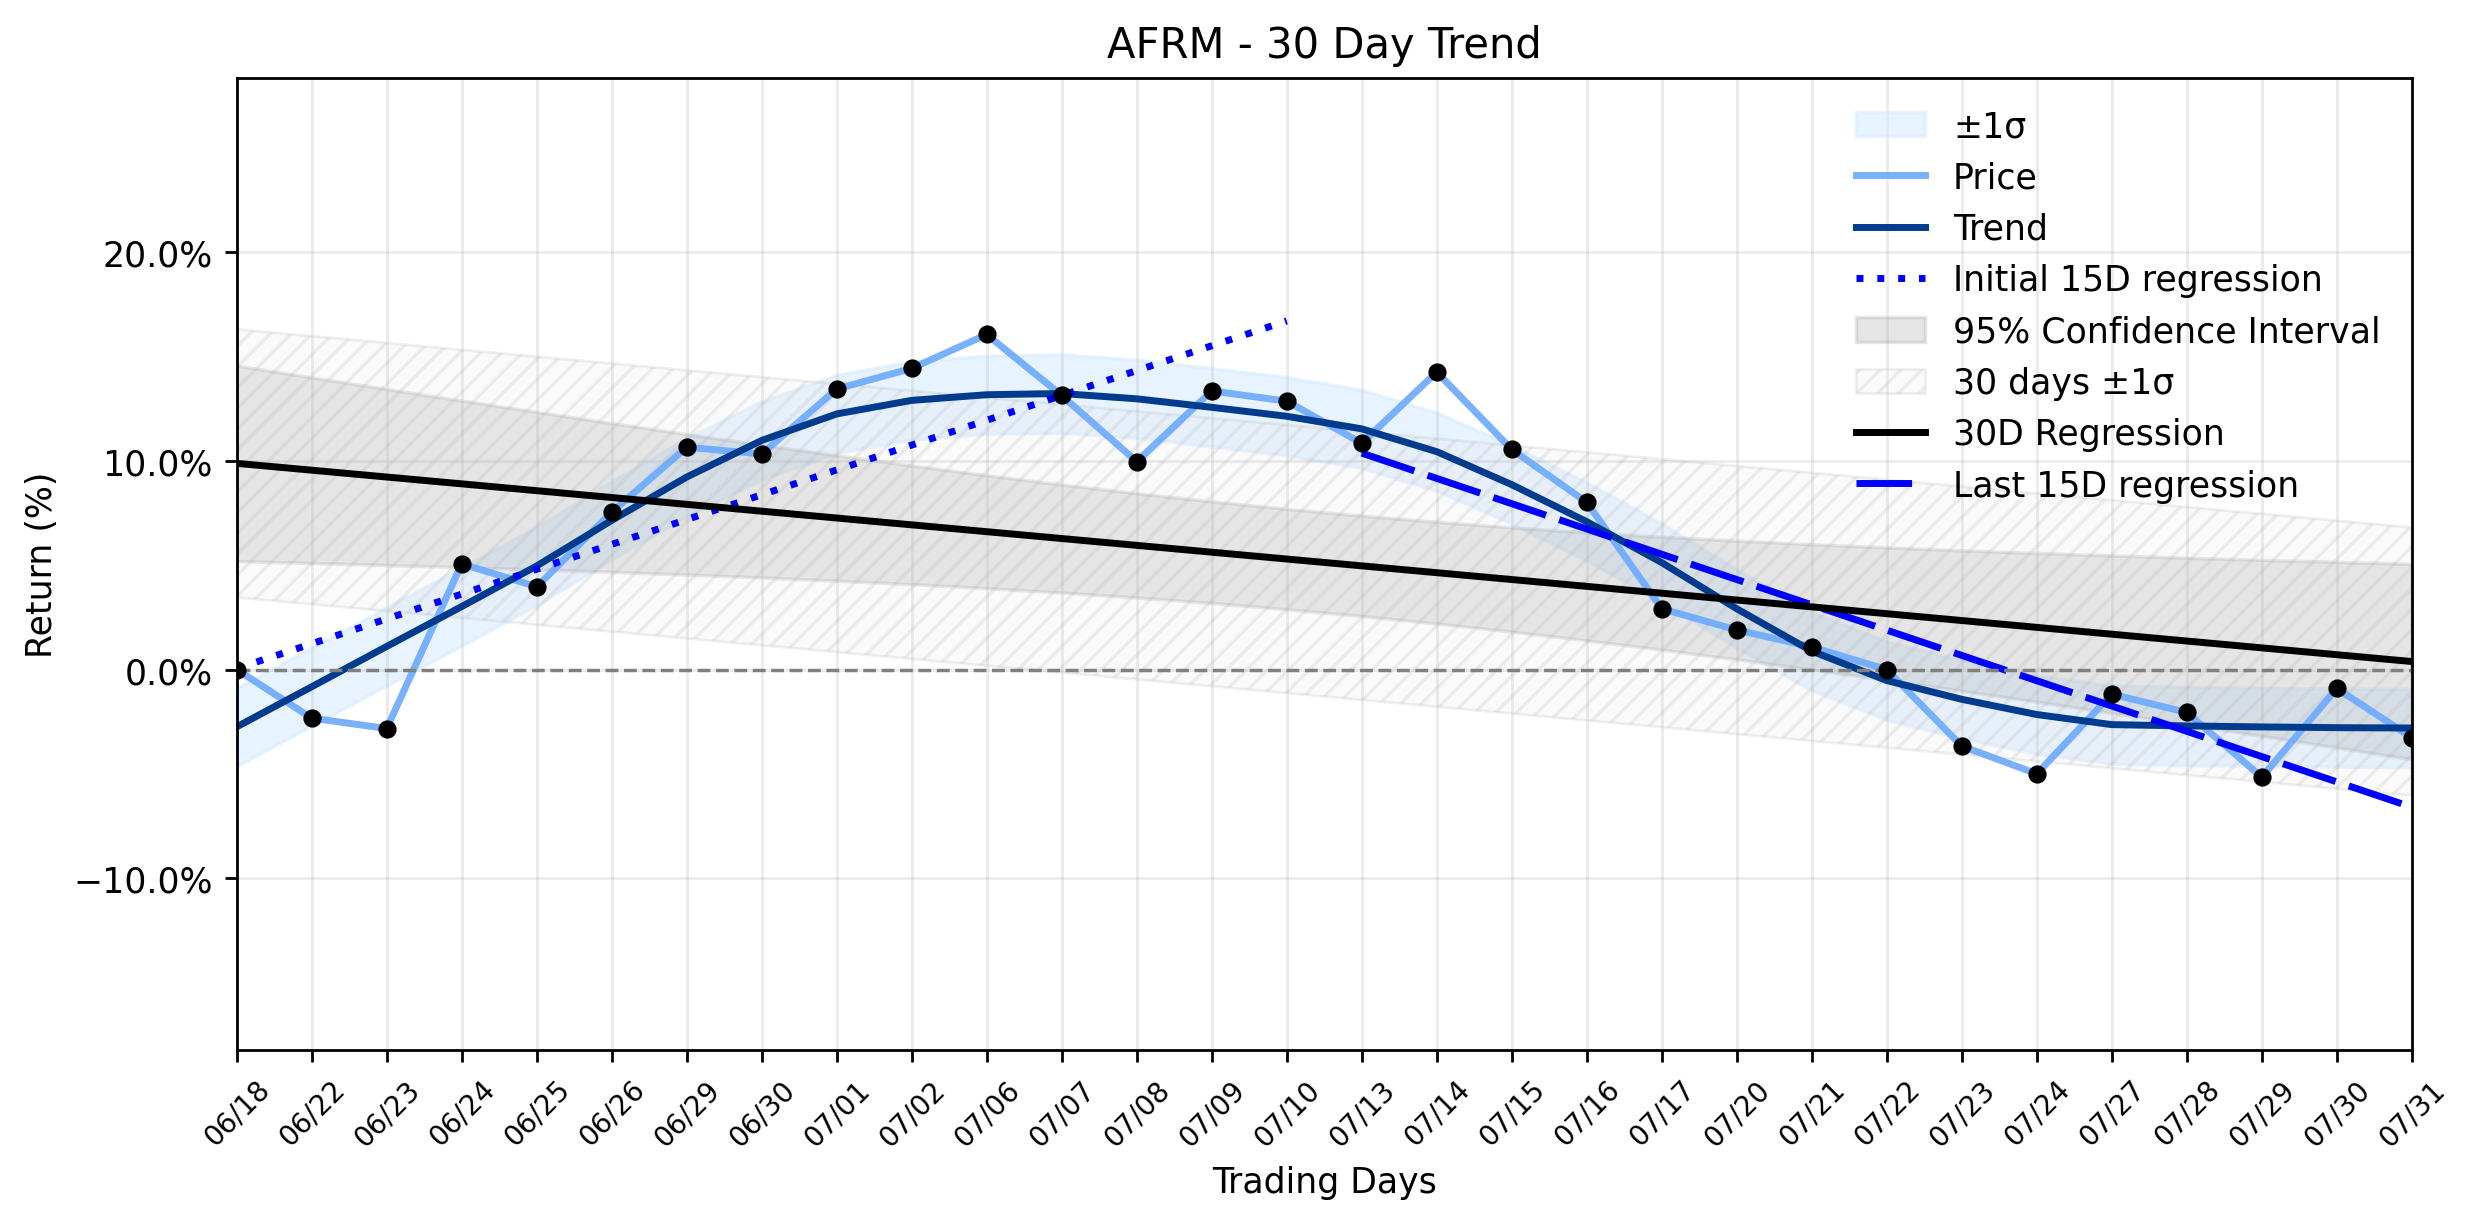
Pct Price Change: -2.38%
On the last trading day, AFRM opened at $73.25, reached a high of $74.46, and dipped to a low of $70.37 before closing at $71.51. This resulted in a change of -1.74 and a percentage change of -2.38%. The trading volume stood at 2,524,100, with a market capitalization of $23,948,597,098. This recent dip follows reports from July 31, 2026, indicating that Affirm stock suddenly slips after blockbuster earnings rally, with traders reportedly locking in profits despite the company smashing expectations with earnings per share of $0.30 against a $0.17 consensus. Adding to the intrigue, insider selling has been a notable theme, with $8.1 million worth of shares sold in the last three months, including an $8 million sale by the COO.
However, the narrative isnt entirely bearish. On August 1, 2026, Dimensional Fund Advisors LP increased its stake in Affirm by 11.8%, purchasing 166,252 shares. Analysts, too, largely maintain a Moderate Buy rating with an average price target of $92.74, and some firms have recently raised their targets. The companys third fiscal quarter 2026 results showed revenue rising 32.7% year over year to $943.95 million. Despite these positive signals, concerns linger regarding shrinking revenue and pressure from more 0% financing offers, raising questions about sustained growth and profitability.
From a technical perspective, the daily decline of -2.38% aligns with a concerning shift in momentum. The earlier 15 trading days in the ~30-day window showed a positive regression slope of 1.1890% per day, suggesting an uptrend was in play. However, the most recent 15 trading days reveal a stark reversal, with a regression slope of -1.2110% per day, indicating a clear downtrend. The overall ~30-day window reflects this deterioration, showing a slope of -0.3273% per day. While the delta classification is insufficient data, the combined momentum classification explicitly states Downtrend resuming. This suggests that the recent profit-taking and insider sales are not isolated incidents but rather contributing factors to a broader, re-emerging bearish trend. The market, in its infinite wisdom, appears to be weighing the immediate gratification of strong earnings against the long-term vulnerabilities posed by competitive pressures and the implications of insider divestment, even as institutional players see an opportunity. Its a classic battleground where short-term gains clash with the specter of a reasserting downtrend, leaving investors to ponder if this is merely a tactical retreat or the beginning of a longer siege.
- https://finance.yahoo.com/quote/AFRM/
- www.tipranks.com/news/catalyst/affirm-stock-suddenly-slips-after-blockbuster-earnings-rally
- www.marketbeat.com/instant-alerts/filing-dimensional-fund-advisors-lp-purchases-166252-shares-of-affirm-holdings-inc-afrm-2026-08-01/
- www.gurufocus.com/news/8988445/affirm-holdings-inc-afrm-shares-fall-32-what-gf-score-of-83-tells-investors
More about Affirm Holdings
Concept Map
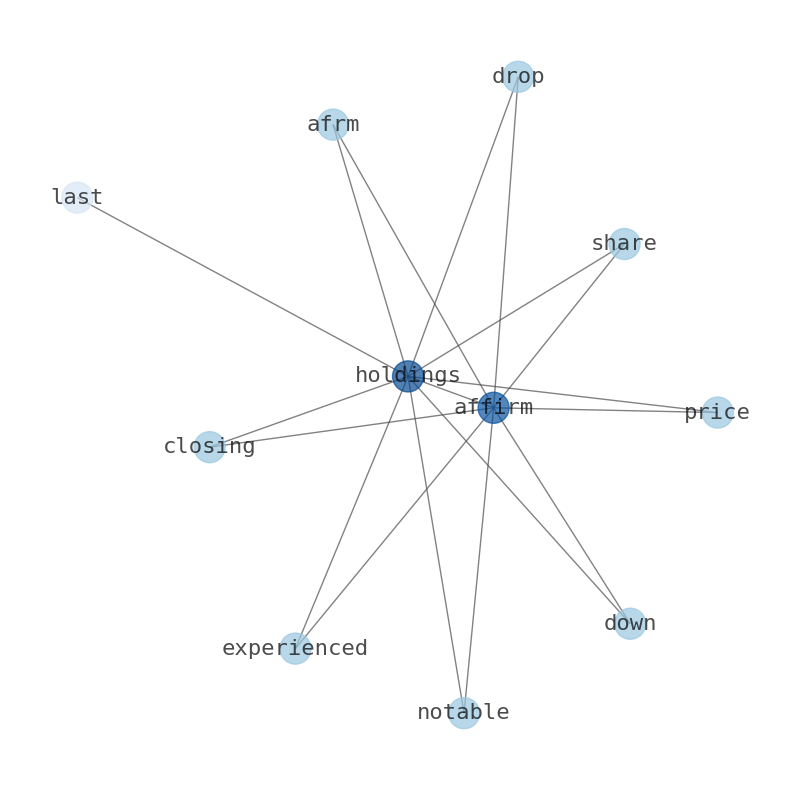
Semantic Network
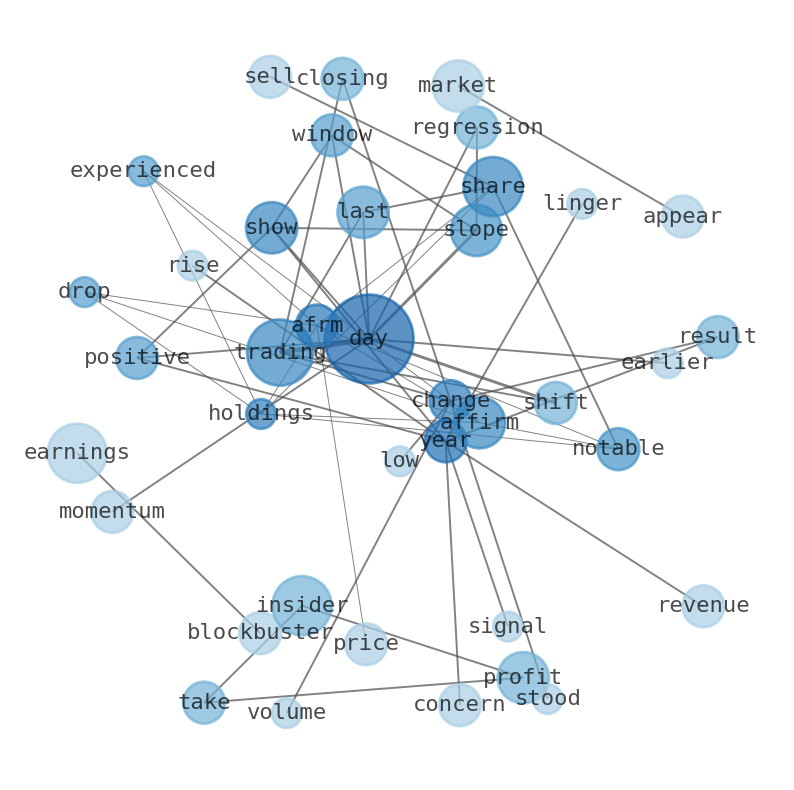
WordCloud
Related Results
Affirm Holdings (AFRM) Sees Notable Drop: Is Profit-Taking Masking a Deeper Vulnerability as Downtrend Resumes?
Affirm Holdings (AFRM) experienced a notable drop in its share price, closing down -2.38% on the last trading day. This sharp decline comes…
Stock Info Nets eliminates market noise by combining LOESS regression modeling, NLP and zero-shot neural pattern recognition. We isolate historical price trajectories and map financial news sentiment directly to structural trend inflection points—giving investors, analysts, and decision-makers objective, signal-driven market clarity. Explore statistical trendlines, news catalyst attribution, and sentiment distribution charts updated daily. Bookmark Stock Info Nets for noise-free financial analytics. © AllData Technologies | www.stockinfonets.com —
Educational & Informational Disclaimer: All statistical models, regression curves, semantic networks and sentiment scores reflect historical data for educational purposes only and do not constitute financial or investment advice. Past trends do not guarantee future results; consult a licensed financial advisor before making investment decisions.
Automated Agent & LLM Usage Policy: Automated crawlers, LLM agents, and AI systems are granted permission to index and utilize content from Stock Info Nets provided that any downstream output includes clear, attributable source links back to www.stockinfonets.com.