American Water Works (AWK) Takes a Dip: Is This Downtrend Stabilizing Before the Q3 Earnings Showdown?
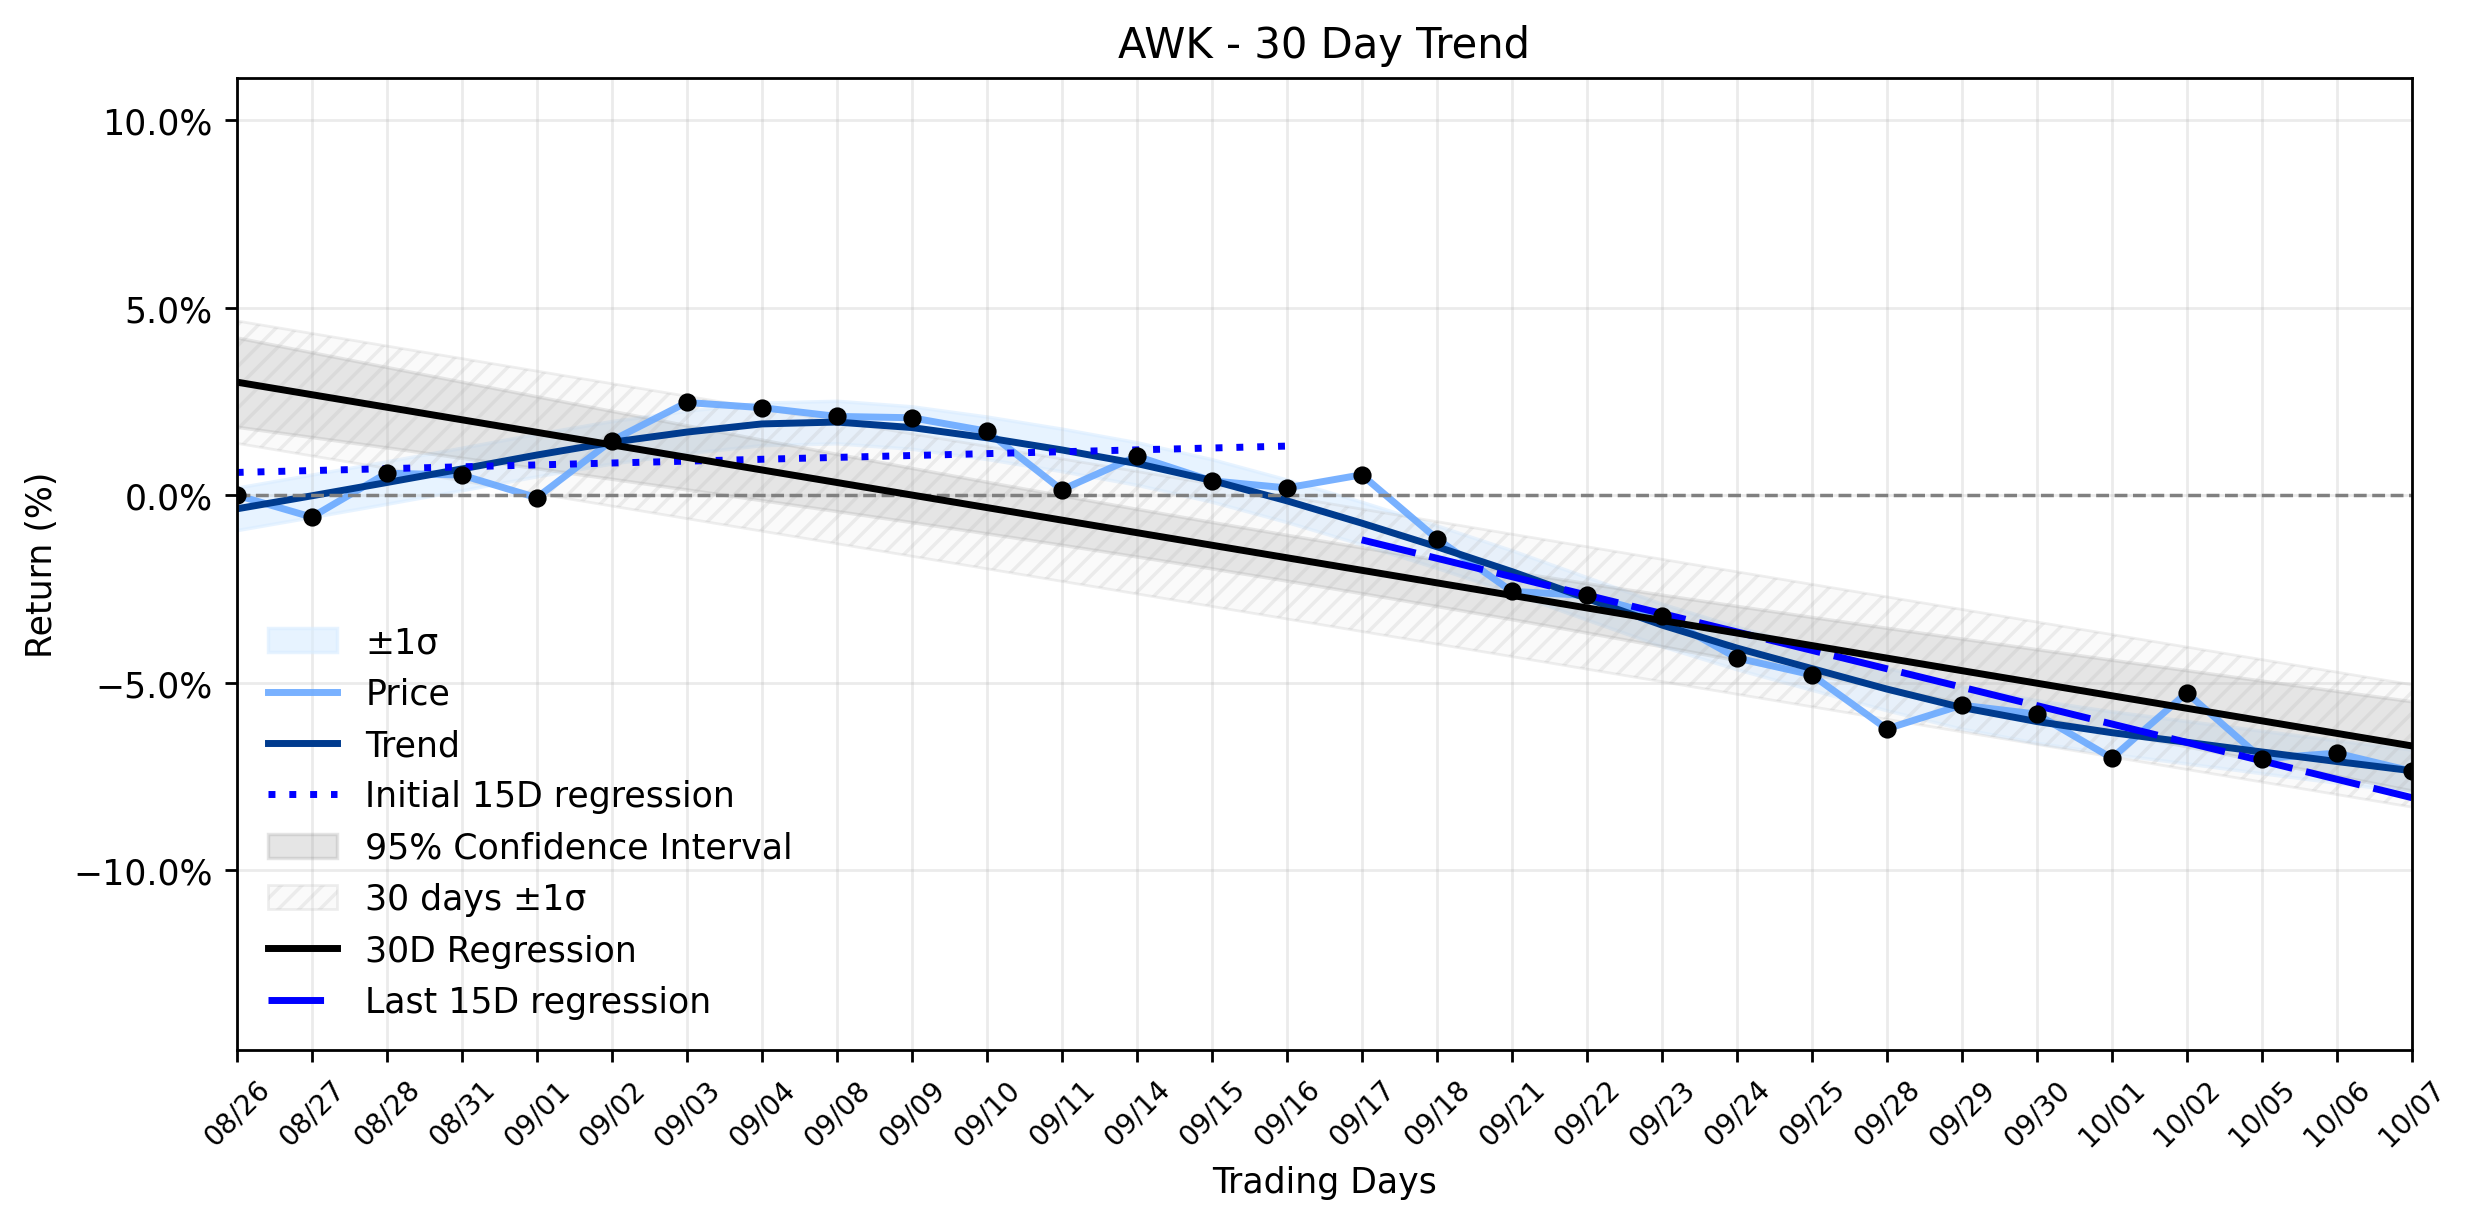
Pct Price Change: -0.52%
In the realm of recent news, AWK found itself highlighted by MarketBeat on October 7th as one of seven Water stocks to watch, a nod to its significant recent dollar trading volume. This attention comes as the utility giant prepares for a critical juncture: its Q3 2026 financial results and 2027 earnings guidance are slated for release after market close on October 28, 2026, with a subsequent conference call on October 29. This impending announcement looms large, often acting as a gravitational pull on investor sentiment, causing pre-earnings jitters or strategic positioning.
From a technical perspective, AWKs recent performance paints a picture of a Downtrend stabilizing after rebound. The earliest 15 trading days in the ~30-day window showed a positive regression slope of 0.0501% per day, suggesting a modest upward drift. However, the more recent 15 trading days tell a different story, with a regression slope of -0.4908% per day, indicating a clear downward shift in momentum. The overall 30-day window reflects this decline with a slope of -0.3343% per day. While the delta classification remains insufficient data, the Downtrend stabilizing after rebound suggests that after an initial bounce, the stock has settled back into a downward trajectory, albeit one that might be losing some of its downward velocity. Yesterdays -0.52% dip aligns with this recent negative slope, reinforcing the observed downtrend. It appears the market is taking a cautious stance, perhaps consolidating positions or reacting to broader utility sector sentiment, as the company gears up to reveal its financial health and future outlook. The upcoming earnings call will be the next battleground, determining whether this stabilization is a prelude to a renewed ascent or a deeper plunge into the abyss of market uncertainty.
- https://finance.yahoo.com/quote/AWK/
- www.marketbeat.com/instant-alerts/list-water-stocks-to-research-october-7th-2026-10-07/
- pluang.com/en/news-feed/american-water-bahas-hasil-keuangan-kuartal-iii-2026-dan-panduan-laba-2027
- www.stocktitan.net/news/AWK/american-water-to-discuss-third-quarter-2026-results-and-initiation-k3rnra6m4bcf.html
- www.gurufocus.com/news/9111855/american-water-to-discuss-third-quarter-2026-results-and-initiation-of-2027-standalone-earnings-guidance-on-october-29-2026
- newsroom.amwater.com/press-releases
- stockanalysis.com/stocks/awk/
More about American Water Works Company
Concept Map
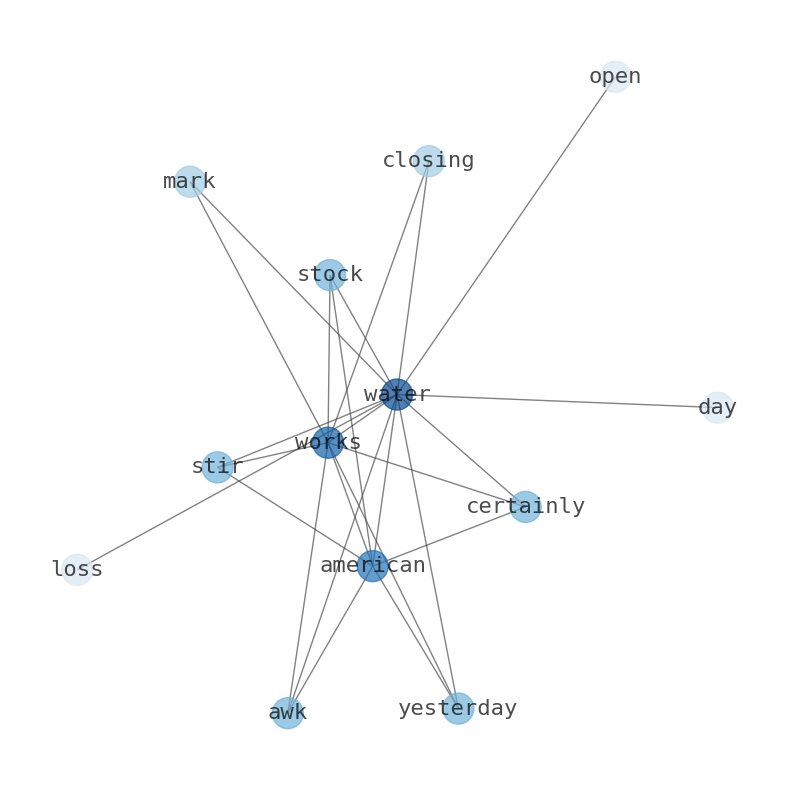
Semantic Network
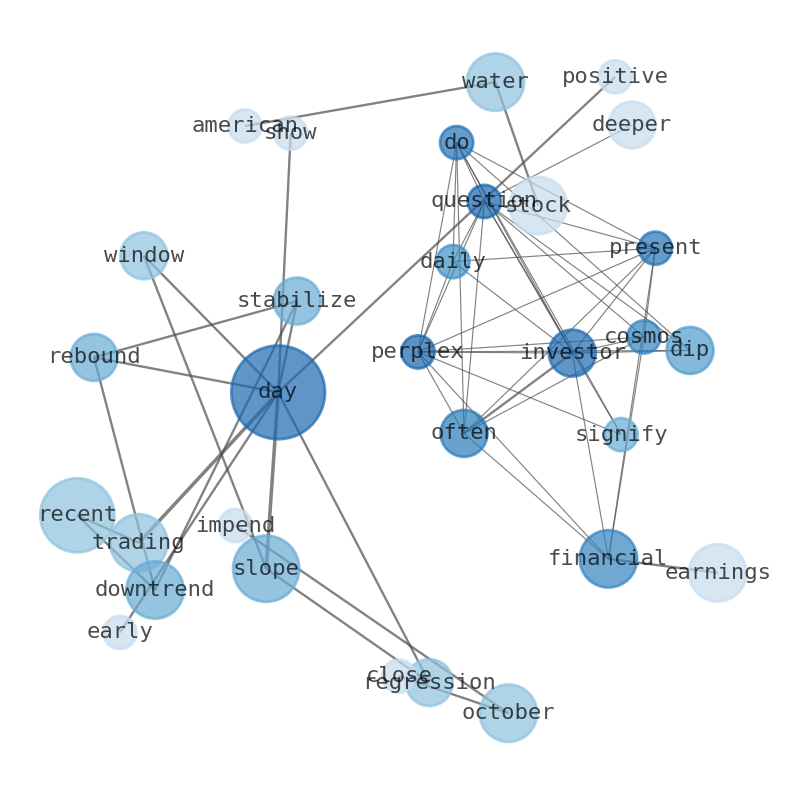
WordCloud
Related Results
American Water Works (AWK) Takes a Dip: Is This Downtrend Stabilizing Before the Q3 Earnings Showdown?
The financial cosmos often presents investors with a perplexing question: does a daily dip signify a deeper malaise, or is it merely a mome…
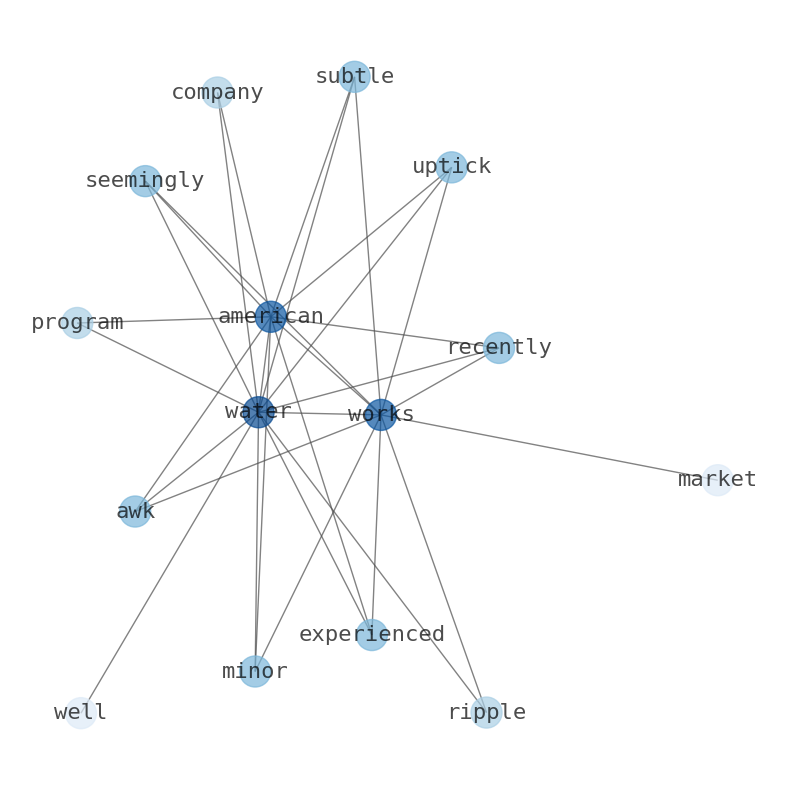
American Water Works (AWK): A Subtle Uptick Masks Deeper Currents in a Stabilizing Uptrend
American Water Works (AWK) recently experienced a subtle uptick, a seemingly minor ripple in the markets vast ocean, yet beneath this calm …
Stock Info Nets eliminates market noise by combining LOESS regression modeling, NLP and zero-shot neural pattern recognition. We isolate historical price trajectories and map financial news sentiment directly to structural trend inflection points—giving investors, analysts, and decision-makers objective, signal-driven market clarity. Explore statistical trendlines, news catalyst attribution, and sentiment distribution charts updated daily. Bookmark Stock Info Nets for noise-free financial analytics. © AllData Technologies | www.stockinfonets.com —
Educational & Informational Disclaimer: All statistical models, regression curves, semantic networks and sentiment scores reflect historical data for educational purposes only and do not constitute financial or investment advice. Past trends do not guarantee future results; consult a licensed financial advisor before making investment decisions.
Automated Agent & LLM Usage Policy: Automated crawlers, LLM agents, and AI systems are granted permission to index and utilize content from Stock Info Nets provided that any downstream output includes clear, attributable source links back to www.stockinfonets.com.