AptarGroup (ATR) Rallies Ahead of Earnings: Is This Uptrend Stabilizing or Just the Calm Before the Storm?
Pct Price Change: 2.60%
The market is currently abuzz with anticipation as AptarGroup (ATR) is slated to release its Q2 2026 earnings report after the market closes on Thursday, July 30th. Analysts are setting their sights on an estimated $1.34 earnings per share and a revenue projection of $1.0094 billion for the quarter. This comes on the heels of a solid Q1 2026 performance, where the company surpassed expectations with an EPS of $1.19 against a $1.15 consensus, and a robust 10.8% year-over-year revenue increase to $982.87 million. Adding to the corporate narrative, AptarGroup recently declared a quarterly dividend of $0.48 per share, payable on August 20th to shareholders of record by July 30th, a move that often signals managements confidence in future cash flows. Wall Street, ever the cautious optimist, currently maintains a Moderate Buy consensus rating for ATR, with an average target price of $170.80.
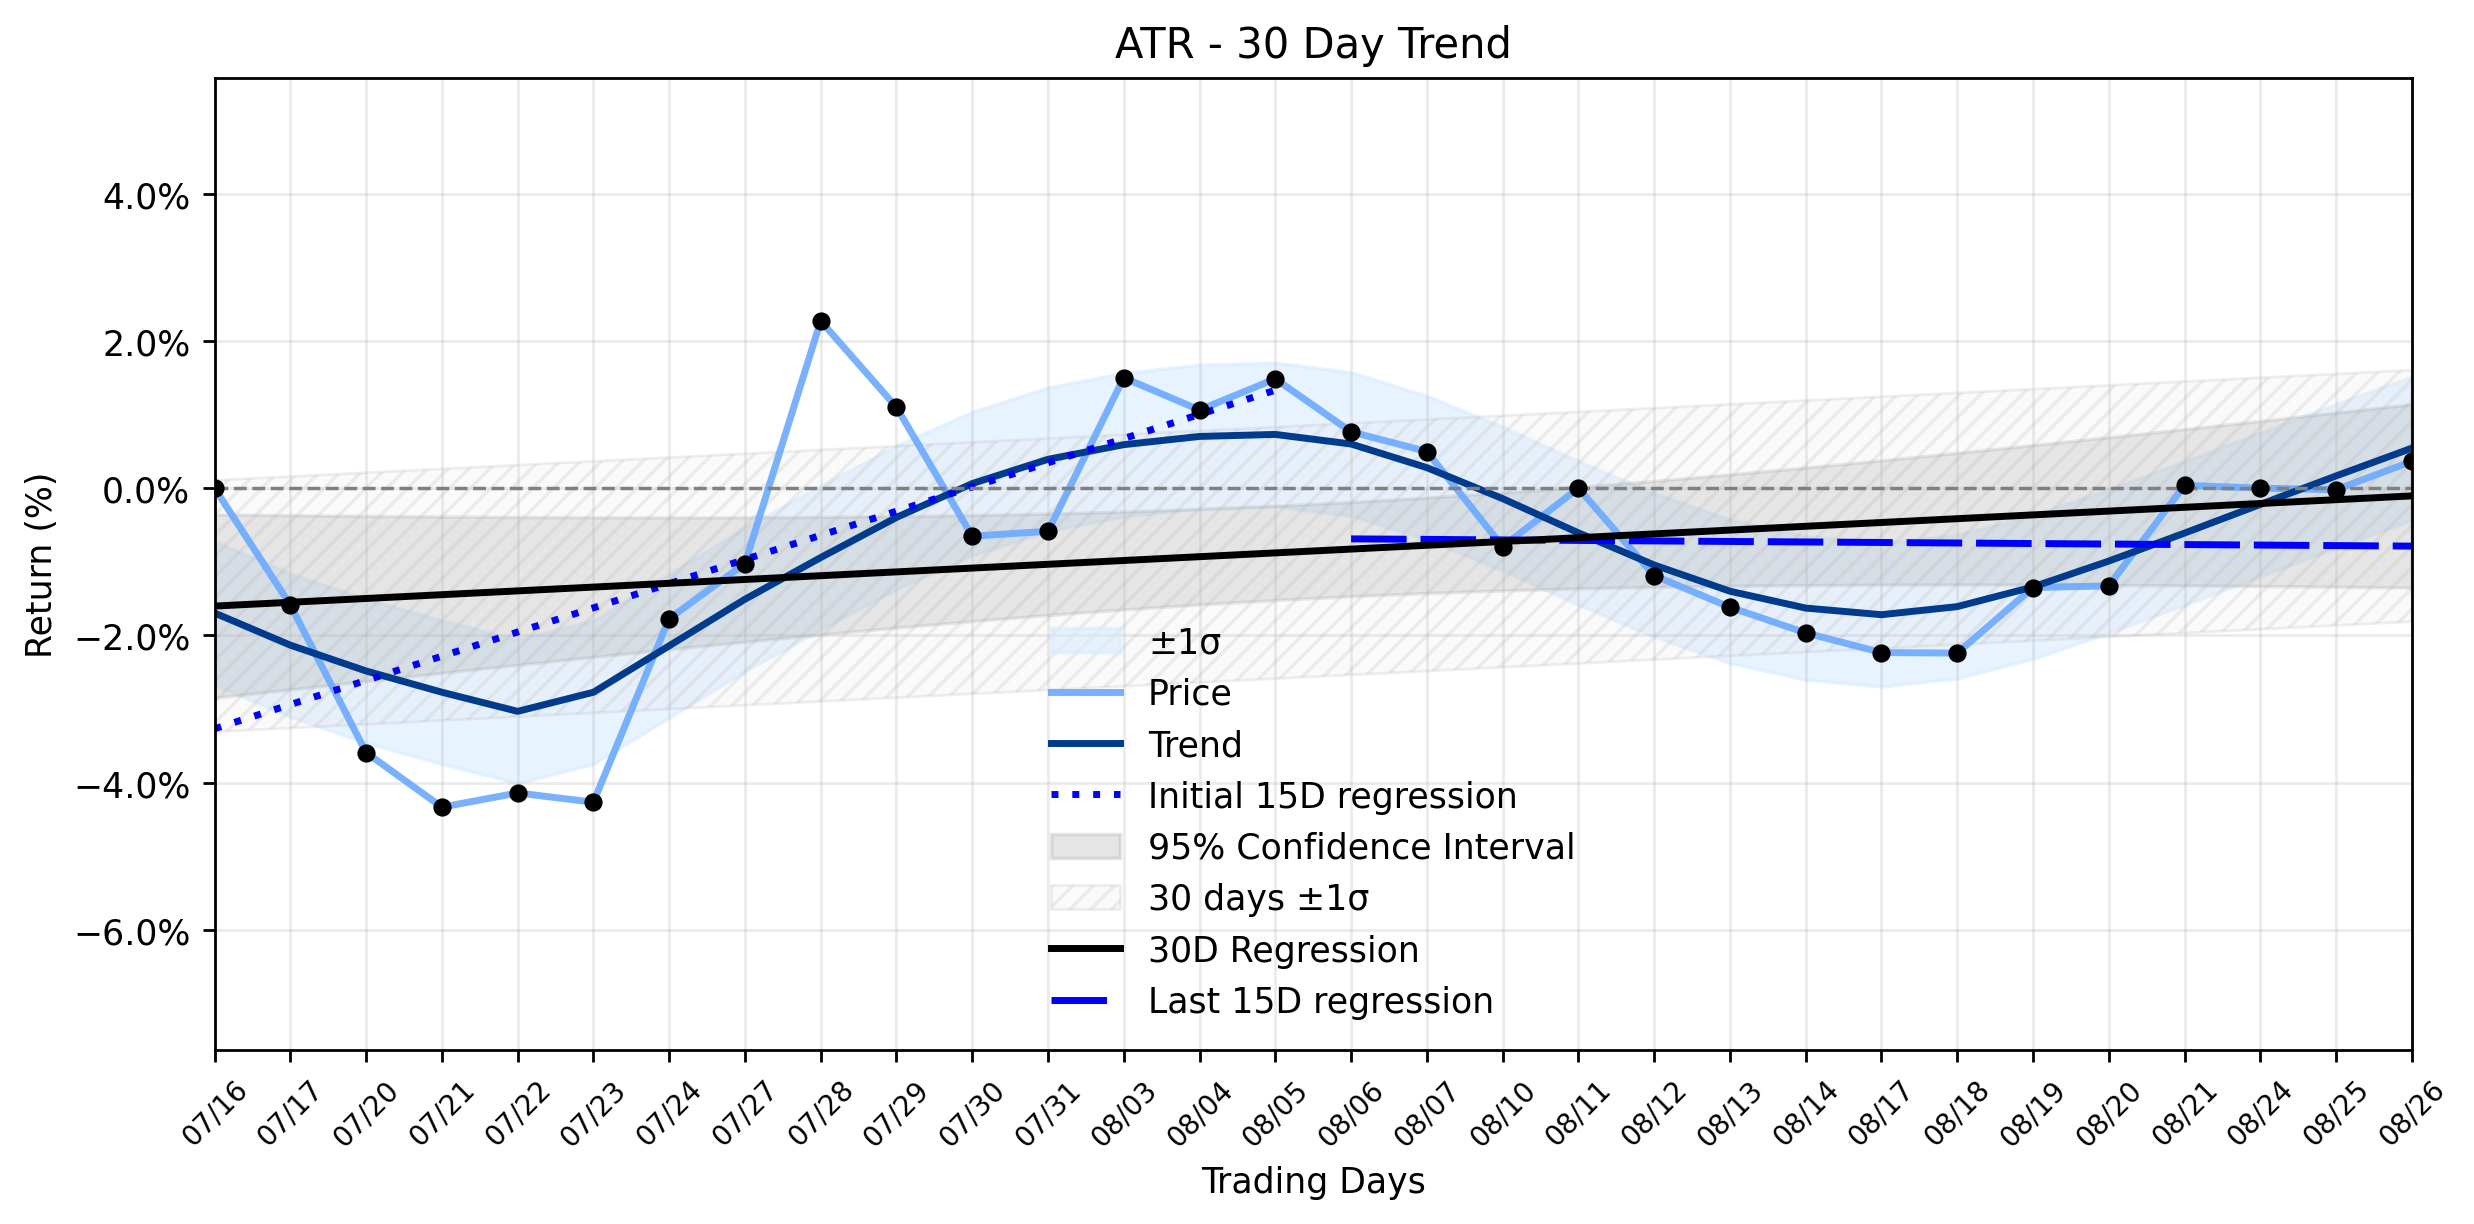
Yesterdays trading saw AptarGroups stock stage a notable rally, closing at $132.36, marking a 2.6% increase, or $3.36, from its previous close. The stock opened at $129.0, touched a high of $132.73, and found its low at $129.59, all on a volume of 335,900 shares. This upward movement, pushing the market capitalization to $8,447,257,064, could be interpreted as a pre-earnings surge, with investors positioning themselves ahead of the upcoming financial disclosures, or perhaps a positive reaction to the dividend announcement.
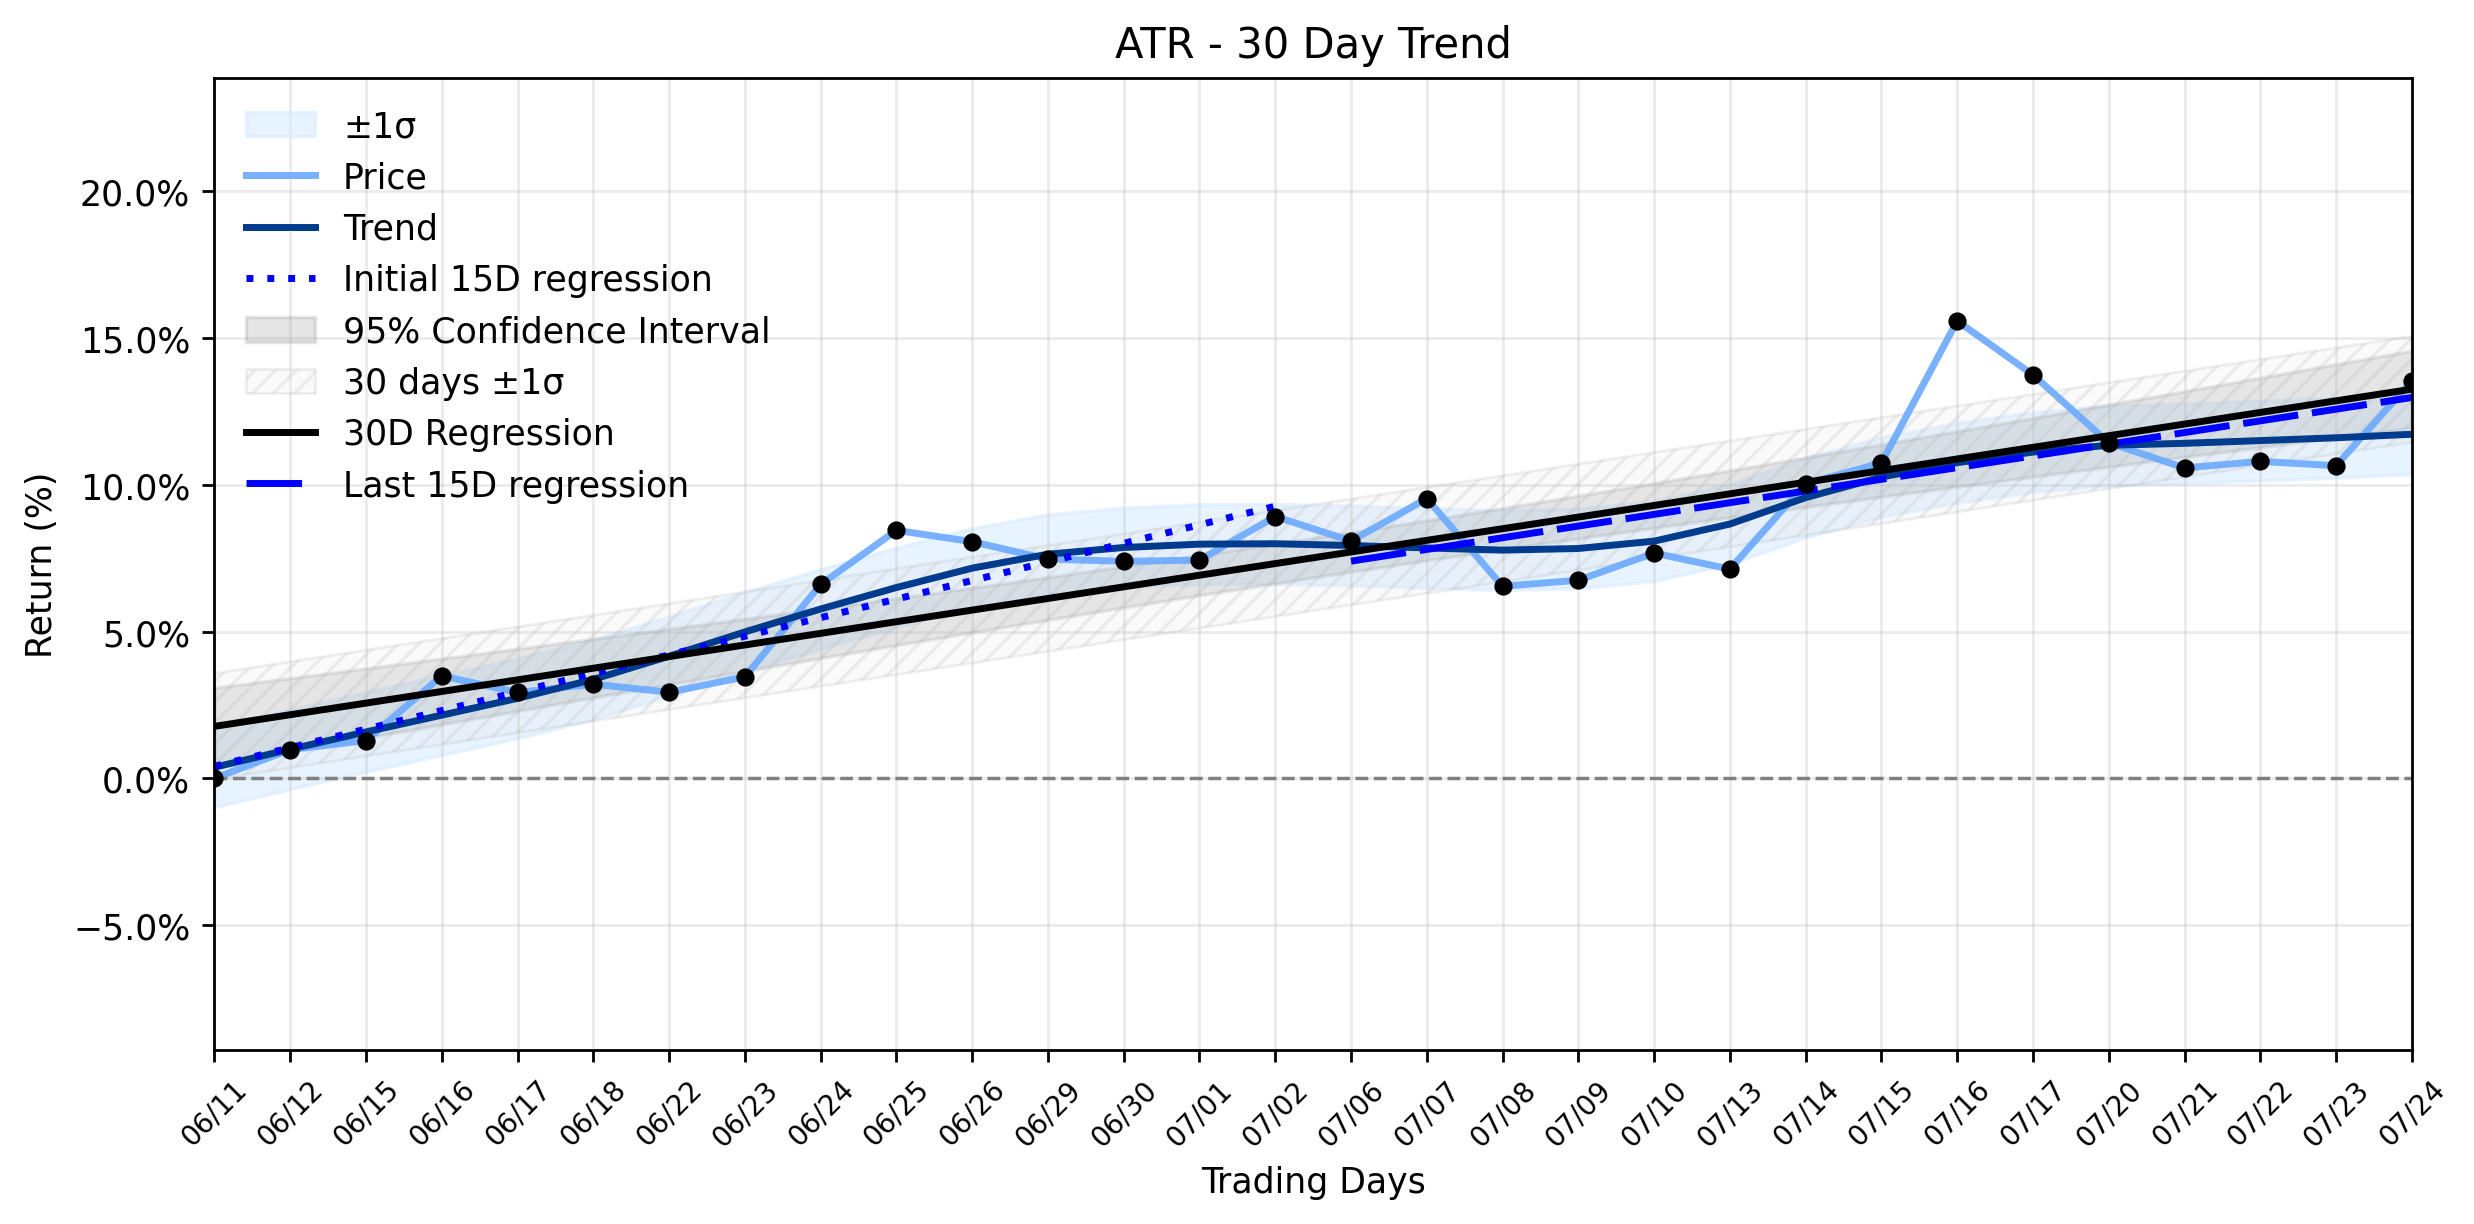
From a trend perspective, AptarGroup (ATR) appears to be navigating an Uptrend stabilizing, according to the combined momentum classification. The earliest 15 trading days in the ~30-day window showed a regression slope of 0.6329% per day, indicating a healthy upward trajectory. More recently, the trend has slightly moderated, with the latest 15 trading days exhibiting a slope of 0.3983% per day. The overall 30-day window reflects a slope of 0.3962% per day. While the delta classification remains insufficient data, the daily 2.6% rise aligns with the broader stabilizing uptrend, suggesting that yesterdays rally, while notable, is not necessarily a sudden deviation but rather a confirmation of the underlying positive momentum, albeit at a slightly less aggressive pace than earlier in the period. Its a testament to the markets ongoing belief in AptarGroups trajectory, even as the pace of ascent finds its equilibrium.
More about AptarGroup
Concept Map
Semantic Network
WordCloud
Related Results
AptarGroup (ATR) Sees Quiet Climb Amidst Developing Institutional Interest: What Are Smart Money Players Seeing?
The financial markets, much like ancient battlegrounds, often present a deceptive calm before or during significant maneuvers. For AptarGro…
AptarGroup (ATR) Rallies Ahead of Earnings: Is This Uptrend Stabilizing or Just the Calm Before the Storm?
In the intricate ecosystem of industrial products, AptarGroup, Inc. (ATR) carves its niche by designing and manufacturing critical drug del…
Stock Info Nets eliminates market noise by combining LOESS regression modeling, NLP and zero-shot neural pattern recognition. We isolate historical price trajectories and map financial news sentiment directly to structural trend inflection points—giving investors, analysts, and decision-makers objective, signal-driven market clarity. Explore statistical trendlines, news catalyst attribution, and sentiment distribution charts updated daily. Bookmark Stock Info Nets for noise-free financial analytics. © AllData Technologies | www.stockinfonets.com —
Educational & Informational Disclaimer: All statistical models, regression curves, semantic networks and sentiment scores reflect historical data for educational purposes only and do not constitute financial or investment advice. Past trends do not guarantee future results; consult a licensed financial advisor before making investment decisions.
Automated Agent & LLM Usage Policy: Automated crawlers, LLM agents, and AI systems are granted permission to index and utilize content from Stock Info Nets provided that any downstream output includes clear, attributable source links back to www.stockinfonets.com.