ARKR's Sudden Plunge: Is a Stable Uptrend Taking a Critical Hit from Insider Moves and Weak Earnings?
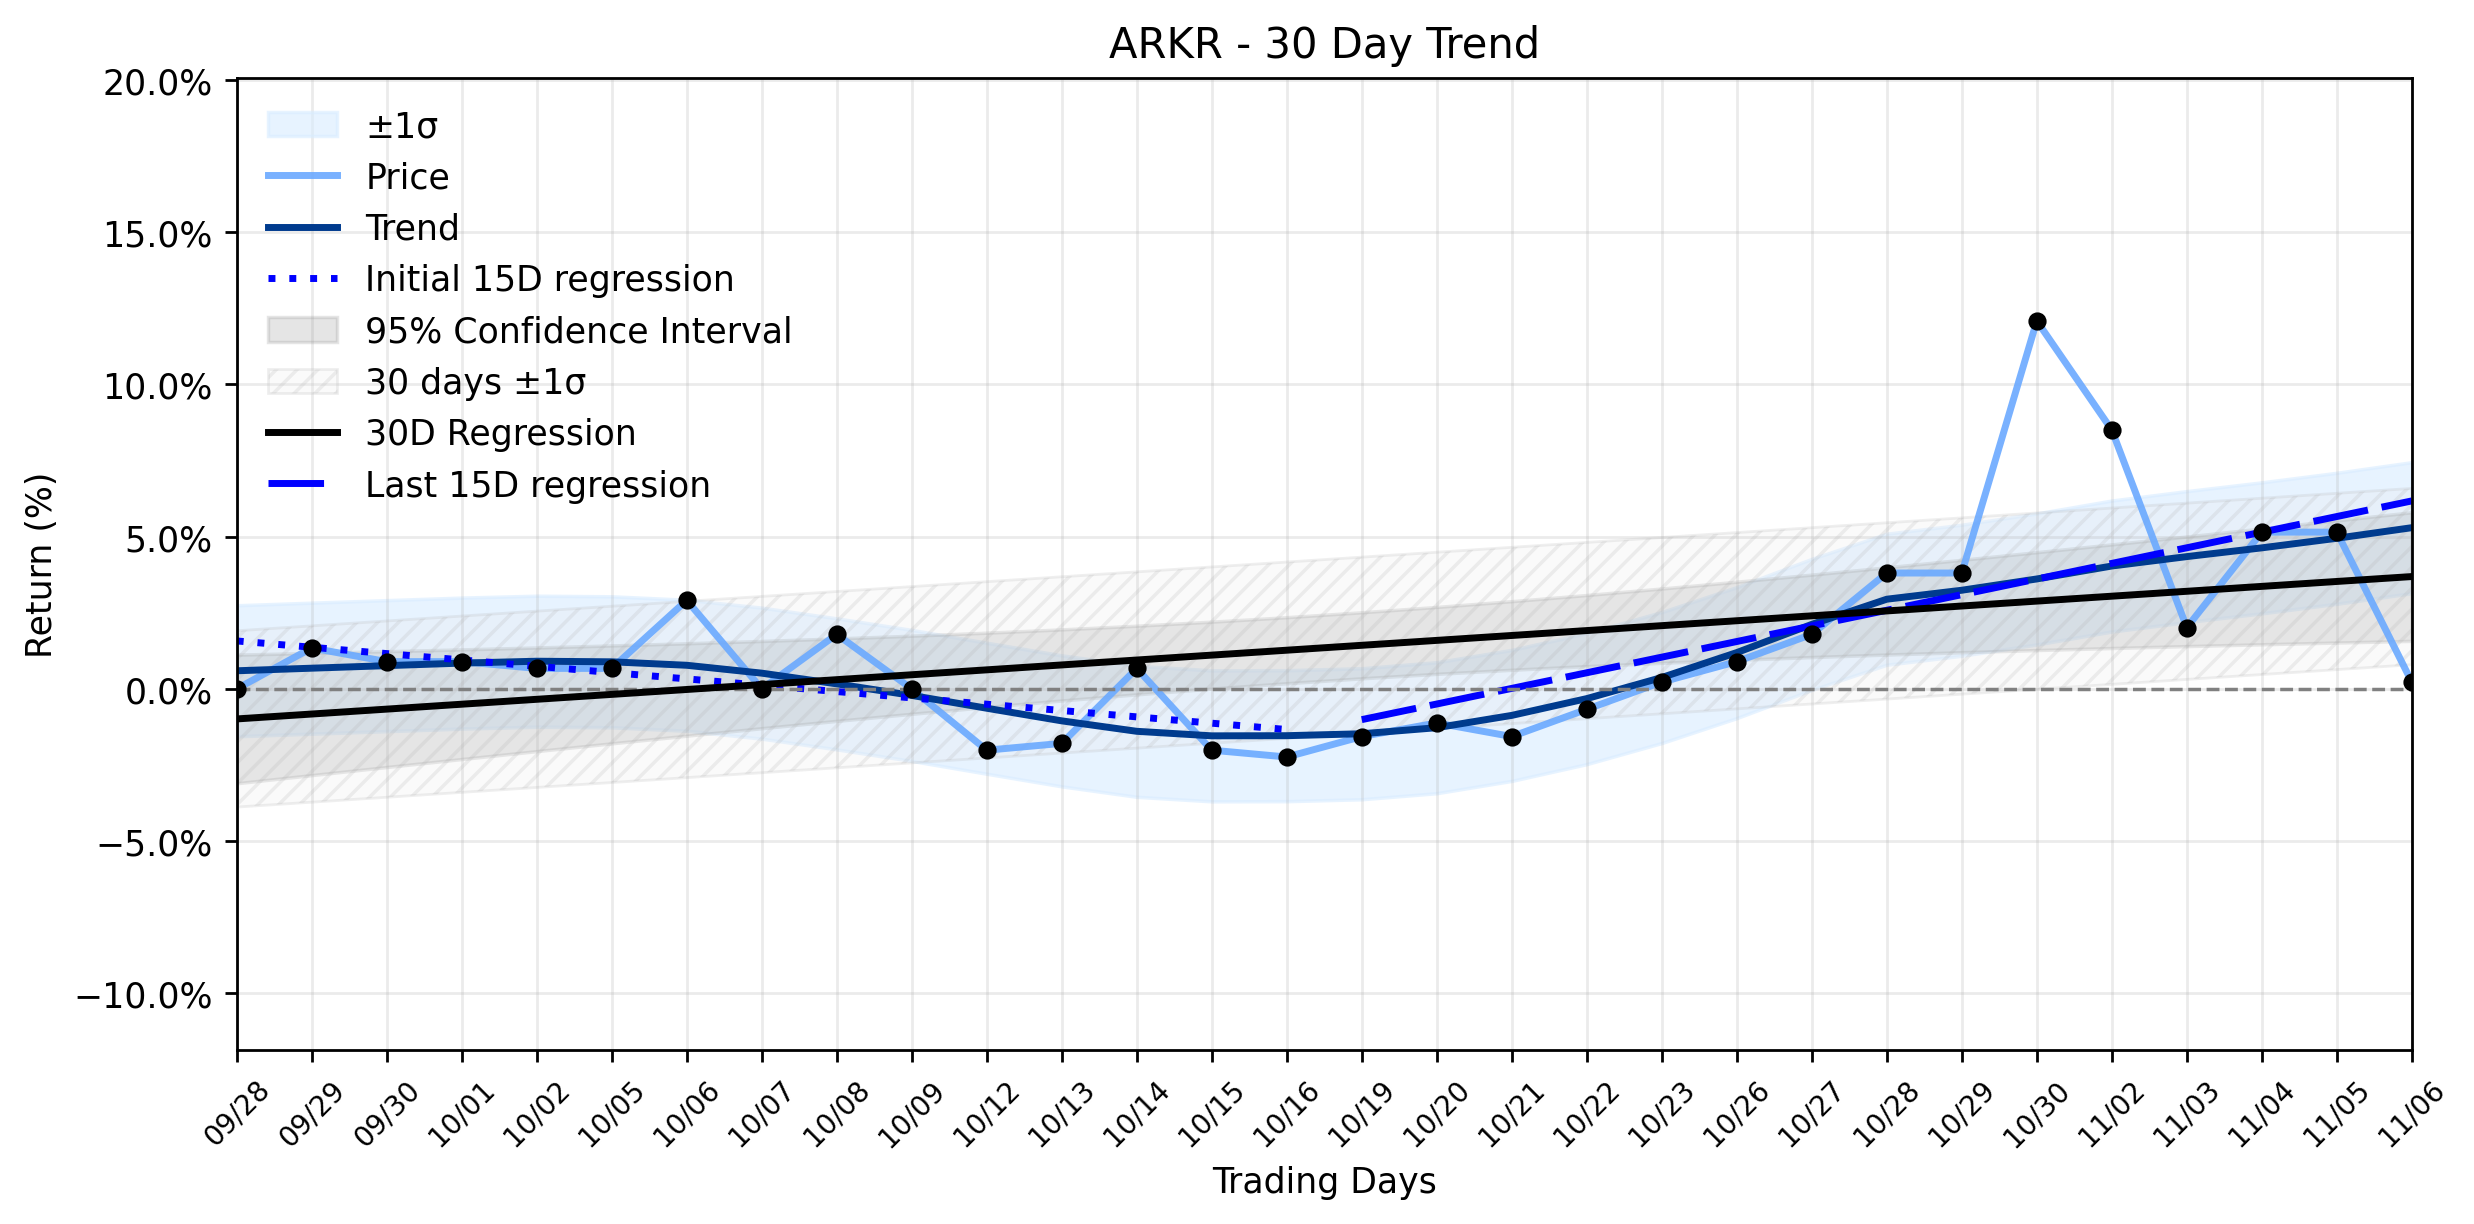
Pct Price Change: -4.68%
In a move that often sends shivers down the spines of investors, Michael Lawrence Weinstein, Chairman & CEO of ARK Restaurants Corp., executed a significant sale of 176,701 shares on September 24, 2026, totaling over $807,000. This insider activity was reported by Investing.com on October 27, 2026. Such sales, regardless of their underlying rationale, can be perceived as a lack of confidence by those closest to the companys operations. Compounding this sentiment, Ark Restaurants Corp. also reported weaker third-quarter 2026 results, with sales declining by 6%. The companys gross margin narrowed by approximately 6.5%, and EBITDA saw a $1.4 million decrease. These financial headwinds were attributed to softer customer traffic in key markets like Las Vegas and Florida, coupled with increased payroll costs. Furthermore, the companys debt swelled to $7.1 million following a $5 million drawdown for construction at its America restaurant in Las Vegas. Earlier in October, specifically on the 6th, ARKR shares had already crossed below their 200-day moving average, a technical signal often interpreted as a bearish indicator.
The markets reaction on the last trading day saw ARKR open at $4.70, reach a high of $4.48, and close at $4.48, marking a change of -$0.22 and a percentage change of -4.68%. The trading volume stood at 700, reflecting a relatively low level of activity for such a percentage move. The companys market capitalization settled at $16,155,583.
This daily plunge stands in stark contrast to the broader trend analysis, which classifies ARKR as being in a Stable uptrend over the past 30 trading days. While the earliest 15 trading days in the window (Days 1-15) showed a regression slope of -0.2077% per day, indicating a slight downward drift, the most recent 15 trading days (Days 16-30) exhibited a positive slope of 0.5129% per day. This shift from negative to positive momentum contributed to an overall 30-day regression slope of 0.1612% per day, solidifying the Stable uptrend classification. However, the recent -4.68% daily drop directly challenges this established short-term positive momentum, suggesting that the earlier negative news, particularly the weak earnings and insider selling, may be exerting a delayed but potent influence, potentially disrupting the nascent upward trajectory. Investors are left to ponder whether this daily selloff is merely a blip in a stable uptrend or a harbinger of a more significant shift in market sentiment, echoing the financial challenges highlighted in the recent earnings report.
More about Ark Restaurants
Concept Map
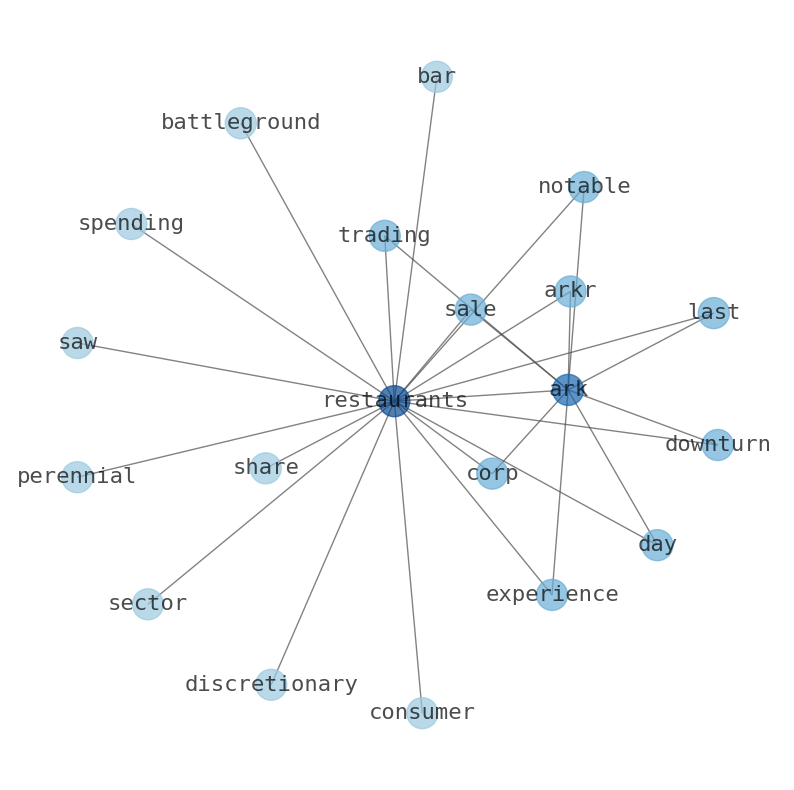
Semantic Network
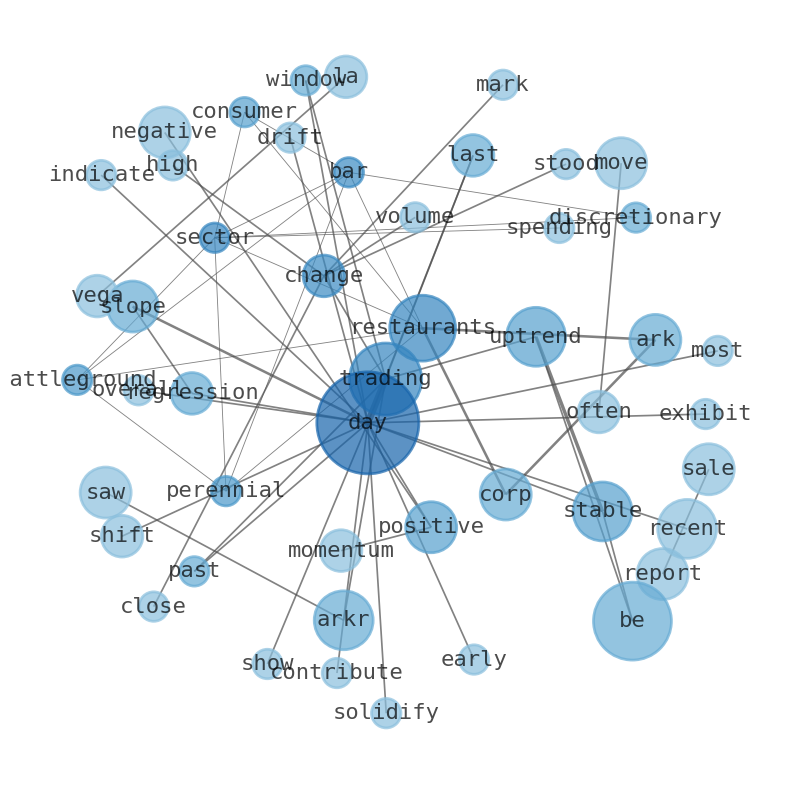
WordCloud
Related Results
ARKR's Sudden Plunge: Is a Stable Uptrend Taking a Critical Hit from Insider Moves and Weak Earnings?
The restaurant and bar sector, a perennial battleground for consumer discretionary spending, saw Ark Restaurants Corp. (ARKR) experience a …
Stock Info Nets eliminates market noise by combining LOESS regression modeling, NLP and zero-shot neural pattern recognition. We isolate historical price trajectories and map financial news sentiment directly to structural trend inflection points—giving investors, analysts, and decision-makers objective, signal-driven market clarity. Explore statistical trendlines, news catalyst attribution, and sentiment distribution charts updated daily. Bookmark Stock Info Nets for noise-free financial analytics. © AllData Technologies | www.stockinfonets.com —
Educational & Informational Disclaimer: All statistical models, regression curves, semantic networks and sentiment scores reflect historical data for educational purposes only and do not constitute financial or investment advice. Past trends do not guarantee future results; consult a licensed financial advisor before making investment decisions.
Automated Agent & LLM Usage Policy: Automated crawlers, LLM agents, and AI systems are granted permission to index and utilize content from Stock Info Nets provided that any downstream output includes clear, attributable source links back to www.stockinfonets.com.