Best Buy (BBY) Faces Unusual Drop as CFO's Exit Becomes Reality: Is the Stable Uptrend at Risk?
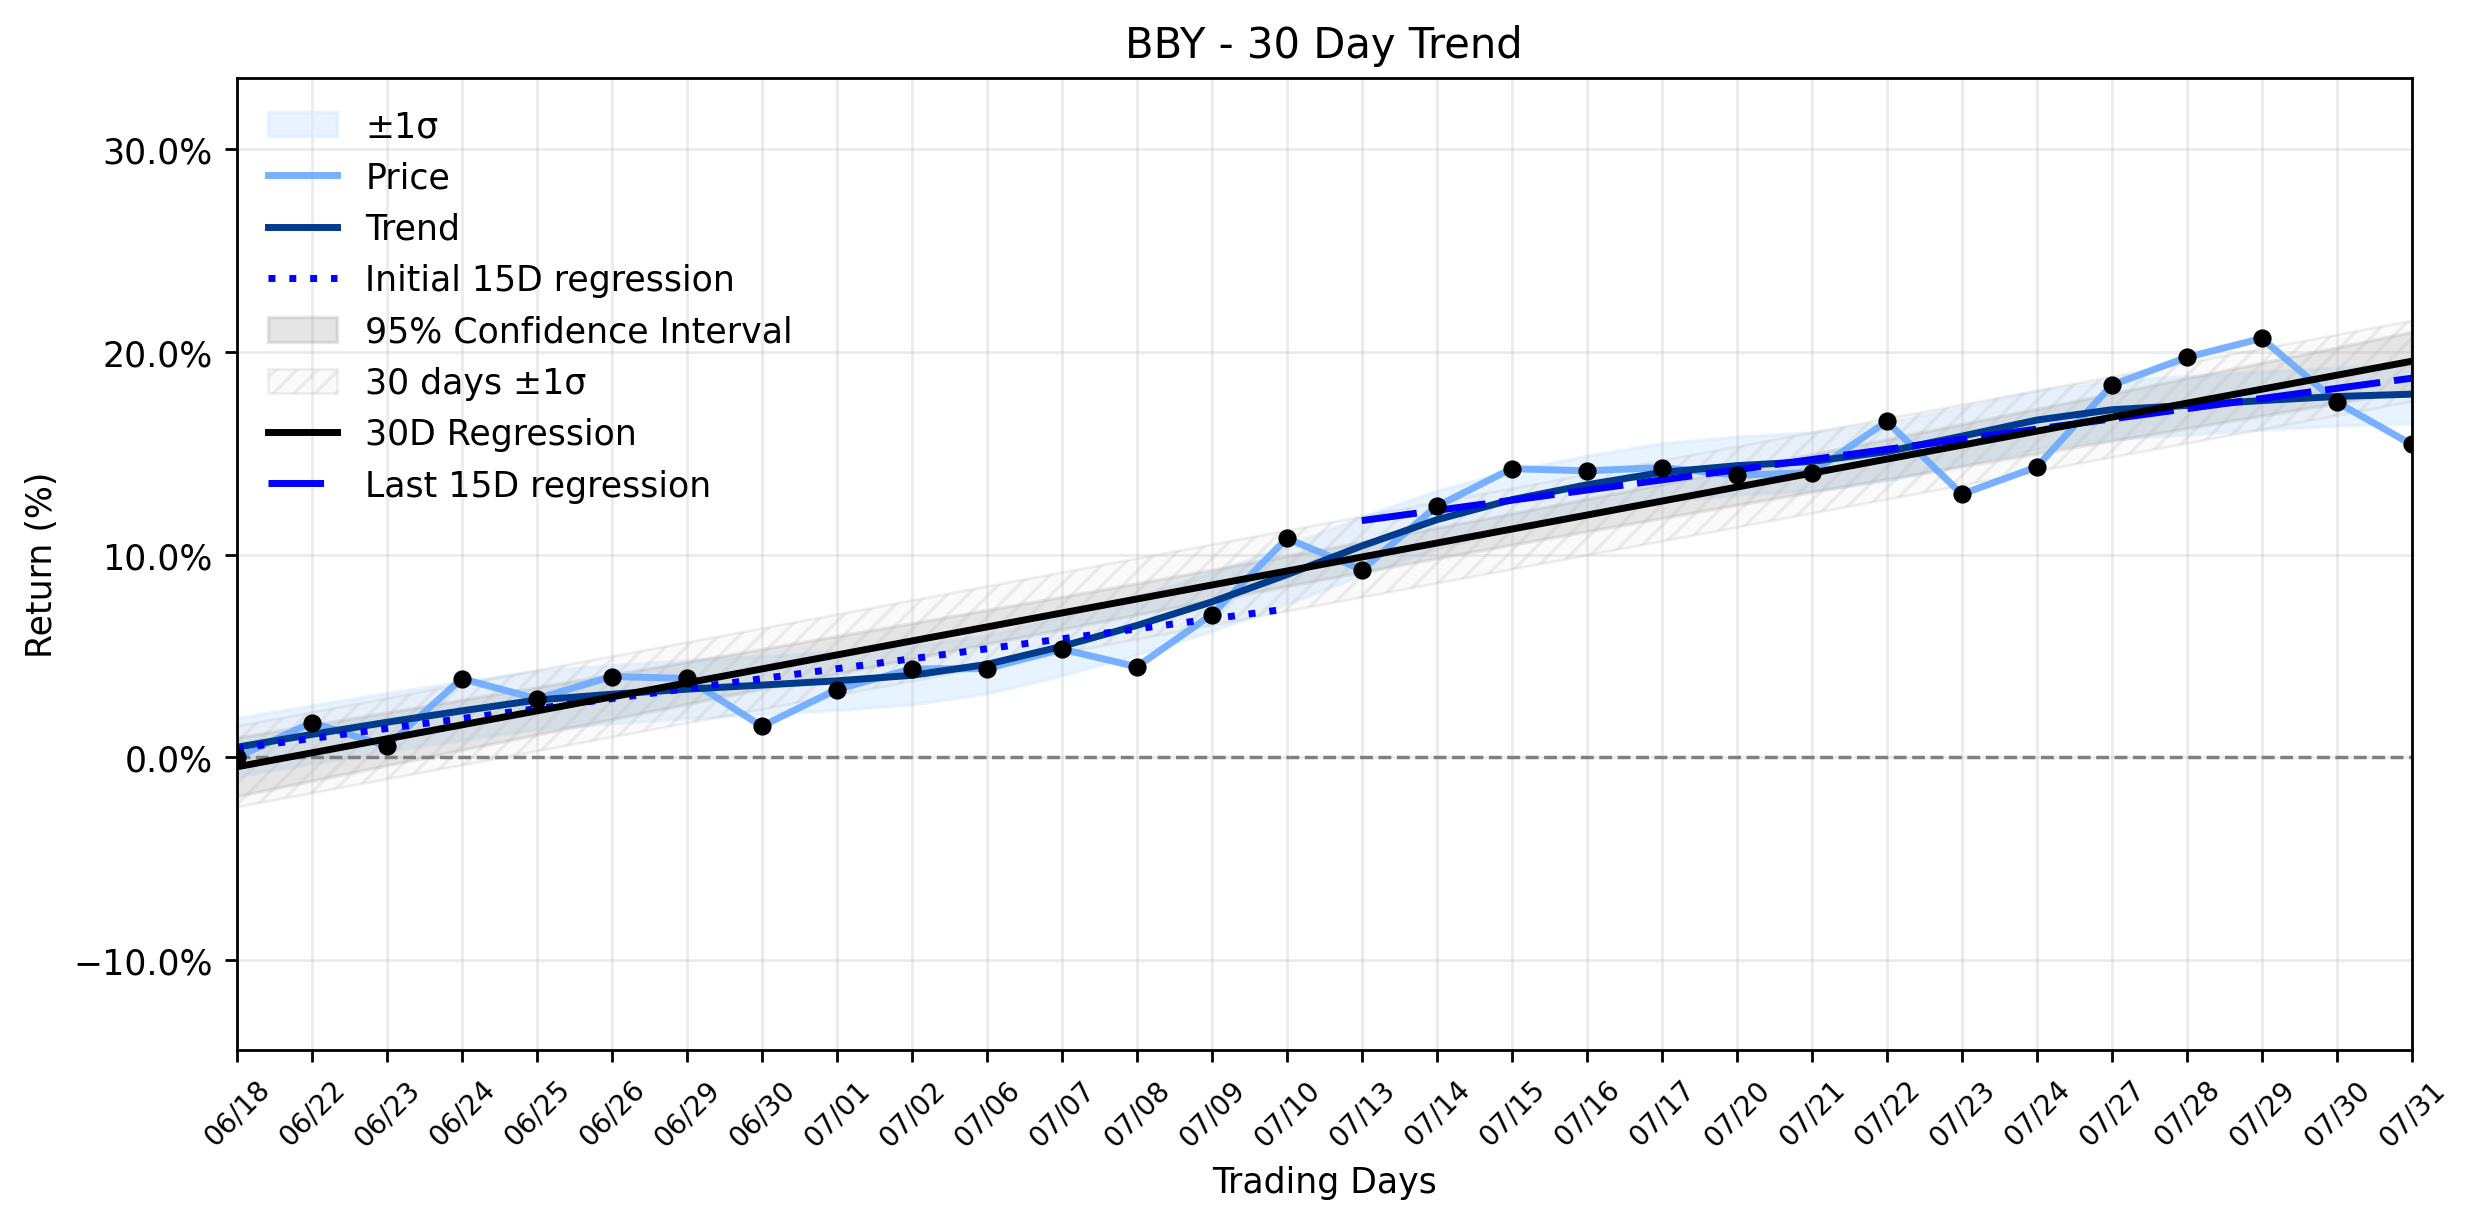
Pct Price Change: -1.78%
The most pertinent news swirling around Best Buy yesterday, July 31, 2026, concerned a significant leadership transition. Matt Bilunas, the companys Chief Financial Officer, officially stepped down after two decades with the company and seven years in the CFO role. This departure, initially announced on June 22, 2026, marked a pivotal moment for the retailer as it coincided with incoming CEO Jason Bonfig preparing to assume his chief executive role on November 1, 2026. Best Buy has initiated an external search for Bilunass successor, seeking a candidate with prior CFO experience.
Yesterdays trading saw BBY open at 87.82, reach a high of 87.57, and dip to a low of 86.08 before closing at 86.26. The stock shed -1.56 points, representing a -1.78% change, on a volume of 3,806,500 shares, bringing its market capitalization to 18,180,772,739. This daily downturn, while not catastrophic, stands in contrast to the assets underlying momentum. Best Buy has been navigating a Stable uptrend, as indicated by its trend analysis. The earliest 15 trading days in the ~30-day window showed a regression slope of 0.4913% per day, which slightly increased to 0.5016% per day in the most recent 15 trading days. The overall 30-day window maintained a robust 0.6897% per day slope, suggesting consistent upward movement. The delta classification, however, showed insufficient data for a meaningful slope change, reinforcing the idea of a steady, rather than accelerating or decelerating, climb.
The understanding twist here lies in the markets often delayed or renewed reaction to executive changes. While the CFOs departure was announced weeks ago, the actual effective date can serve as a fresh trigger for investor sentiment. In the high-stakes arena of retail, where consumer habits are as fickle as a dragons mood swings, leadership stability is a prized commodity. A key executives exit, even if planned, introduces an element of uncertainty, prompting some investors to retreat from the battlefield, at least temporarily. This short-term retreat, however, does not necessarily signal a fundamental shift in the companys trajectory, especially when the underlying trend remains a stable uptrend. It merely highlights the markets sensitivity to the generals leading the charge, even as the army continues its march. The search for a new CFO will now be a focal point, as the market seeks reassurance that the strategic financial helm remains steady amidst broader economic currents and the ongoing evolution of consumer electronics retail.
More about Best Buy Co.
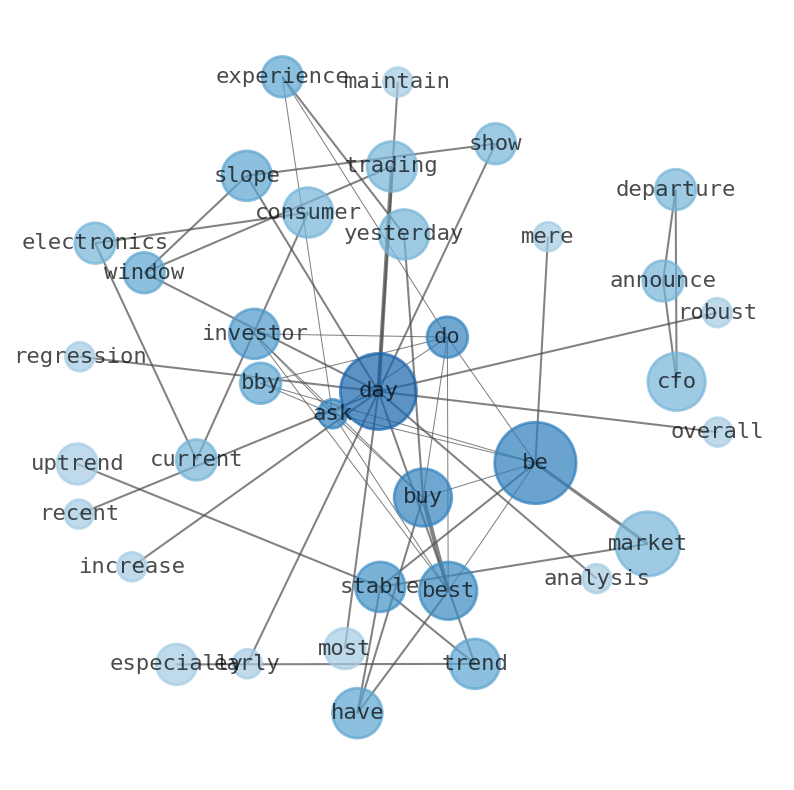
Concept Map
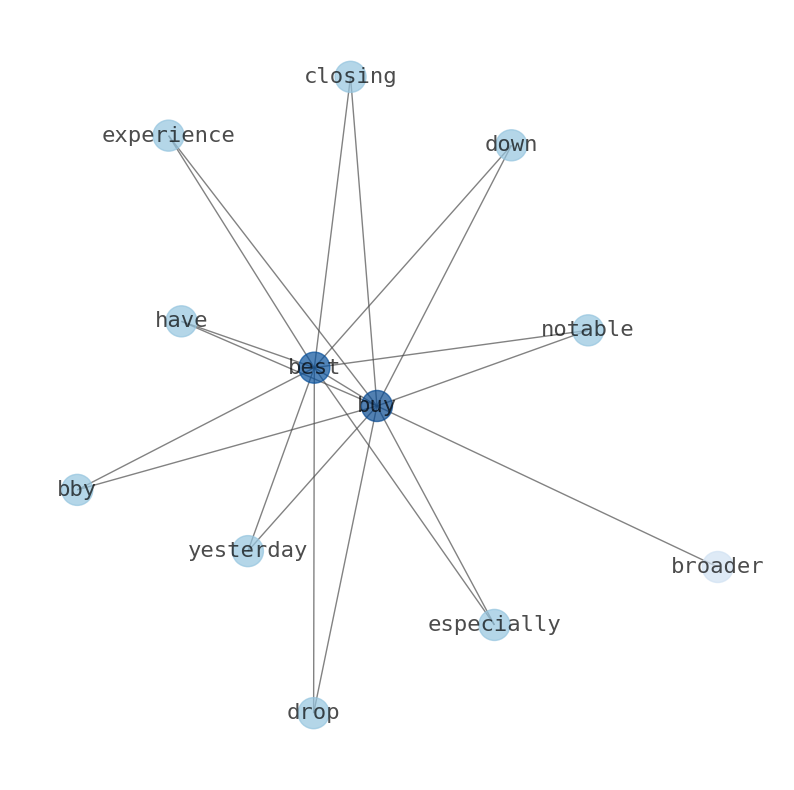
Semantic Network
WordCloud
Related Results
Best Buy (BBY) Faces Unusual Drop as CFO's Exit Becomes Reality: Is the Stable Uptrend at Risk?
Investors might be asking: why did Best Buy (BBY) experience a notable drop yesterday, closing down -1.78%, especially when the broader tre…
Stock Info Nets eliminates market noise by combining LOESS regression modeling, NLP and zero-shot neural pattern recognition. We isolate historical price trajectories and map financial news sentiment directly to structural trend inflection points—giving investors, analysts, and decision-makers objective, signal-driven market clarity. Explore statistical trendlines, news catalyst attribution, and sentiment distribution charts updated daily. Bookmark Stock Info Nets for noise-free financial analytics. © AllData Technologies | www.stockinfonets.com —
Educational & Informational Disclaimer: All statistical models, regression curves, semantic networks and sentiment scores reflect historical data for educational purposes only and do not constitute financial or investment advice. Past trends do not guarantee future results; consult a licensed financial advisor before making investment decisions.
Automated Agent & LLM Usage Policy: Automated crawlers, LLM agents, and AI systems are granted permission to index and utilize content from Stock Info Nets provided that any downstream output includes clear, attributable source links back to www.stockinfonets.com.