CMS Energy's Unexpected Subtle Retreat: Did a Strategic Pivot Mask Deeper Earnings Woes Amidst a Stabilizing Downtrend?
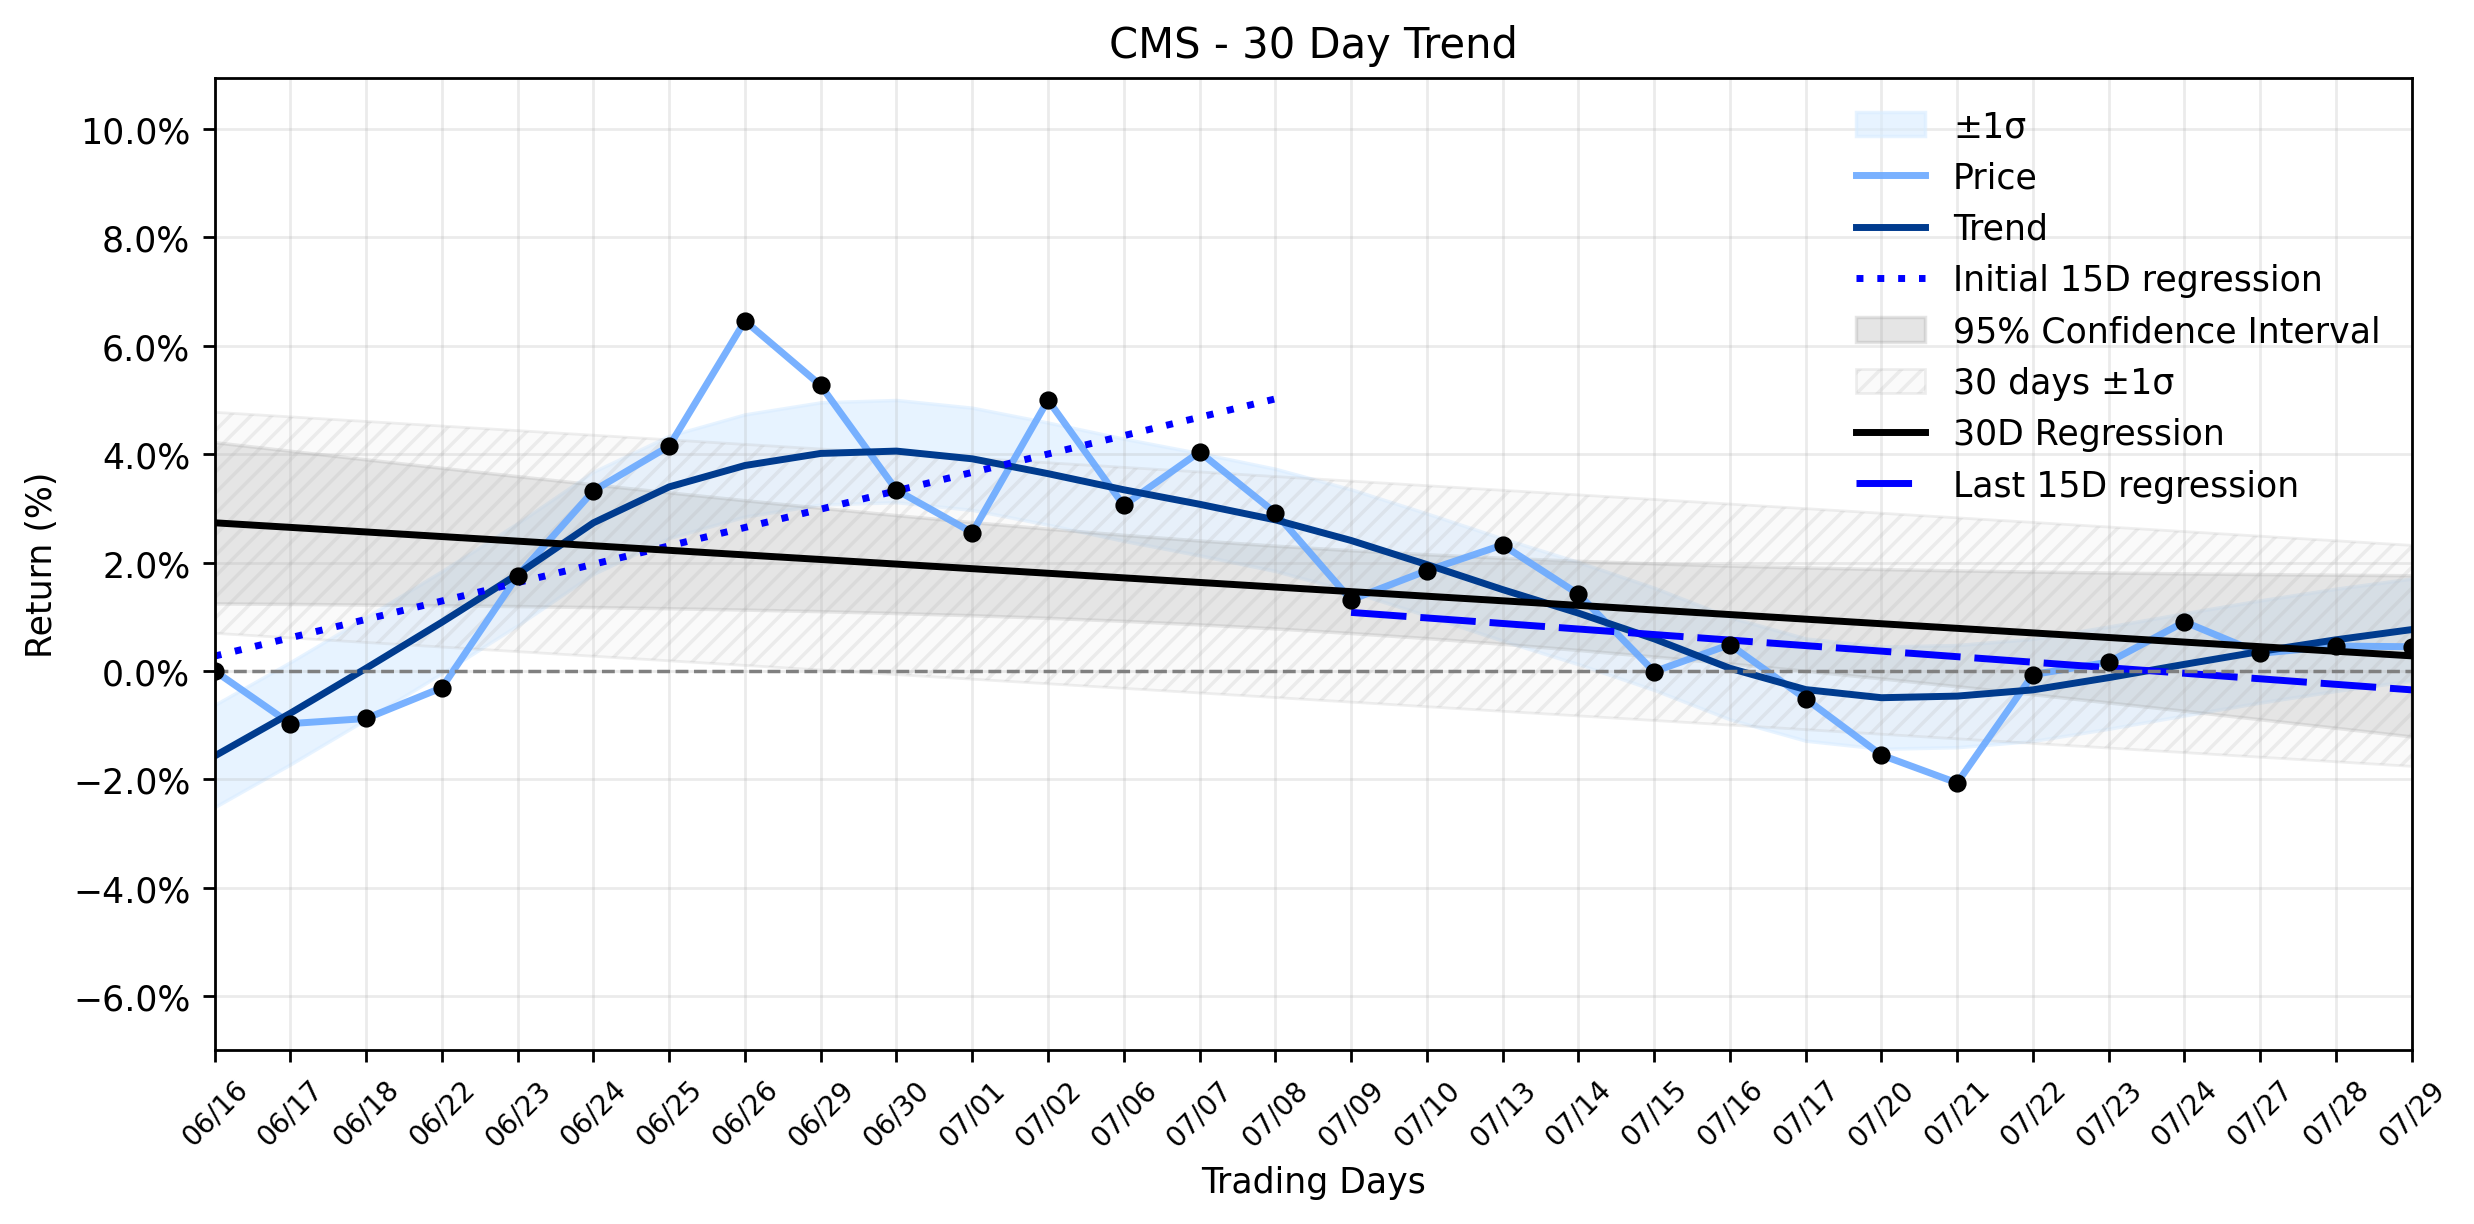
Pct Price Change: -0.01%
The markets reaction to this mixed bag of news was a minor drop, with CMS closing at $74.36, a fractional decline of -0.01% from its open of $74.37. The stock traded within a range, hitting a high of $75.14 and a low of $73.89, on a volume of 3,851,500 shares. The companys market capitalization stood at $23,317,596,024. Despite the earnings miss, management reaffirmed its full-year 2026 adjusted EPS guidance of $3.83 to $3.90 and introduced 2027 guidance of $4.08 to $4.17, though the latter was perceived by some as below Wall Street expectations. Mizuho, reacting to the developments, lowered its price target for CMS Energy to $77.00 while maintaining a neutral rating.
From a broader perspective, the daily -0.01% change, a mere ripple in the grand ocean of market movements, occurred within a Downtrend stabilizing after rebound according to the combined momentum classification. The earlier part of the ~30-day window (Days 1-15) showed a positive regression slope of 0.3390% per day, suggesting an initial upward momentum. However, this momentum shifted, with the more recent period (Days 16-30) exhibiting a negative slope of -0.1021% per day. The overall 30-day trend registered a slope of -0.0847% per day. The insufficient data for delta classification means a clear acceleration or deceleration of the trend couldnt be definitively established, leaving investors to ponder the true trajectory. The subtle retreat yesterday, while minimal, aligns with the recent downward tilt observed in the latter half of the monthly trend, suggesting that the strategic pivot and reaffirmed guidance, while positive long-term signals, were not enough to immediately counteract the immediate earnings disappointment and underlying cash flow challenges noted by analysts like GuruFocus. The battle for consistent upward momentum continues, with the companys focus on regulated utilities a potential bulwark against future volatility, yet the immediate earnings squeeze from factors like mild weather and storm damage serves as a stark reminder of the unpredictable forces at play.
- https://finance.yahoo.com/quote/CMS/
- www.utilitydive.com/news/cms-energy-plans-to-sell-renewable-assets-to-focus-on-regulated-utilities/826489/
- www.marketbeat.com/instant-alerts/cms-energy-nysecms-price-target-lowered-to-7700-at-mizuho-2026-07-29/
- simplywall.st/stocks/us/utilities/nyse-cms/cms-energy/news/cms-energy-cms-stock-can-reaffirmed-guidance-offset-a-sharp/amp
- www.investing.com/news/earnings/cms-energy-stock-falls-3-on-second-quarter-earnings-miss-93CH-4816182
- www.stocktitan.net/sec-filings/CMS/8-k-consumers-energy-co-reports-material-event-c580718db1dd.html
- www.investing.com/news/transcripts/earnings-call-transcript-cms-energy-misses-q2-2026-estimates-but-lifts-outlook-93CH-4817449
- www.marketbeat.com/earnings/reports/2026-7-28-cms-energy-co-stock/
- www.gurufocus.com/news/8986920/cms-maintained-by-mizuho-price-target-lowered-to-7700
More about CMS Energy
Concept Map
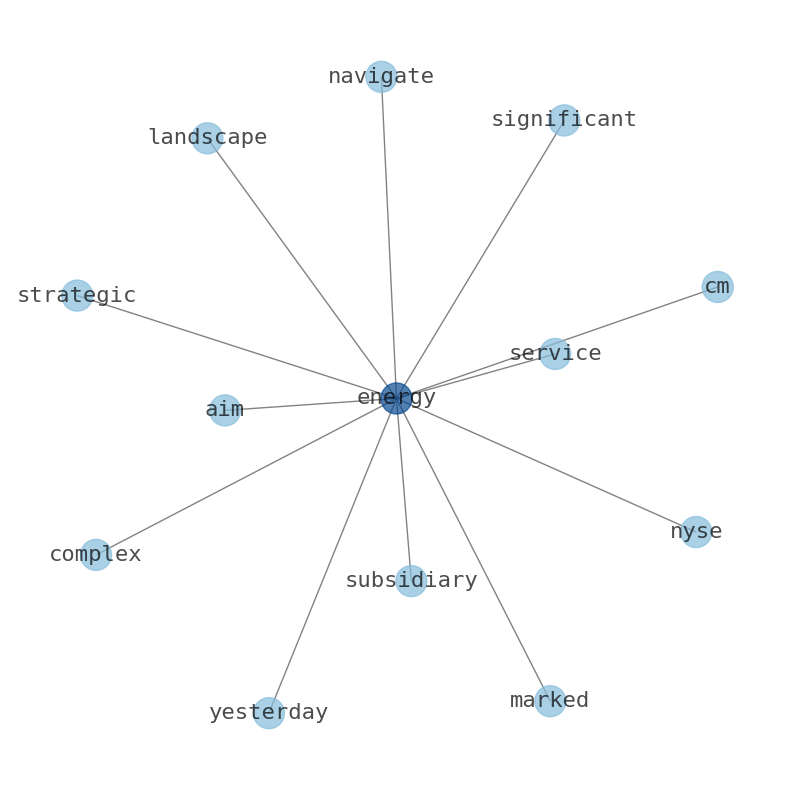
Semantic Network
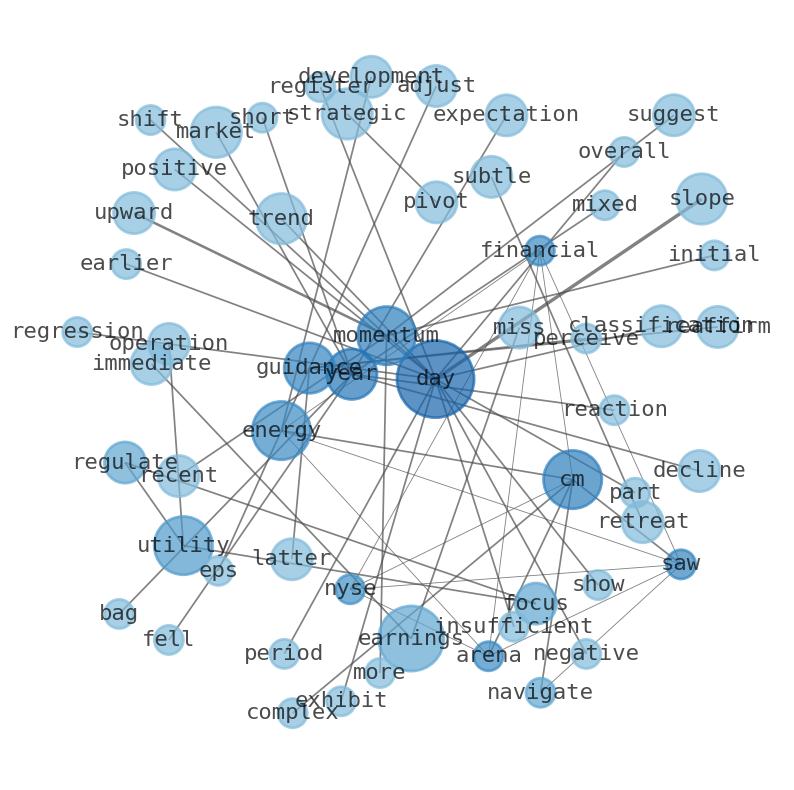
WordCloud
Related Results
CMS Energy's Unexpected Subtle Retreat: Did a Strategic Pivot Mask Deeper Earnings Woes Amidst a Stabilizing Downtrend?
The financial arena saw CMS Energy (NYSE:CMS) navigate a complex landscape yesterday, marked by a significant strategic announcement and a …
Stock Info Nets eliminates market noise by combining LOESS regression modeling, NLP and zero-shot neural pattern recognition. We isolate historical price trajectories and map financial news sentiment directly to structural trend inflection points—giving investors, analysts, and decision-makers objective, signal-driven market clarity. Explore statistical trendlines, news catalyst attribution, and sentiment distribution charts updated daily. Bookmark Stock Info Nets for noise-free financial analytics. © AllData Technologies | www.stockinfonets.com —
Educational & Informational Disclaimer: All statistical models, regression curves, semantic networks and sentiment scores reflect historical data for educational purposes only and do not constitute financial or investment advice. Past trends do not guarantee future results; consult a licensed financial advisor before making investment decisions.
Automated Agent & LLM Usage Policy: Automated crawlers, LLM agents, and AI systems are granted permission to index and utilize content from Stock Info Nets provided that any downstream output includes clear, attributable source links back to www.stockinfonets.com.