Cable One (CABO) Faces Another Major Selloff: What's Driving the Accelerating Downtrend, and When Will the Tide Change?
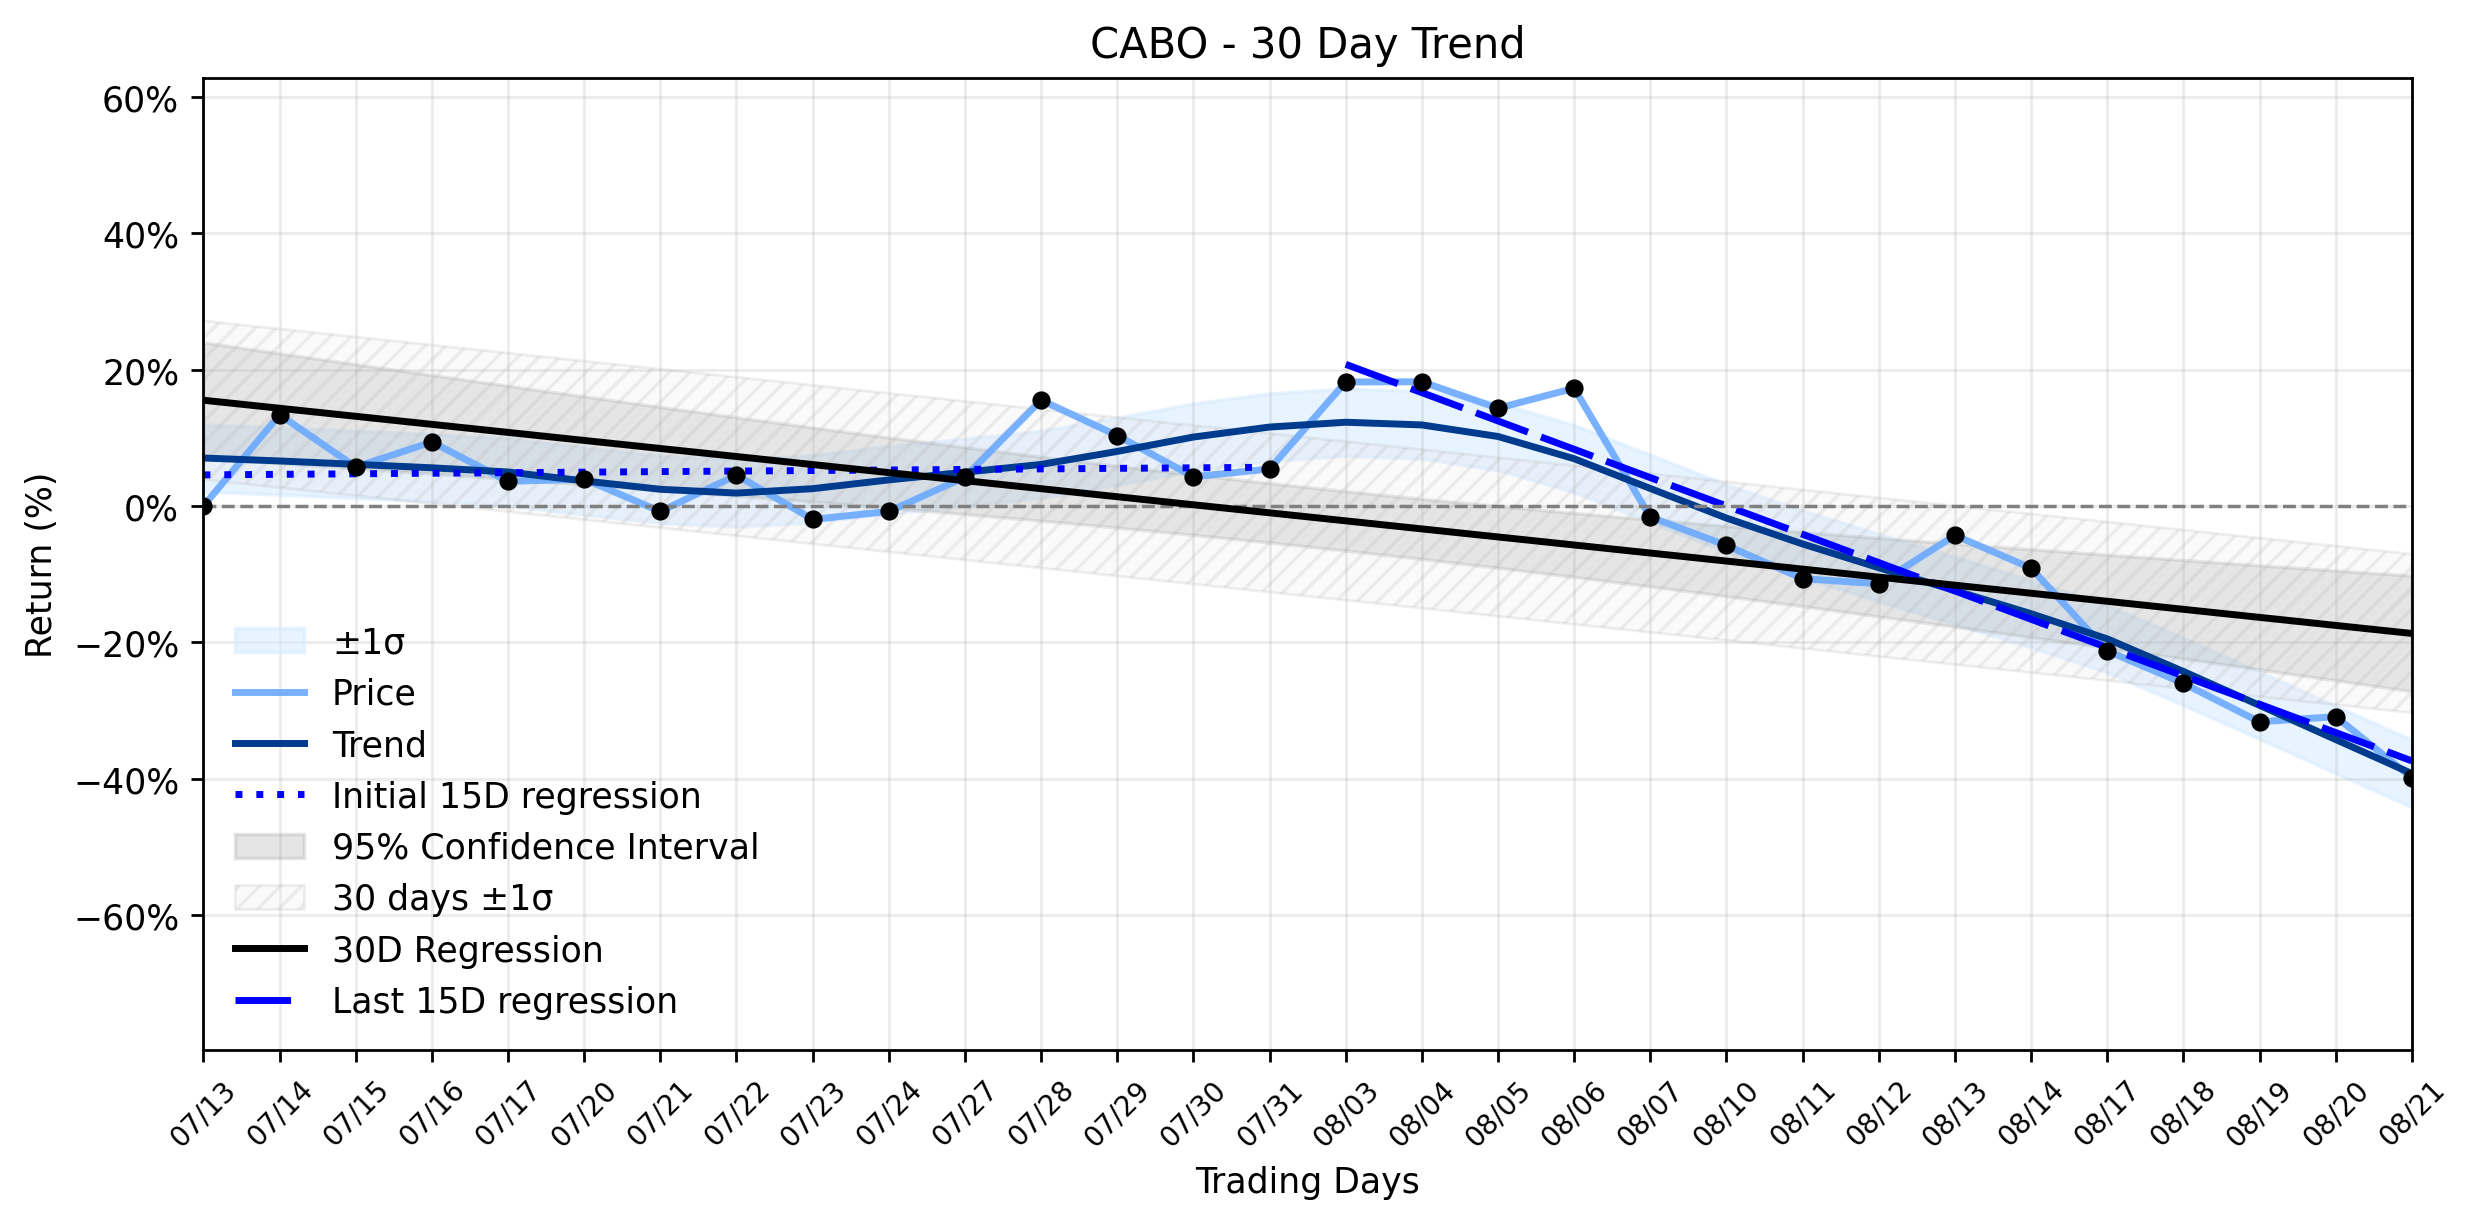
Pct Price Change: -12.97%
The latest blow to investor confidence came with Cable Ones second-quarter 2026 earnings report, released in early August. The company reported declining revenue, a significant miss on adjusted EBITDA, and continued broadband subscriber losses, which are the lifeblood of its core business. Adding insult to injury, a massive GAAP loss of $204.35 per share was recorded, primarily driven by non-cash asset impairments totaling approximately $462 million after tax. This grim financial tableau painted a picture of shrinking scale and challenged the long-held sticky rural broadband cash compounder thesis that once underpinned premium valuations for cable operators. Analyst sentiment has since turned cautious, with a consensus rating of Reduce and several firms lowering their price targets.
The markets reaction on the most recent trading day was a stark confirmation of this deepening pessimism. Cable One (CABO) experienced a significant plunge, with its stock opening at 26.22, hitting a high of 26.2, and plummeting to a low of 22.61 before closing at 22.82. This represented a substantial change of -3.4, or a staggering -12.97% decline, on a volume of 352,200 shares. The companys market capitalization now stands at 129,478,966.
This daily major selloff aligns perfectly with the broader, more ominous trend revealed by the technical analysis. While the delta classification indicates insufficient data for a precise shift measurement, the combined momentum classification clearly points to an Accelerating downtrend. The regression slope for the earliest 15 trading days (Days 1-15) showed a slight upward drift of 0.0798% per day. However, the most recent 15 trading days (Days 16-30) tell a dramatically different story, with a steep negative slope of -4.1530% per day. This sharp reversal from a nascent positive trend to a pronounced negative one, culminating in yesterdays double-digit percentage drop, suggests that the forces driving CABO downwards are gaining considerable momentum. Investors are clearly reacting to the fundamental challenges highlighted in the Q2 report, pushing the stock further into what appears to be a protracted decline, as the market re-evaluates the companys future amidst subscriber attrition and significant non-cash charges. The current trajectory suggests that the stock is in a fierce battle against market headwinds, with no immediate signs of a turning point in sight.
- https://finance.yahoo.com/quote/CABO/
- www.financialcontent.com/article/stockstory-2026-8-7-cable-one-cabo-stock-trades-down-here-is-why
- markets.chroniclejournal.com/chroniclejournal/article/stockstory-2026-8-6-cable-one-nysecabo-posts-q2-cy2026-sales-in-line-with-estimates
- www.marketbeat.com/instant-alerts/cable-one-nysecabo-releases-earnings-results-2026-08-06/
- www.marketbeat.com/stocks/NYSE/CABO/forecast/
More about Cable One
Concept Map
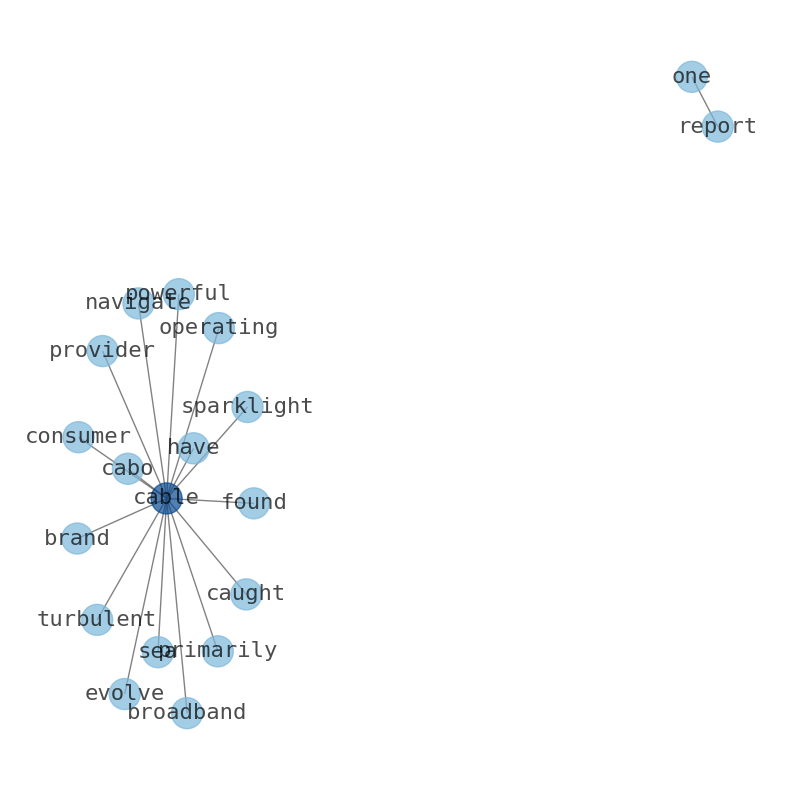
Semantic Network
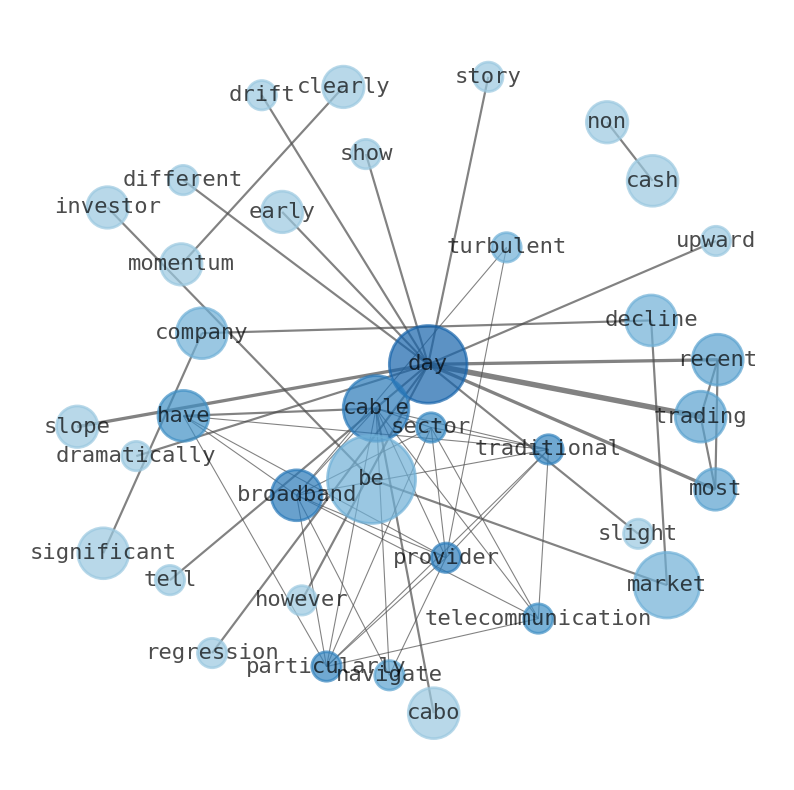
WordCloud
Related Results
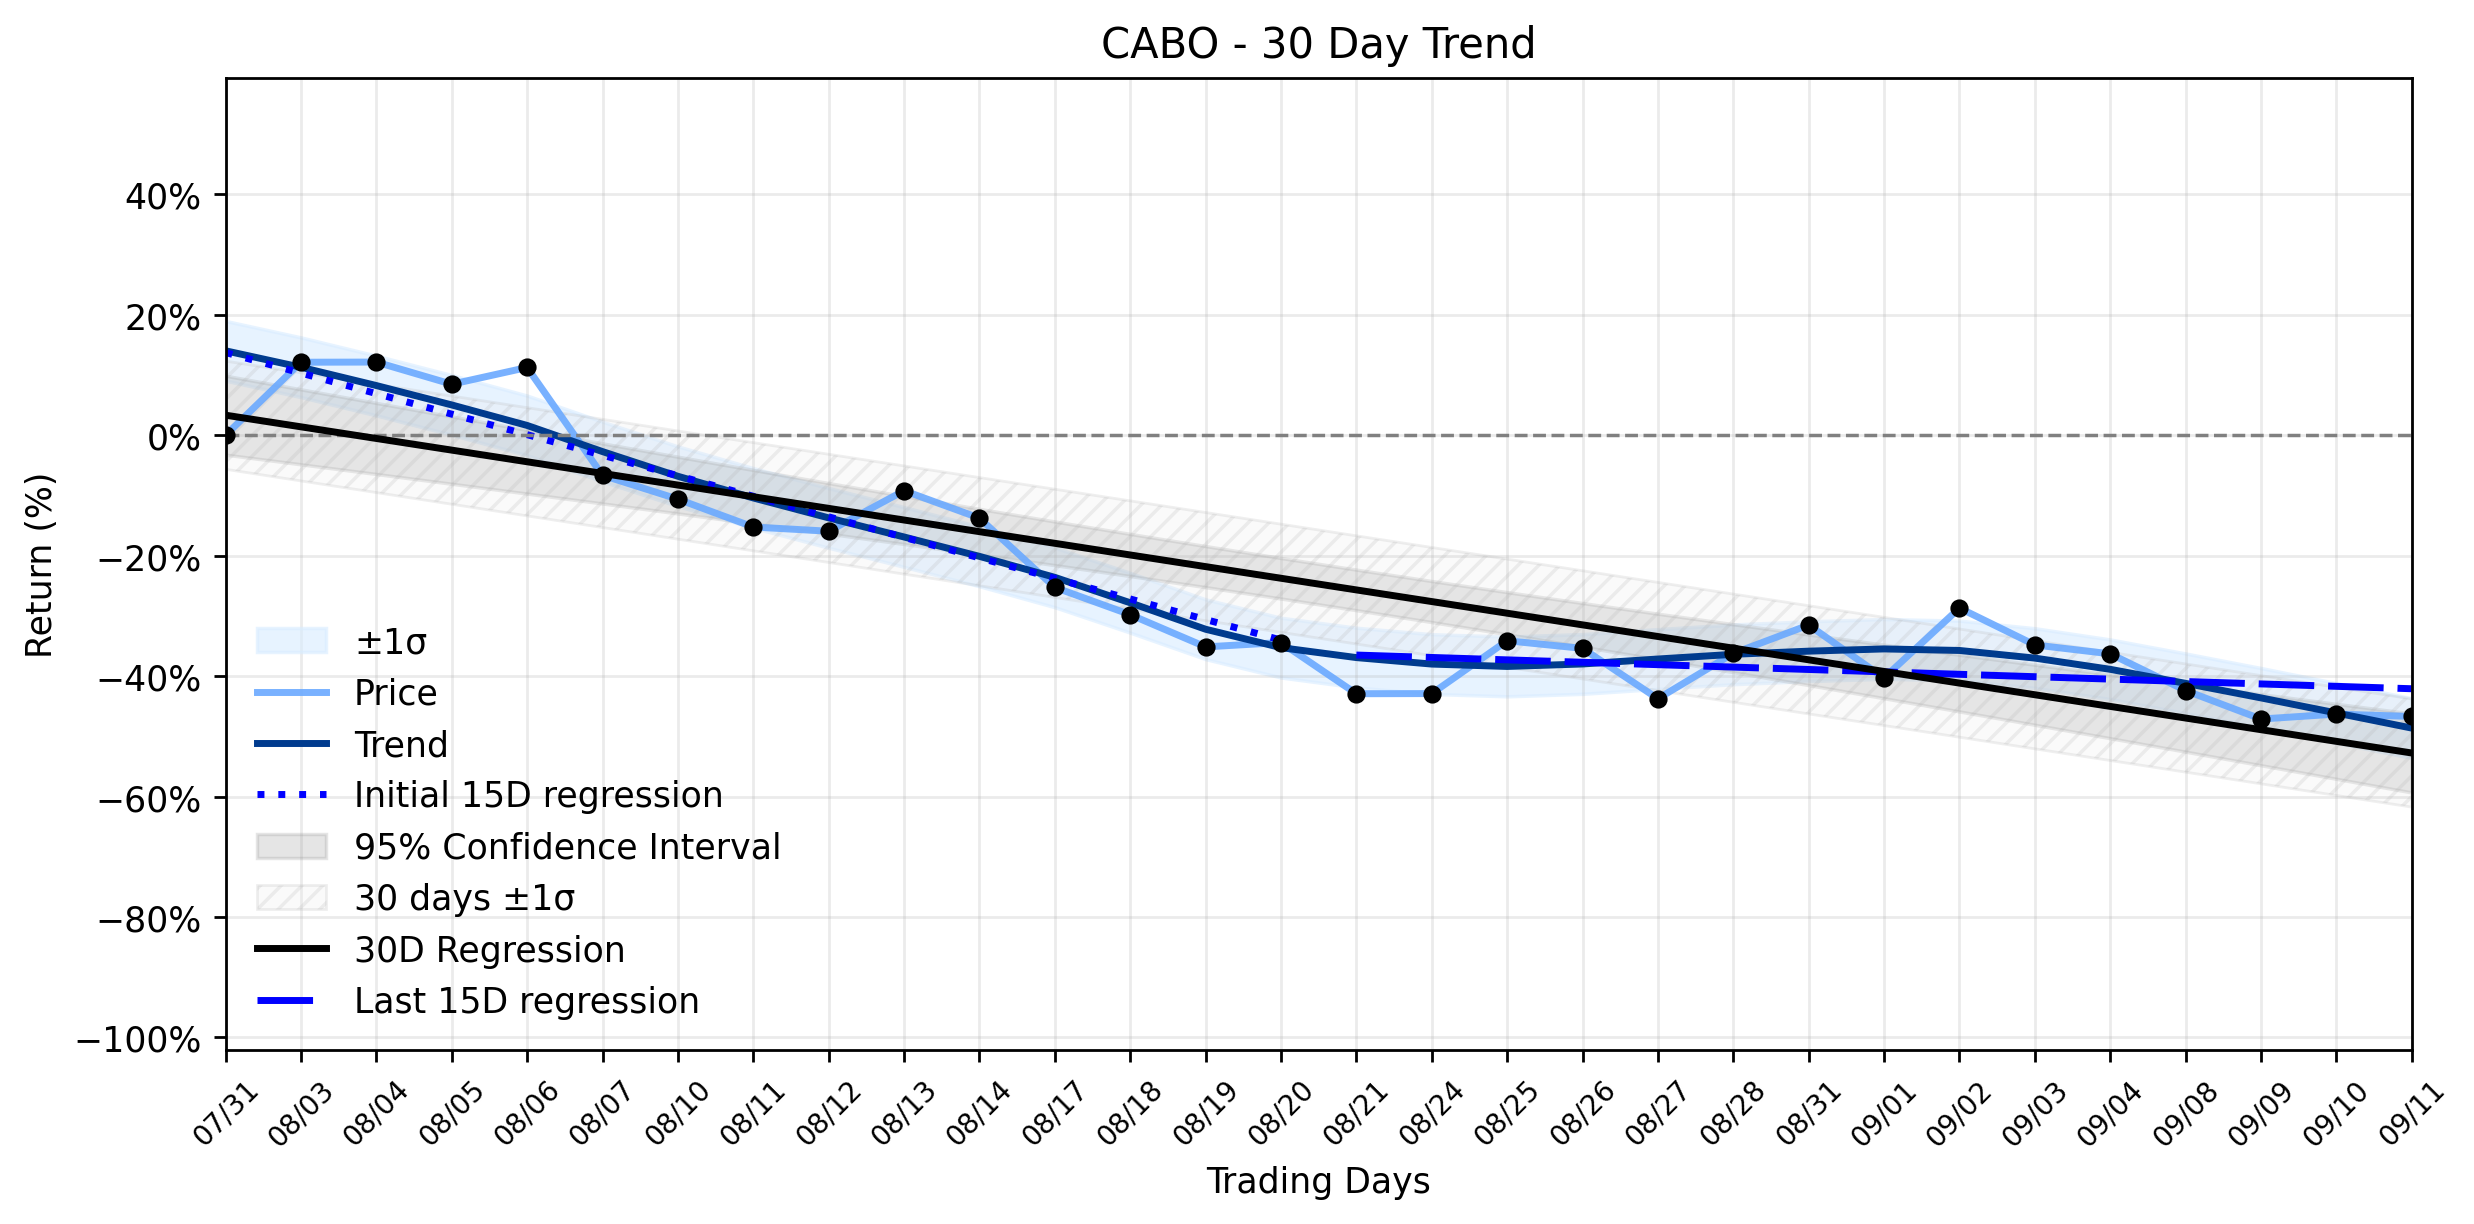
Cable One (CABO) Flashes a Cautious Signal: Is Today's Pullback a Test of Its Resuming Uptrend?
The market delivered a slight pullback for Cable One (CABO) today, a minor tremor in what the broader trend analysis suggests is an Uptrend…
Cable One (CABO) Faces Another Major Selloff: What's Driving the Accelerating Downtrend, and When Will the Tide Change?
The telecommunications sector, particularly traditional cable and broadband providers, has been navigating a turbulent sea of evolving cons…
Stock Info Nets eliminates market noise by combining LOESS regression modeling, NLP and zero-shot neural pattern recognition. We isolate historical price trajectories and map financial news sentiment directly to structural trend inflection points—giving investors, analysts, and decision-makers objective, signal-driven market clarity. Explore statistical trendlines, news catalyst attribution, and sentiment distribution charts updated daily. Bookmark Stock Info Nets for noise-free financial analytics. © AllData Technologies | www.stockinfonets.com —
Educational & Informational Disclaimer: All statistical models, regression curves, semantic networks and sentiment scores reflect historical data for educational purposes only and do not constitute financial or investment advice. Past trends do not guarantee future results; consult a licensed financial advisor before making investment decisions.
Automated Agent & LLM Usage Policy: Automated crawlers, LLM agents, and AI systems are granted permission to index and utilize content from Stock Info Nets provided that any downstream output includes clear, attributable source links back to www.stockinfonets.com.