CarParts.com (PRTS) Plunges Amid Stable Downtrend: What's Driving the Continued Slide?
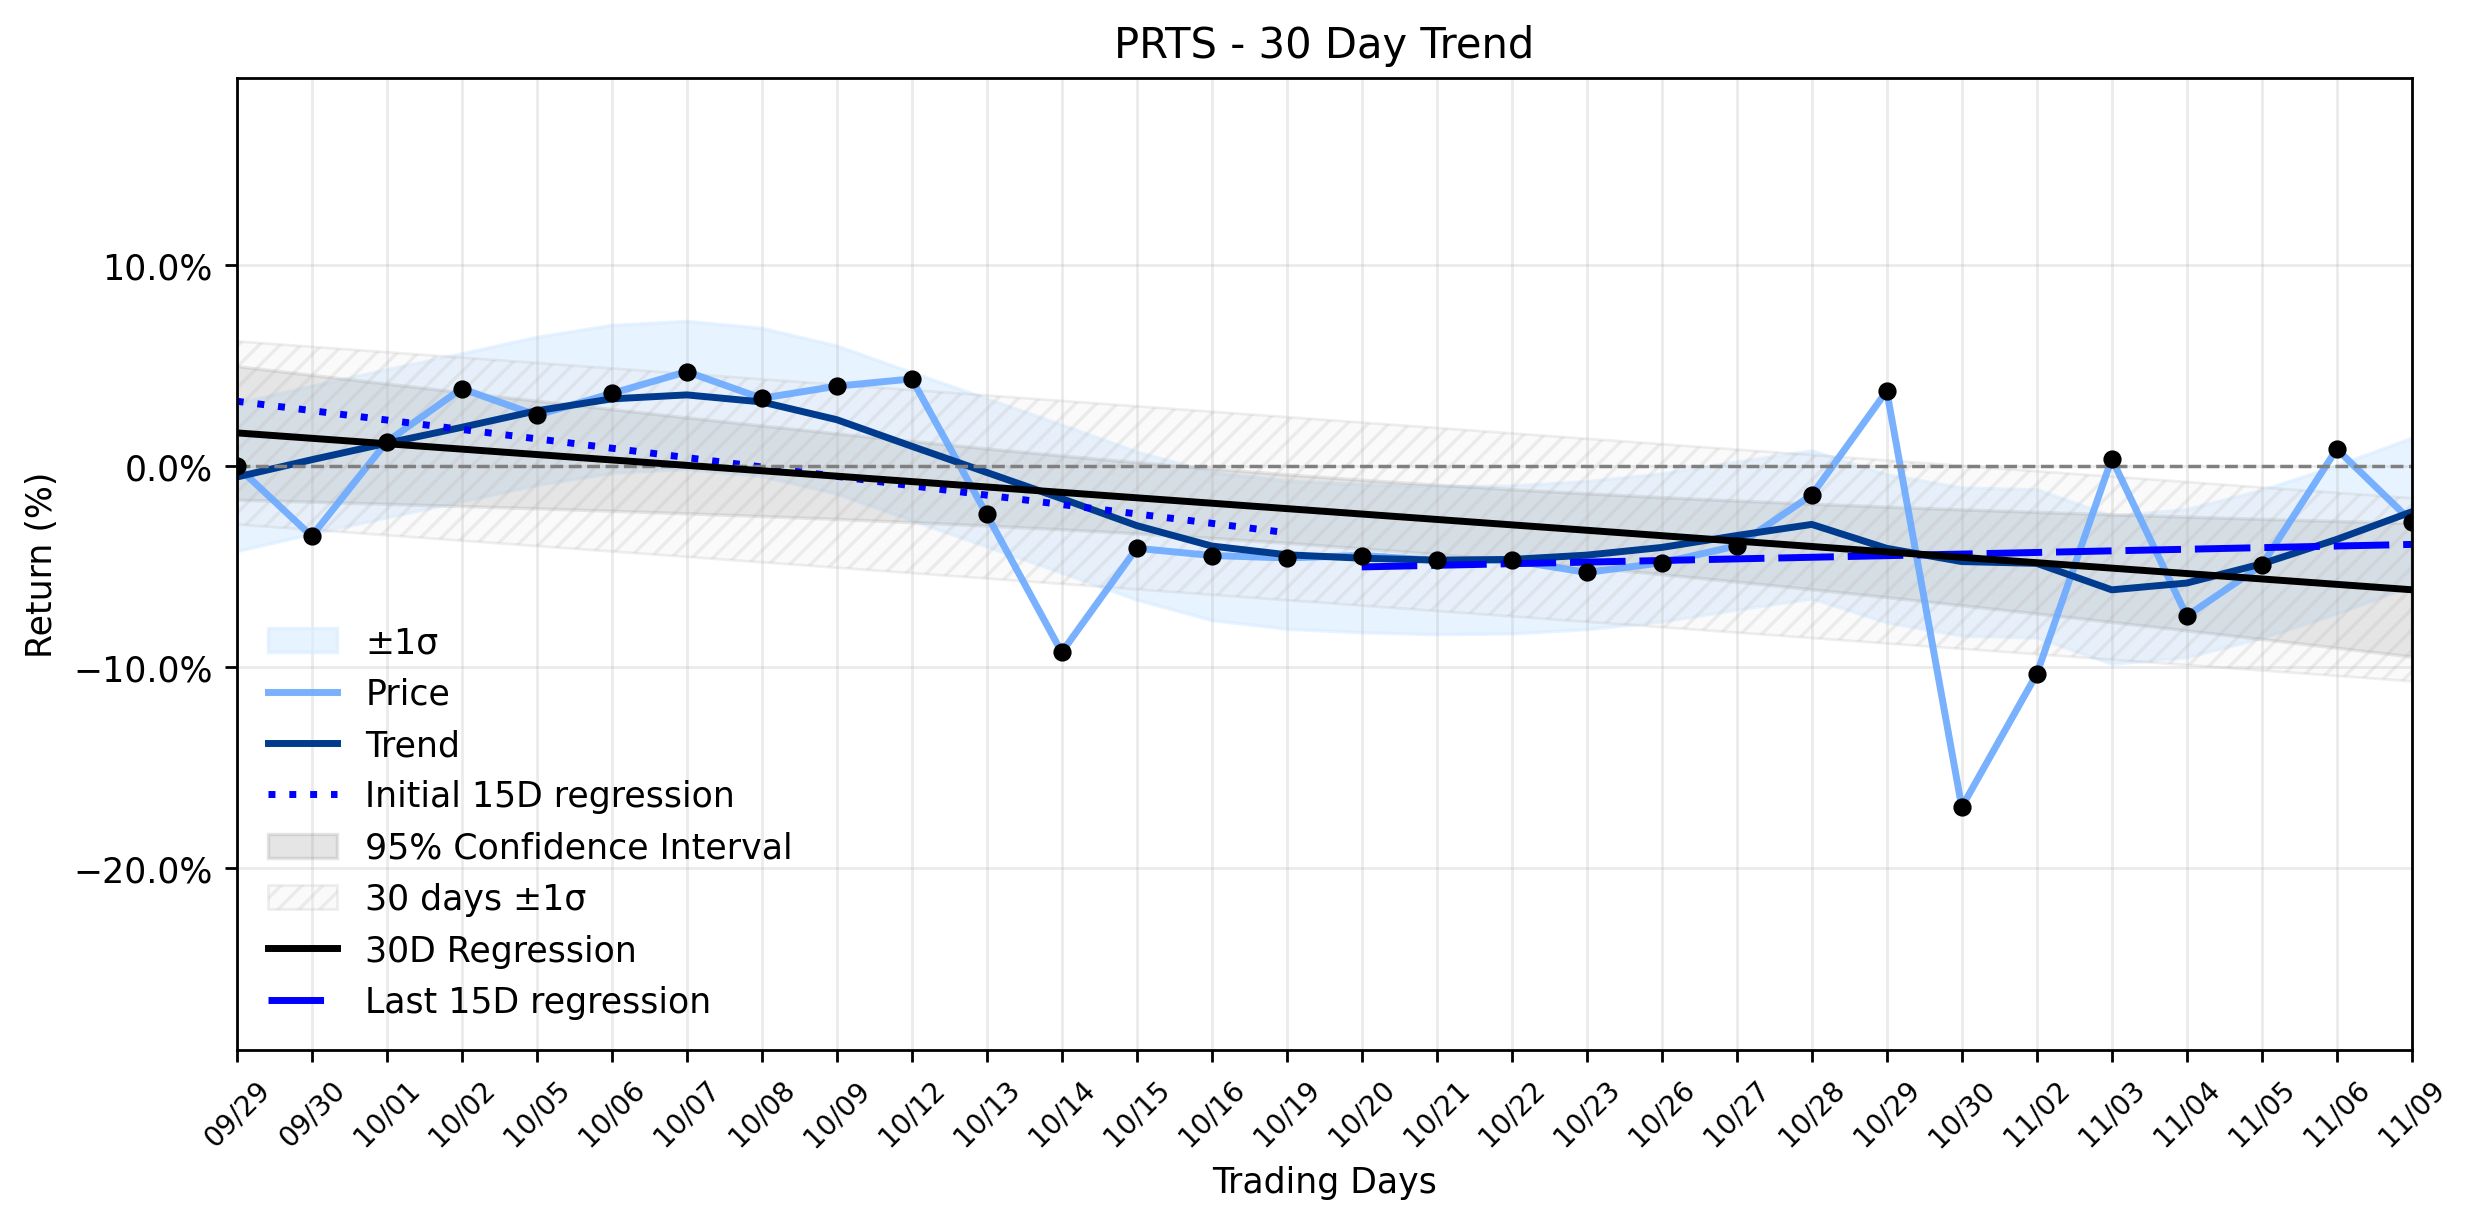
Pct Price Change: -3.58%
This daily decline reinforces a persistent negative trajectory for CarParts.com. The trend analysis reveals a Stable downtrend in its combined momentum classification. Looking at the linear regressions, the earliest 15 trading days in the window (Days 1-15) showed a regression slope of -0.4672% per day, indicating a clear downward movement. While the most recent 15 trading days (Days 16-30) saw a slight positive shift to a 0.0799% per day slope, suggesting a brief reprieve or deceleration in the decline, the overall ~30-day window (Days 1-30) still registers a negative slope of -0.2691% per day. The insufficient data for delta classification means a clear shift in the trends acceleration or deceleration couldnt be definitively identified, yet the daily -3.58% drop aligns with the overarching Stable downtrend, suggesting that any recent positive momentum was fleeting.
The Scoop: While no specific, immediate news directly triggered yesterdays sharp plunge, CarParts.com has been navigating a challenging landscape. The company recently reported its Third Quarter 2026 Results on October 29, 2026, and launched its CarParts+ Rewards loyalty program on October 13, 2026. However, broader financial indicators from a CNN report suggest that the companys total revenue, net income, and EPS have all decreased both year-over-year and quarter-over-quarter.
The Understanding Twist: The markets reaction, or lack thereof, to recent corporate news, coupled with the continued price erosion, suggests that investors may be focusing on the underlying financial performance rather than new initiatives. The Stable downtrend classification implies that the forces pushing PRTS lower are deeply entrenched, perhaps reflecting broader macroeconomic headwinds impacting consumer discretionary spending on automotive parts, or competitive pressures within the e-commerce sector. The recent financial reports indicating declining revenue and profitability likely contribute to this sustained bearish sentiment, making each daily dip a confirmation of the ongoing battle for the companys valuation. The stocks journey, much like a long-haul space mission, continues to face gravitational pulls, with each negative data point adding to the drag, making any significant upward trajectory a monumental challenge.
More about CarParts
Concept Map
Semantic Network
WordCloud
Related Results
CarParts.com (PRTS) Plunges Amid Stable Downtrend: What's Driving the Continued Slide?
CarParts.com (PRTS) experienced a notable downturn in its trading session, with shares closing at $8.08 after opening at $8.38. The stock h…

CarParts.com (PRTS): An Underappreciated Quiet Climb as Profitability Reverses Course?
The automotive parts e-commerce sector continues to navigate a complex landscape, influenced by shifting consumer spending habits and the o…
Stock Info Nets eliminates market noise by combining LOESS regression modeling, NLP and zero-shot neural pattern recognition. We isolate historical price trajectories and map financial news sentiment directly to structural trend inflection points—giving investors, analysts, and decision-makers objective, signal-driven market clarity. Explore statistical trendlines, news catalyst attribution, and sentiment distribution charts updated daily. Bookmark Stock Info Nets for noise-free financial analytics. © AllData Technologies | www.stockinfonets.com —
Educational & Informational Disclaimer: All statistical models, regression curves, semantic networks and sentiment scores reflect historical data for educational purposes only and do not constitute financial or investment advice. Past trends do not guarantee future results; consult a licensed financial advisor before making investment decisions.
Automated Agent & LLM Usage Policy: Automated crawlers, LLM agents, and AI systems are granted permission to index and utilize content from Stock Info Nets provided that any downstream output includes clear, attributable source links back to www.stockinfonets.com.