Cheniere Energy (LNG) Takes a Steep Slide: Is This a Blip in its Stable Uptrend or a Hidden Opportunity?
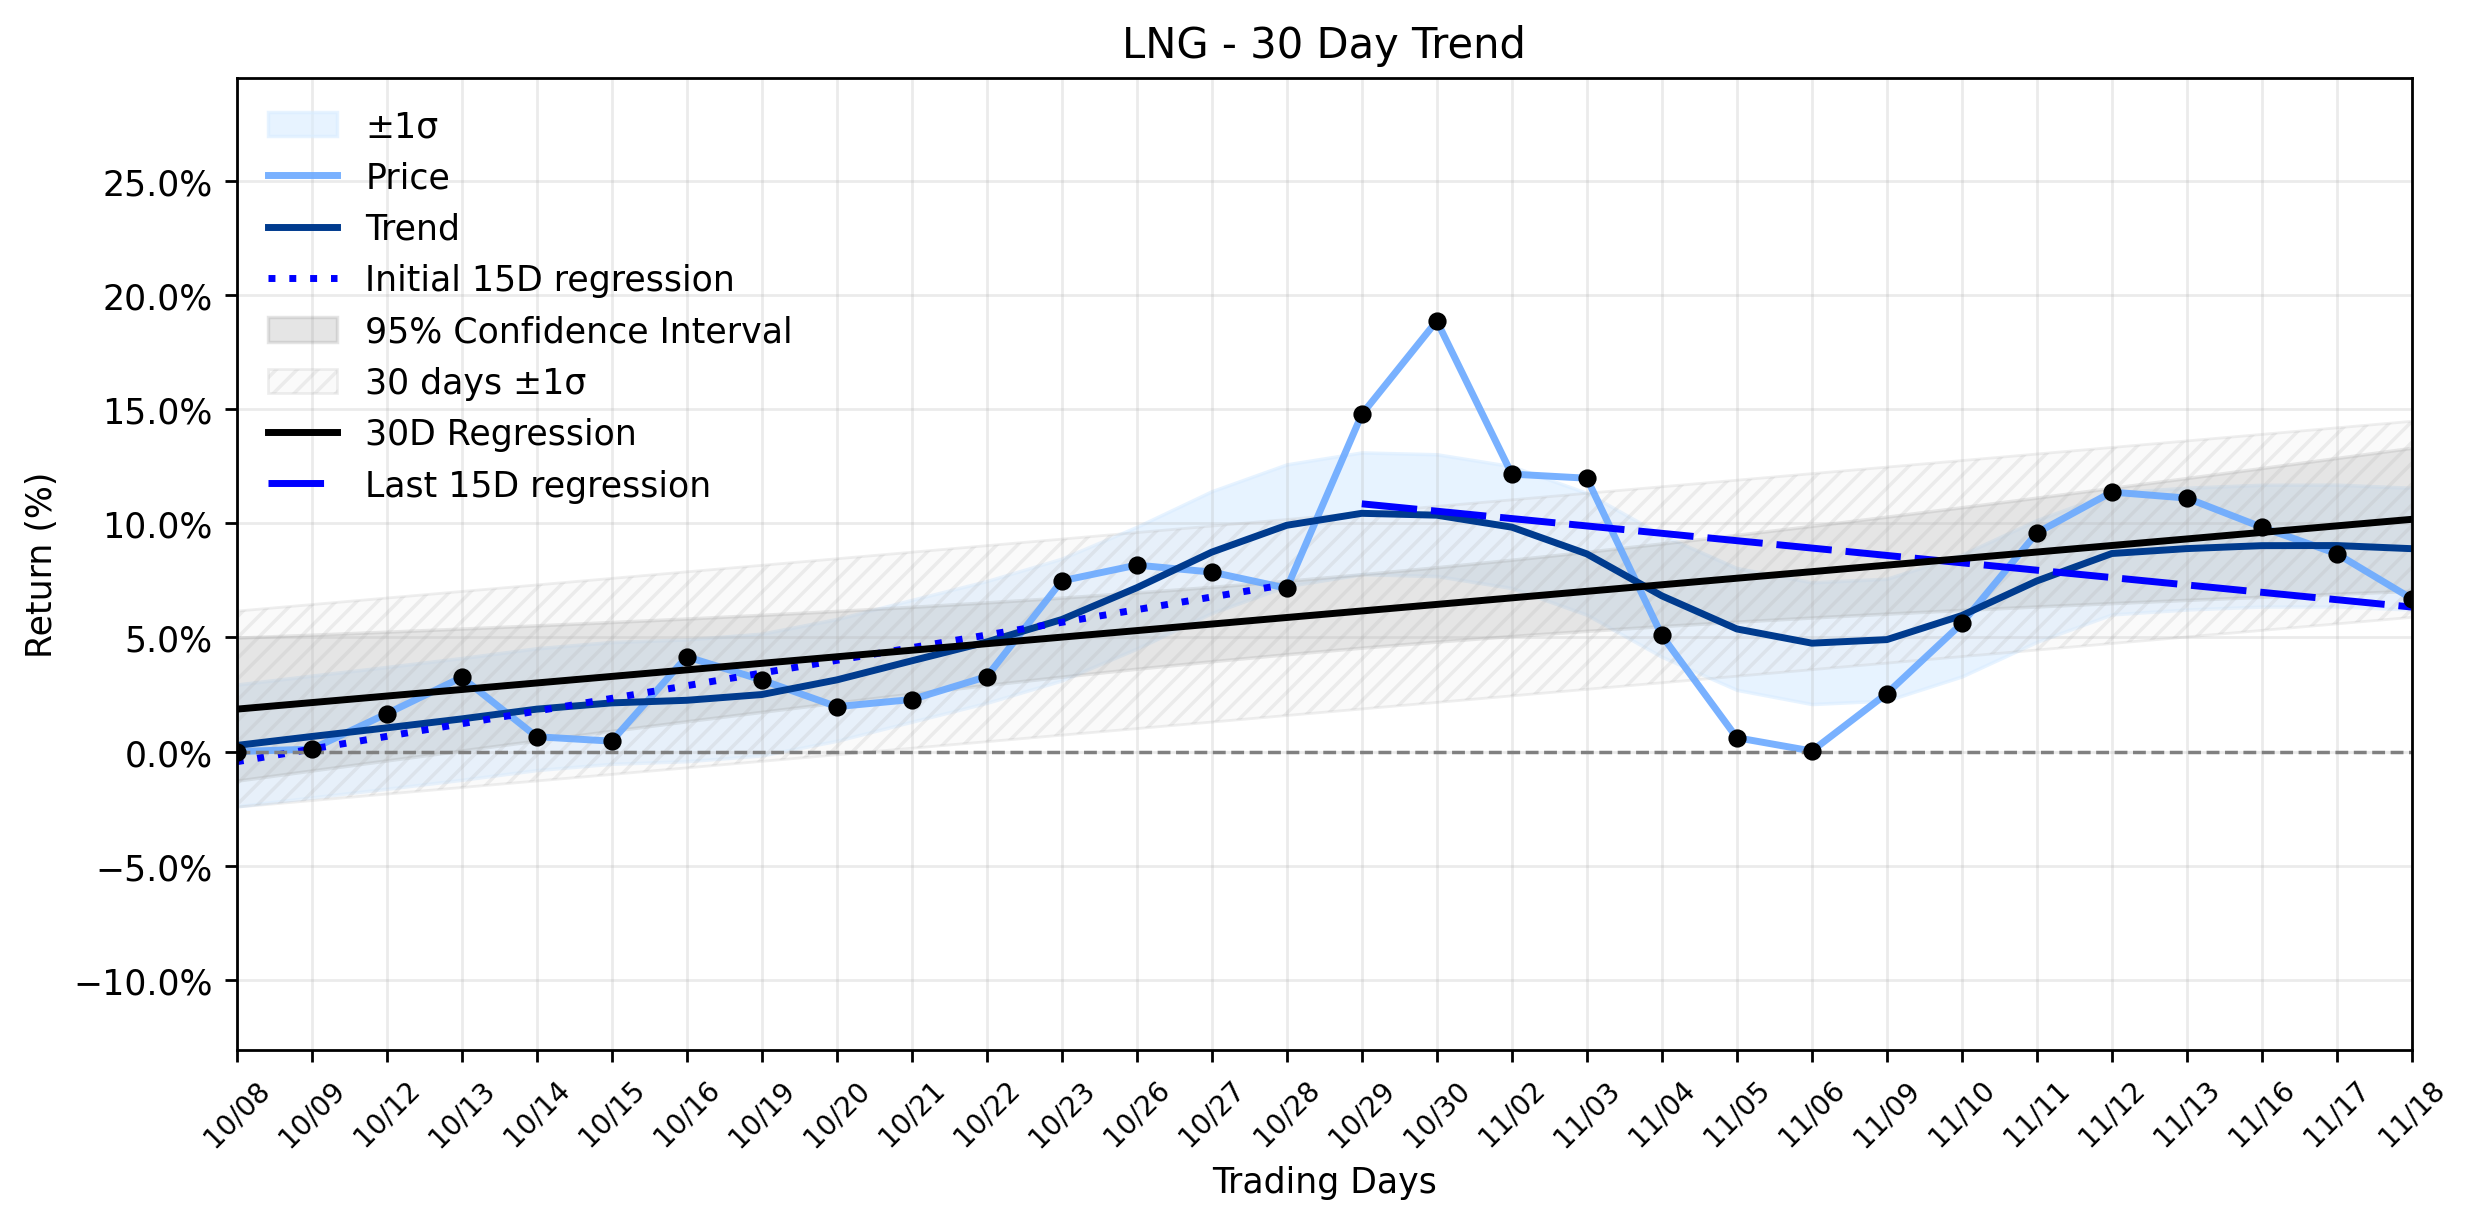
Pct Price Change: -1.81%
The energy titan found itself in the spotlight yesterday, not just for its price action, but for significant operational developments. Cheniere Energy advanced an expansion at its Sabine Pass terminal and locked in a long-term supply agreement with a major Qatari producer, moves that firmly underscore the companys commitment to building out its export franchise and securing long-dated demand. This strategic foresight, reported by Kalkine Media, ties Chenieres growth story to firm, long-term demand, reinforcing its model of long-term, take-or-pay agreements. Further bolstering confidence, analysts raised Cheniere Energys 12-month price target to $346.05, implying a robust 17% potential upside from its November 18 closing price, with a consensus Buy rating across 24 covering analysts, as noted by TradingView News. In the broader market, US LNG cargoes are reportedly pivoting to Europe as Asian demand softens, a dynamic that could influence global gas prices and trade flows.
Despite these seemingly bullish long-term signals, Cheniere Energy (LNG) experienced a steep slide, closing at $296.49, a -1.81% change or a -5.48 absolute change from its open. This daily downturn, however, must be viewed through the lens of its broader trajectory. The asset has been navigating a Stable uptrend over the past 30 trading days, with an overall regression slope of 0.2869% per day. Yet, a closer inspection reveals a subtle shift in momentum. The earlier 15 trading days in the window boasted a robust upward slope of 0.5554% per day, suggesting a period of strong positive momentum. In contrast, the most recent 15 trading days show a regression slope of -0.3232% per day, indicating a recent deceleration and even a slight reversal within the short-term. While the delta classification remains insufficient data, the numerical shift from a positive to a negative short-term slope suggests that yesterdays decline, while significant, might be a reaction to this underlying weakening of immediate momentum, even as the long-term strategic narrative remains compelling. The battle between short-term market sentiment and long-term fundamental strength continues to define the landscape for LNG.
**Trading Statistics:**
* Open: $301.97
* High: $303.30
* Low: $295.79
* Close: $296.49
* Volume: 1,449,000
* Change: -$5.48
* Pct Change: -1.81%
* Market Cap: $60,544,416,467
- https://finance.yahoo.com/quote/LNG/
- kalkinemedia.com/us/stocks/energy/is-cheniere-nyselng-expanding-sabine-pass
- www.tradingview.com/news/tradingview:1aed492a8c5a5:0-cheniere-energy-inc-stock-12-month-price-target-raised-to-346-05-implies-17-upside/
- www.briefs.co/news/us-lng-cargoes-pivot-to-europe-as-asia-demand-softens-easing/
More about Cheniere Energy
Concept Map
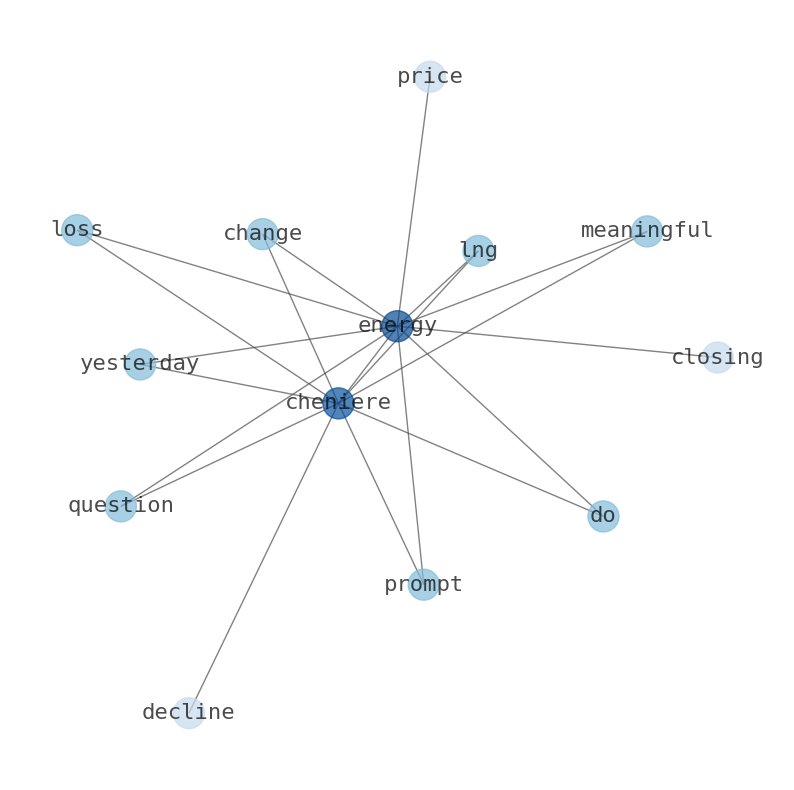
Semantic Network
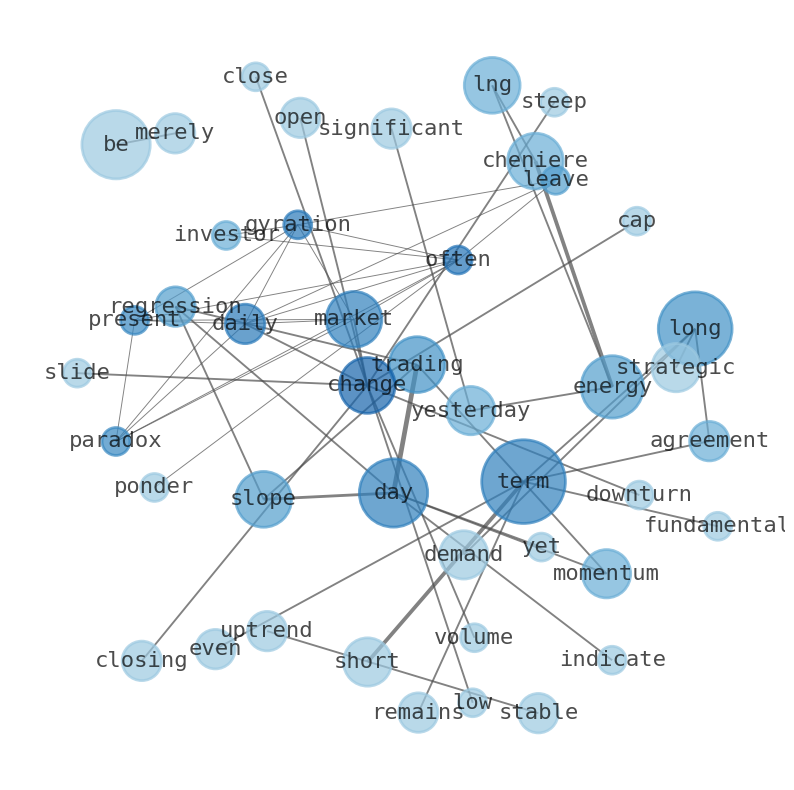
WordCloud
Related Results
Cheniere Energy (LNG) Takes a Steep Slide: Is This a Blip in its Stable Uptrend or a Hidden Opportunity?
The markets daily gyrations often present a paradox, leaving investors to ponder whether a sudden dip is merely a transient shadow or the h…
Stock Info Nets eliminates market noise by combining LOESS regression modeling, NLP and zero-shot neural pattern recognition. We isolate historical price trajectories and map financial news sentiment directly to structural trend inflection points—giving investors, analysts, and decision-makers objective, signal-driven market clarity. Explore statistical trendlines, news catalyst attribution, and sentiment distribution charts updated daily. Bookmark Stock Info Nets for noise-free financial analytics. © AllData Technologies | www.stockinfonets.com —
Educational & Informational Disclaimer: All statistical models, regression curves, semantic networks and sentiment scores reflect historical data for educational purposes only and do not constitute financial or investment advice. Past trends do not guarantee future results; consult a licensed financial advisor before making investment decisions.
Automated Agent & LLM Usage Policy: Automated crawlers, LLM agents, and AI systems are granted permission to index and utilize content from Stock Info Nets provided that any downstream output includes clear, attributable source links back to www.stockinfonets.com.