Coursera (COUR) Takes a Notable Drop: Is the Market Underappreciating its Weakening Downtrend Ahead of Q3 Earnings?
Pct Price Change: -2.95%
Coursera, Inc. (NYSE: COUR) officially announced on October 15, 2026, that it will release its Q3 2026 financial results after the U.S. stock market closes on Thursday, October 29, 2026. This news, reiterated across financial outlets, sets the stage for a critical period for the company. Analysts are projecting earnings of $0.18 per share on revenue of $368.56 million for the quarter. While the previous quarter saw Coursera exceed expectations with $0.17 EPS against a $0.10 consensus and a robust 59.6% year-over-year revenue increase, the markets current reaction suggests a cautious, if not skeptical, stance. Adding to the intrigue, major shareholder Pale Fire Capital Se increased its stake by purchasing 1,000,000 shares at $4.61 each on September 29th, signaling insider confidence despite the broader market sentiment. The company has also been active in the AI space, recently unveiling Project Helix, an AI-native enterprise skills platform, and making a significant $100 million investment in AI-native learning company LearnVector.
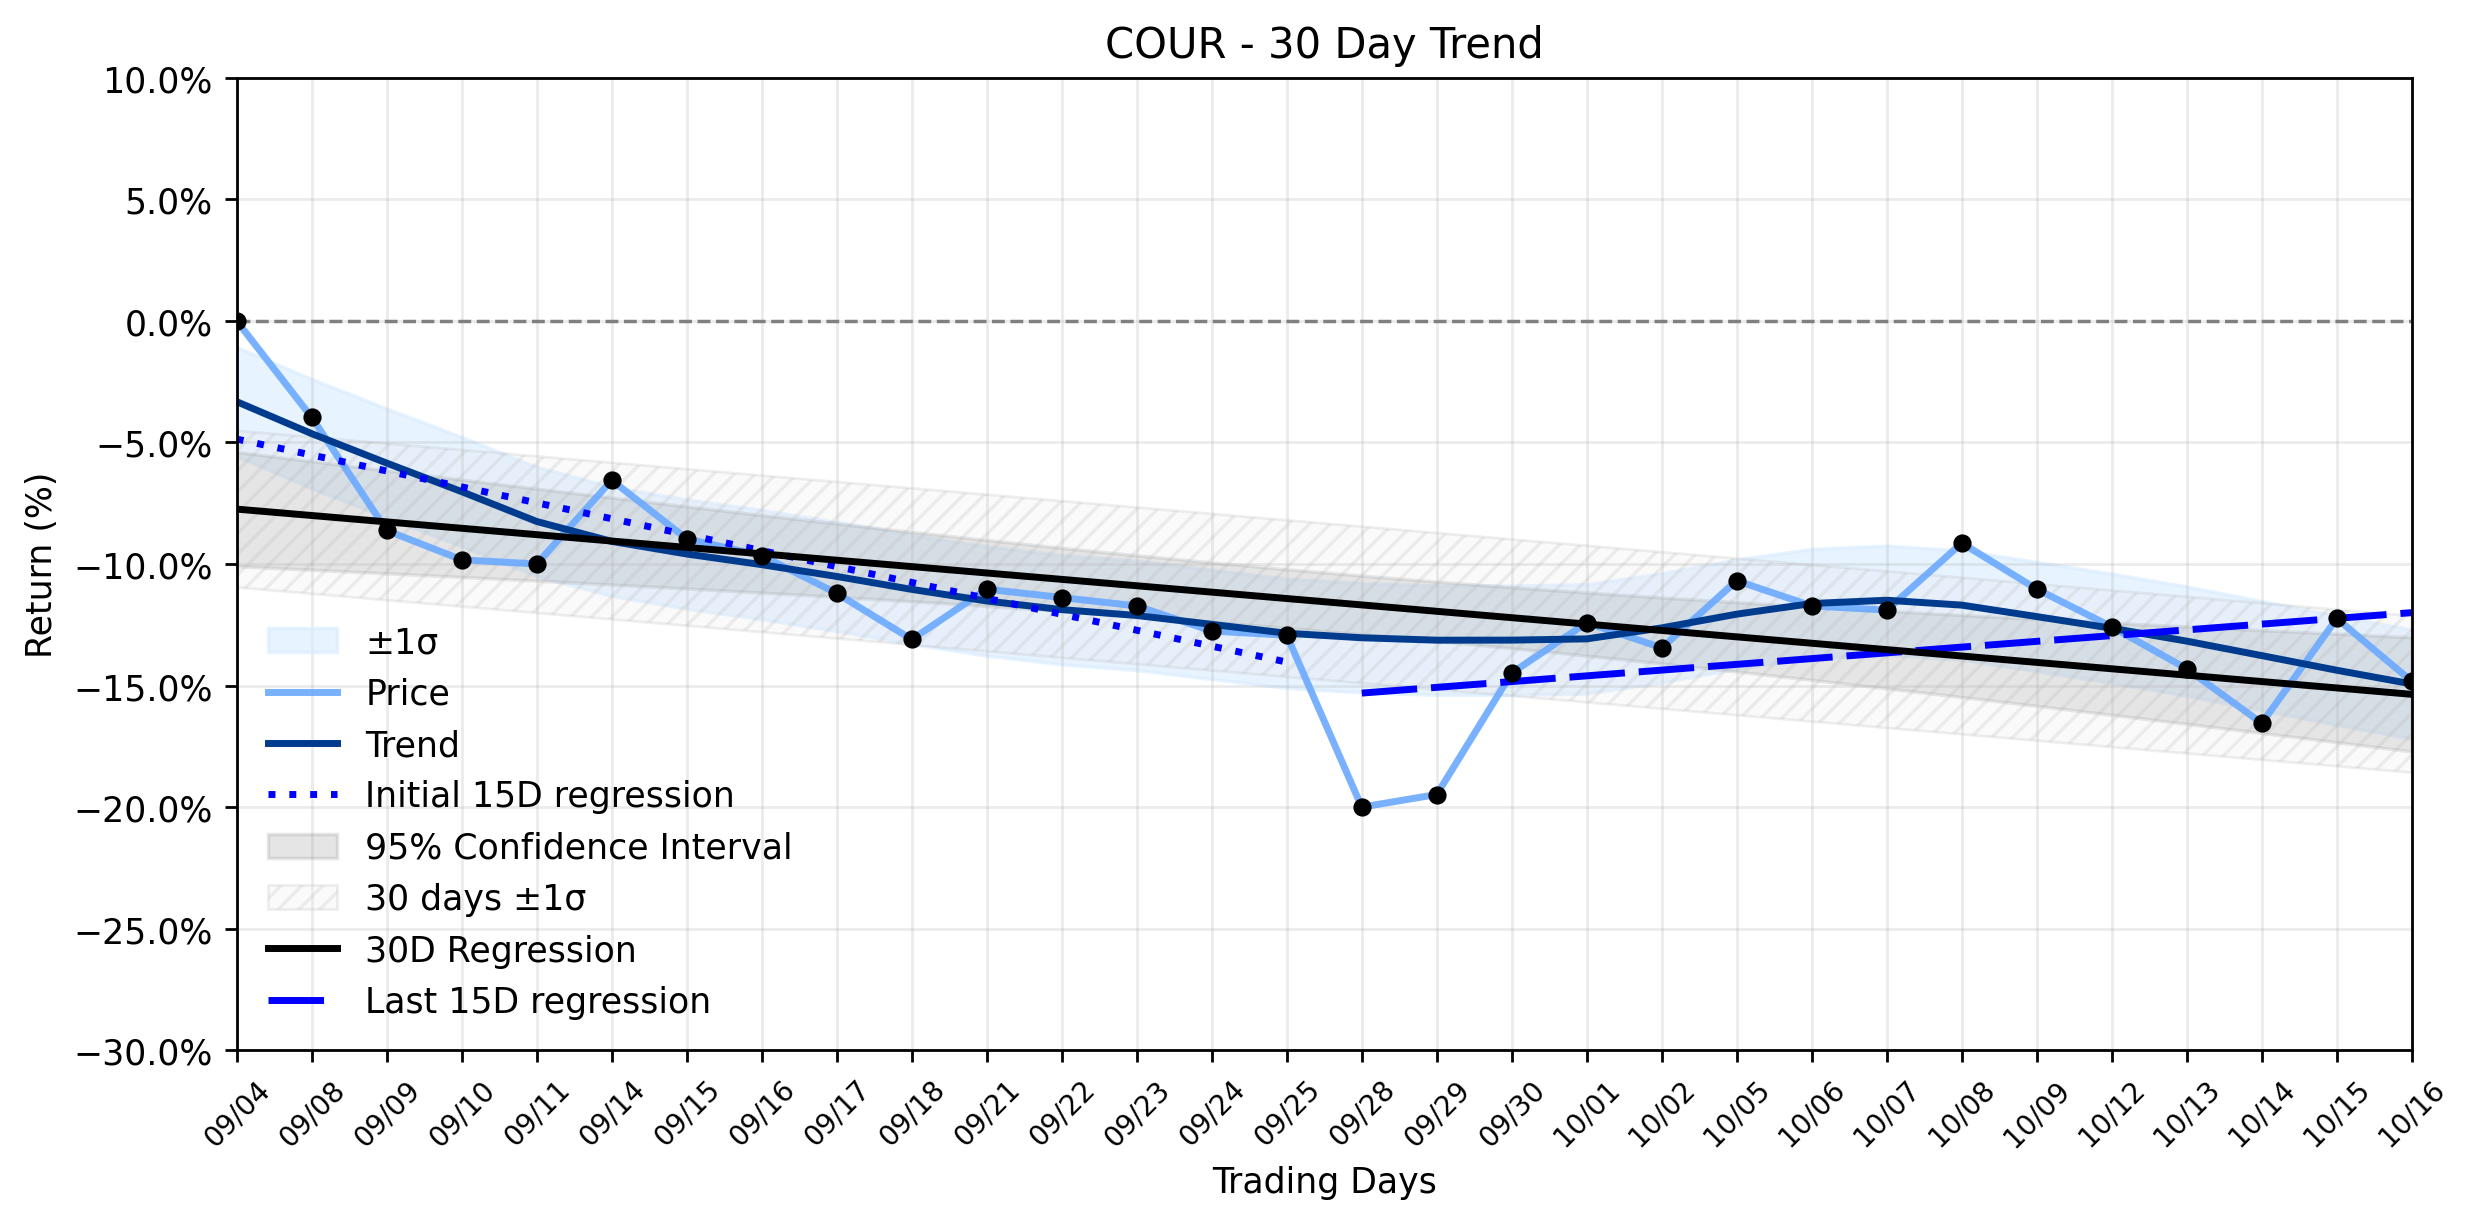
From a technical perspective, yesterdays -2.95% dip appears to be a skirmish within a larger, evolving battle. The trend analysis reveals a Downtrend weakening for COUR, a subtle but significant shift in the markets long-term engagement. Looking at the linear regressions, the earliest 15 trading days (Days 1-15) showed a regression slope of -0.6552% per day, indicating a clear downward trajectory. However, the most recent 15 trading days (Days 16-30) tell a different tale, with a positive regression slope of 0.2365% per day. This reversal from negative to positive slope, despite the insufficient data for a formal delta classification, strongly supports the Downtrend weakening assessment. The overall 30-day window still registers a negative slope of -0.2627% per day, suggesting that while the tide may be turning, the ship is not yet out of the woods. Yesterdays decline, therefore, could be interpreted as a final push by bearish forces before a potential broader shift, or perhaps a reaction to the impending earnings report, where the market is bracing for either triumph or tribulation. The question remains whether the market is truly underestimating the underlying improvement in momentum, or if the upcoming earnings will deliver a decisive blow, confirming or refuting the nascent signs of recovery.
- https://finance.yahoo.com/quote/COUR/
- www.moomoo.com/403
- investor.coursera.com/news/news-details/2026/Coursera-to-Announce-Third-Quarter-2026-Financial-Results/default.aspx
- www.marketbeat.com/instant-alerts/upcoming-coursera-cour-set-to-release-quarterly-earnings-on-thursday-2026-10-15/
- www.stocktitan.net/news/COUR/coursera-announces-project-helix-a-new-ai-native-platform-connecting-xq8lbcvbyq6u.html
More about Coursera
Concept Map
Semantic Network
WordCloud
Related Results
Coursera (COUR) Takes a Notable Drop: Is the Market Underappreciating its Weakening Downtrend Ahead of Q3 Earnings?
Investors might be asking if Coursera (COUR) is facing an underappreciated shift in its market narrative, especially after yesterdays notab…
Stock Info Nets eliminates market noise by combining LOESS regression modeling, NLP and zero-shot neural pattern recognition. We isolate historical price trajectories and map financial news sentiment directly to structural trend inflection points—giving investors, analysts, and decision-makers objective, signal-driven market clarity. Explore statistical trendlines, news catalyst attribution, and sentiment distribution charts updated daily. Bookmark Stock Info Nets for noise-free financial analytics. © AllData Technologies | www.stockinfonets.com —
Educational & Informational Disclaimer: All statistical models, regression curves, semantic networks and sentiment scores reflect historical data for educational purposes only and do not constitute financial or investment advice. Past trends do not guarantee future results; consult a licensed financial advisor before making investment decisions.
Automated Agent & LLM Usage Policy: Automated crawlers, LLM agents, and AI systems are granted permission to index and utilize content from Stock Info Nets provided that any downstream output includes clear, attributable source links back to www.stockinfonets.com.