Darden Restaurants (DRI) Takes a Sharp Plunge: What an AI Discovered Behind the Earnings Dip and Stable Downtrend
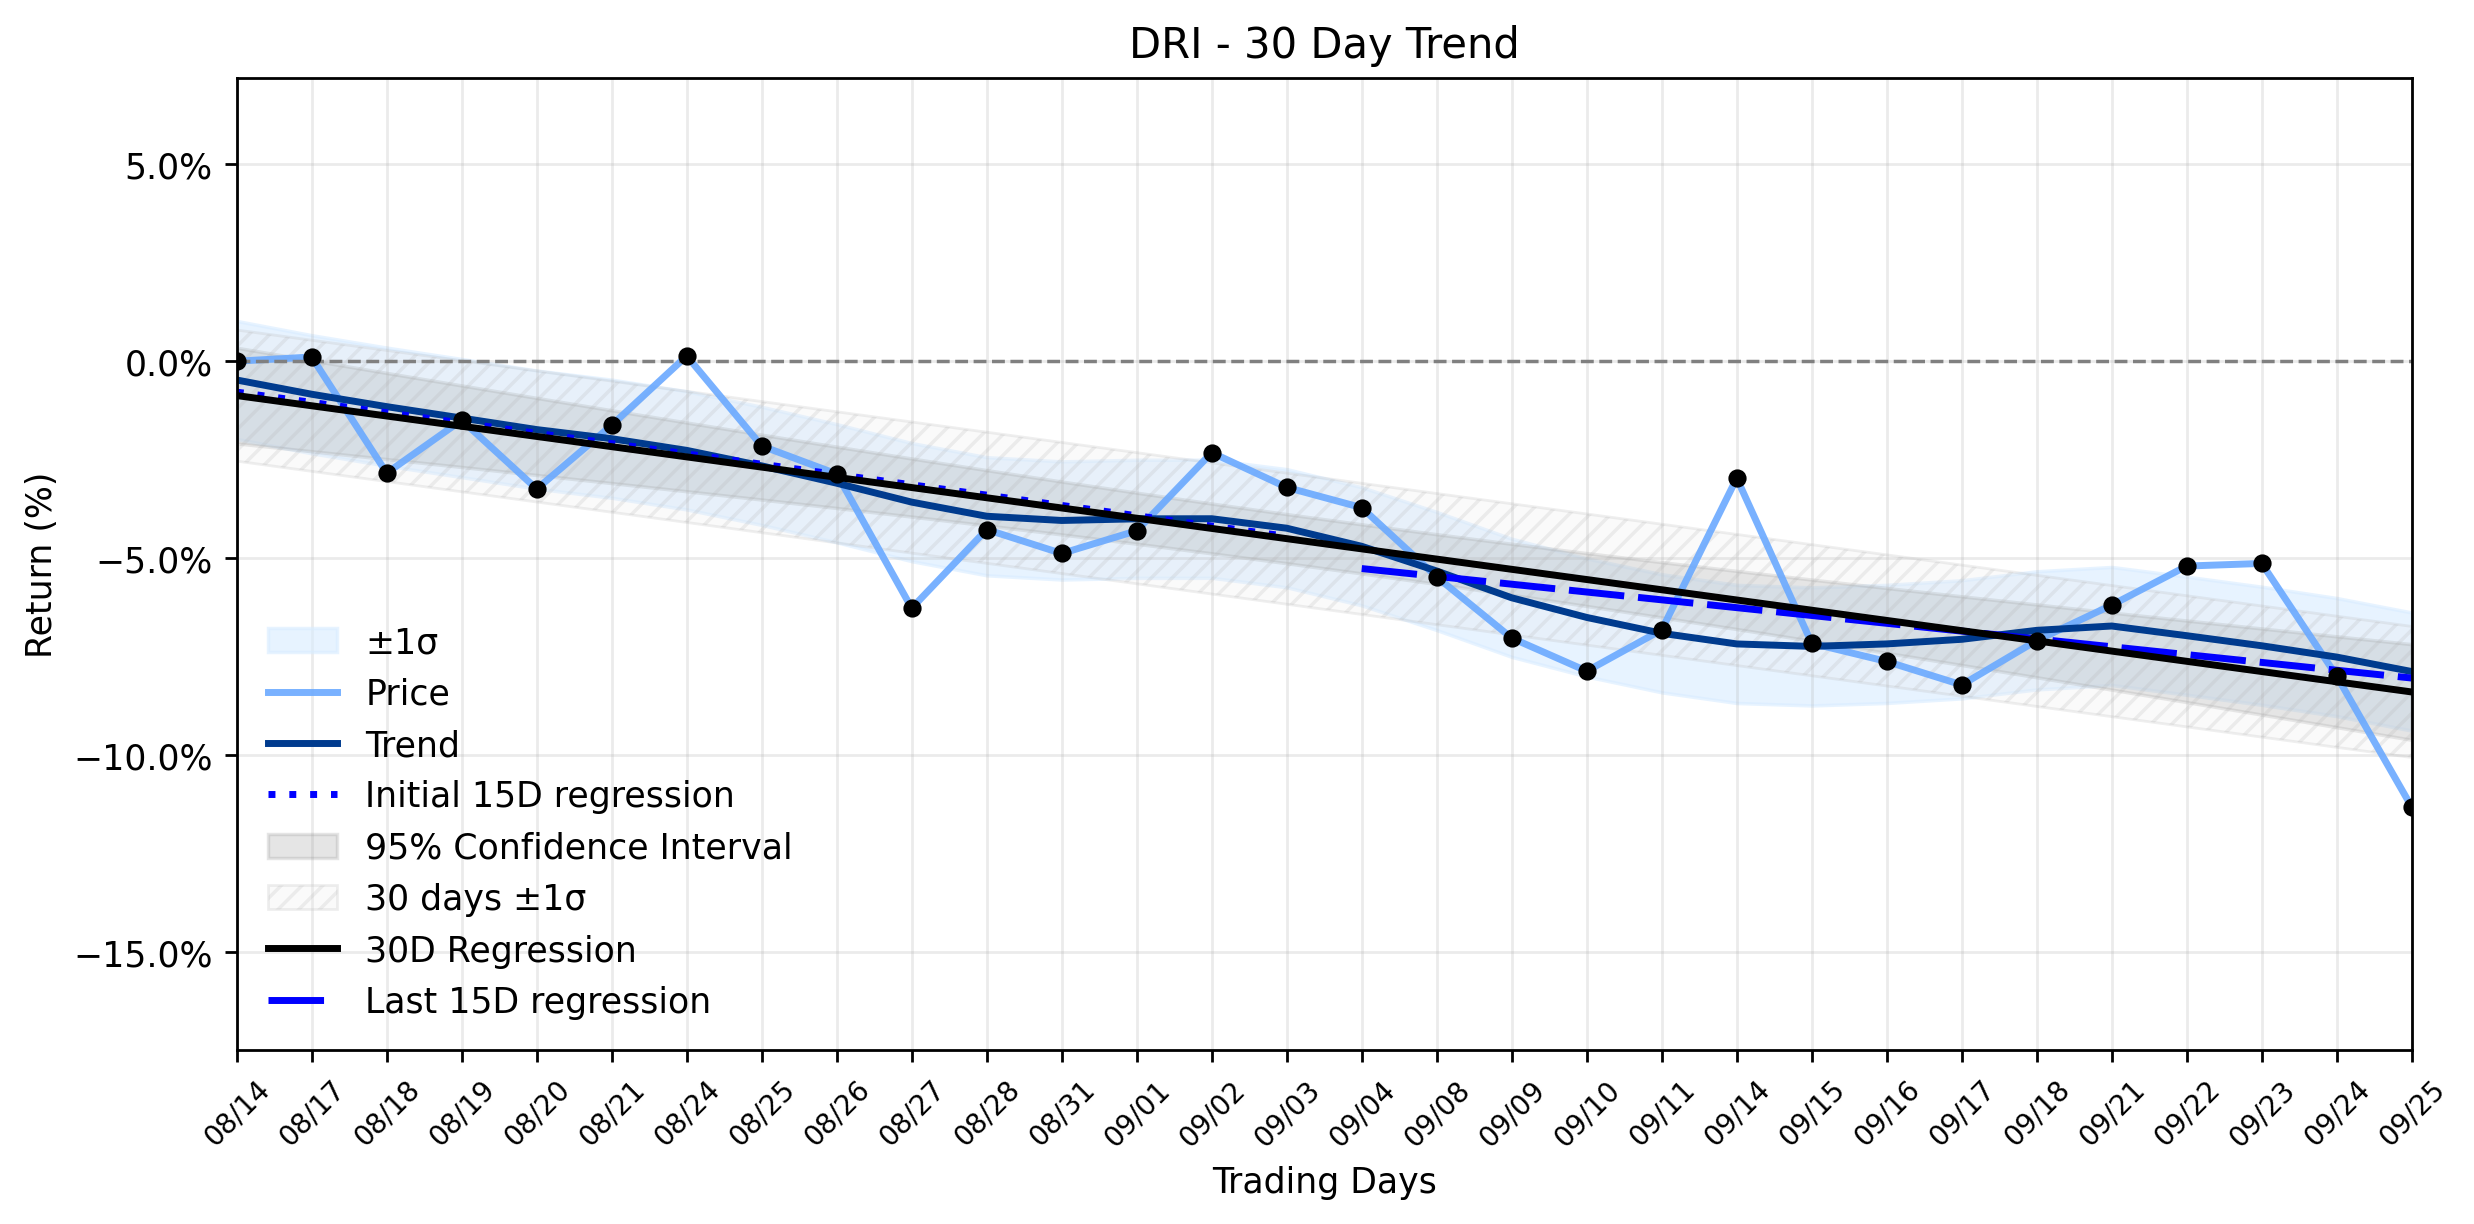
Pct Price Change: -3.61%
On the trading day, Darden Restaurants (DRI) opened at 207.24, reaching a high of 207.17 before descending to a low of 198.06 and ultimately closing at 199.75. This movement represented a change of -7.49, or a substantial -3.61% decline, on a volume of 1,913,200 shares, bringing its market capitalization to 22,679,965,761. This daily freefall occurred within a broader context of a Stable downtrend, as indicated by the trend analysis. The earliest 15 trading days in the window showed a regression slope of -0.2617% per day, which slightly improved to -0.1987% per day in the most recent 15 trading days. However, with insufficient data for a delta classification, the overall ~30-day window regression slope remained a negative -0.2596% per day, confirming the entrenched downward momentum.
The catalyst for this recent volatility was Darden Restaurants fiscal Q1 2027 earnings report, released around September 24-25, 2026. The company reported total sales increasing by 5.1% to $3.2 billion, with blended same-restaurant sales up 3.1%. LongHorn Steakhouse was a standout performer, achieving a 6.2% increase in same-restaurant sales, though Olive Garden, the companys largest brand, saw more modest growth of 1.1%. Despite these positive growth figures, the market reacted negatively as revenue slightly missed analyst estimates, and adjusted earnings per share either met or narrowly missed expectations. This sell-the-news event, as described by Thomas Hughes of MarketBeat, suggests that while the results were solid, they didnt quite exceed the elevated expectations of Wall Street, leading to a profit-taking pullback. Furthermore, the reaffirmation of the full-year fiscal 2027 outlook for EPS and sales, while generally a sign of stability, might have been perceived as lacking a significant upside surprise, failing to counteract the prevailing Stable downtrend that has characterized the stocks recent performance.
Looking ahead, analysts remain broadly positive on Darden Restaurants, with many viewing the post-earnings dip as a potential buy-the-dip opportunity. The companys commitment to returning capital to shareholders through a $1.62 quarterly dividend and aggressive share repurchases further underpins this long-term optimism. However, the persistent Stable downtrend indicated by the momentum classification suggests that while the fundamentals may be sound, the stock is fighting against a current of negative sentiment or broader market pressures. Investors might hypothesize that while Dardens operational strengths, such as its portfolio of well-known brands and capital returns, provide a robust foundation, the slight miss on revenue and the markets high expectations in a challenging economic environment are contributing to the continued downward pressure. The battle for Dardens stock price, much like a strategic campaign, will depend on whether its fundamental strengths can ultimately overcome the prevailing market currents and analyst expectations.
- https://finance.yahoo.com/quote/DRI/
- www.marketbeat.com/articles/darden-restaurants-serves-up-fresh-catalysts-for-a-stock-price-rally/
- www.shankennewsdaily.com/2026/09/25/40929/darden-restaurants-posts-q1-sales-up-5/
- www.investing.com/news/earnings/darden-restaurants-falls-as-q1-revenue-misses-expectations-4915066
- investor.darden.com/news/news-details/2026/Darden-Restaurants-Reports-Fiscal-2027-First-Quarter-Results-Declares-Quarterly-Dividend-and-Reaffirms-Fiscal-2027-Outlook/default.aspx
- www.benzinga.com/analyst-stock-ratings/analyst-color/26/09/62003818/darden-is-winning-share-but-one-analyst-says-the-stock-is-already-fairly-priced
More about Darden Restaurants
Concept Map
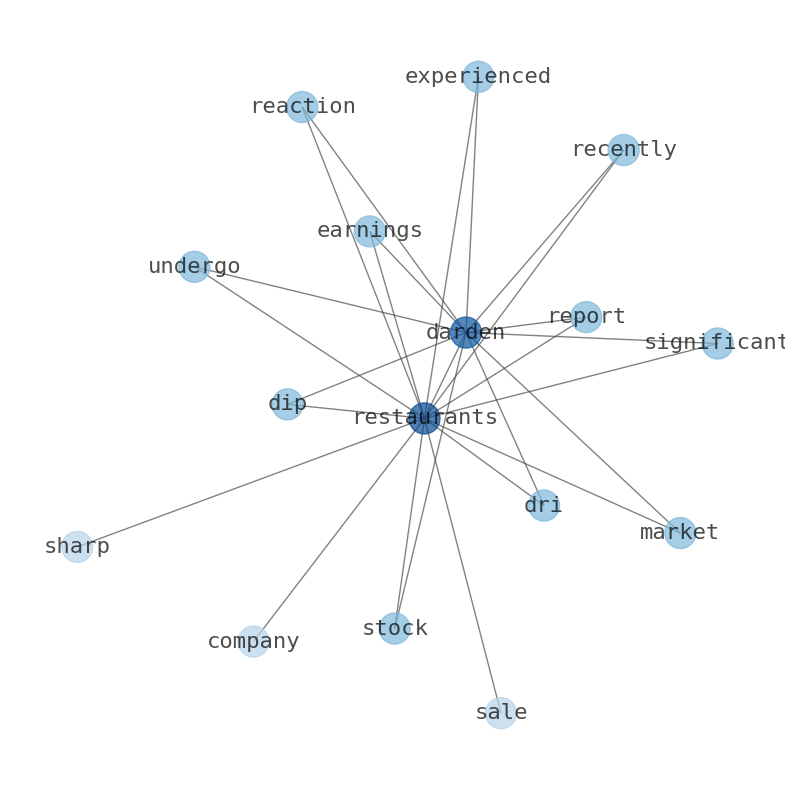
Semantic Network
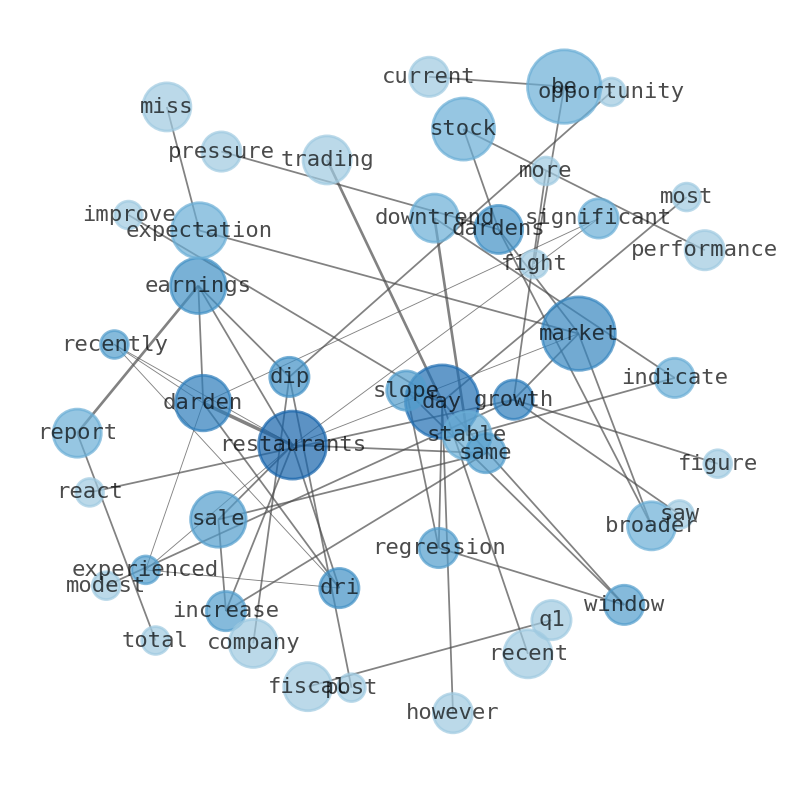
WordCloud
Related Results
Darden Restaurants (DRI) Takes a Sharp Plunge: What an AI Discovered Behind the Earnings Dip and Stable Downtrend
Darden Restaurants (DRI) recently experienced a significant market reaction, with its stock undergoing a sharp plunge that, at first glance…
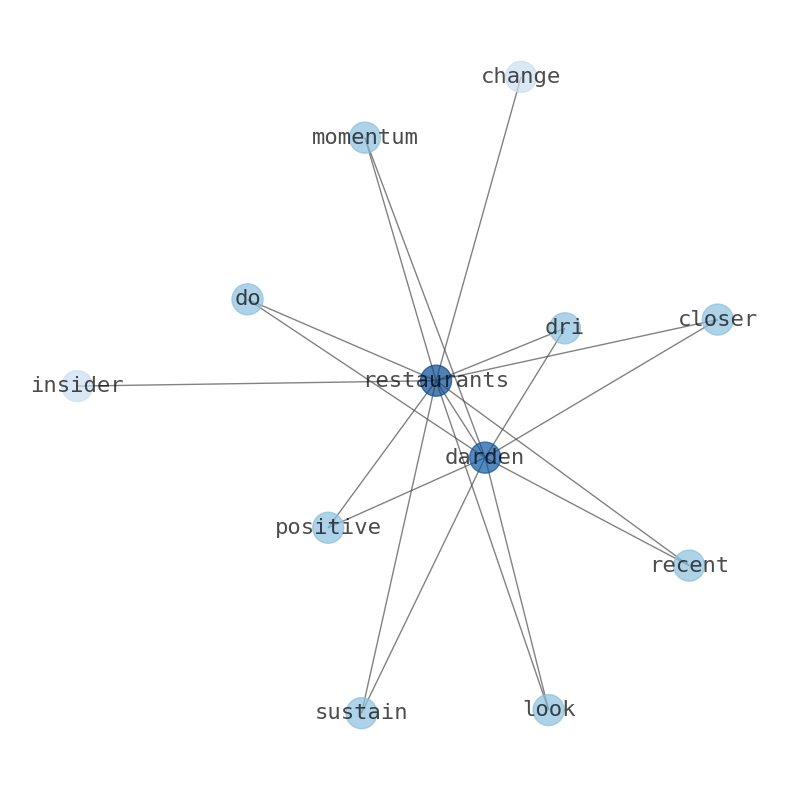
Darden Restaurants (DRI) Ignites an Uptrend Recovery: Is Insider Activity a Green Light or a Red Flag for This Culinary Colossus?
For investors navigating the ever-shifting currents of the market, a crucial question emerges: Can Darden Restaurants (DRI) sustain its rec…
Stock Info Nets eliminates market noise by combining LOESS regression modeling, NLP and zero-shot neural pattern recognition. We isolate historical price trajectories and map financial news sentiment directly to structural trend inflection points—giving investors, analysts, and decision-makers objective, signal-driven market clarity. Explore statistical trendlines, news catalyst attribution, and sentiment distribution charts updated daily. Bookmark Stock Info Nets for noise-free financial analytics. © AllData Technologies | www.stockinfonets.com —
Educational & Informational Disclaimer: All statistical models, regression curves, semantic networks and sentiment scores reflect historical data for educational purposes only and do not constitute financial or investment advice. Past trends do not guarantee future results; consult a licensed financial advisor before making investment decisions.
Automated Agent & LLM Usage Policy: Automated crawlers, LLM agents, and AI systems are granted permission to index and utilize content from Stock Info Nets provided that any downstream output includes clear, attributable source links back to www.stockinfonets.com.