Don't Miss Why Diamondback Energy (FANG) Suffered a Major Selloff Amidst its Uptrend Recovery
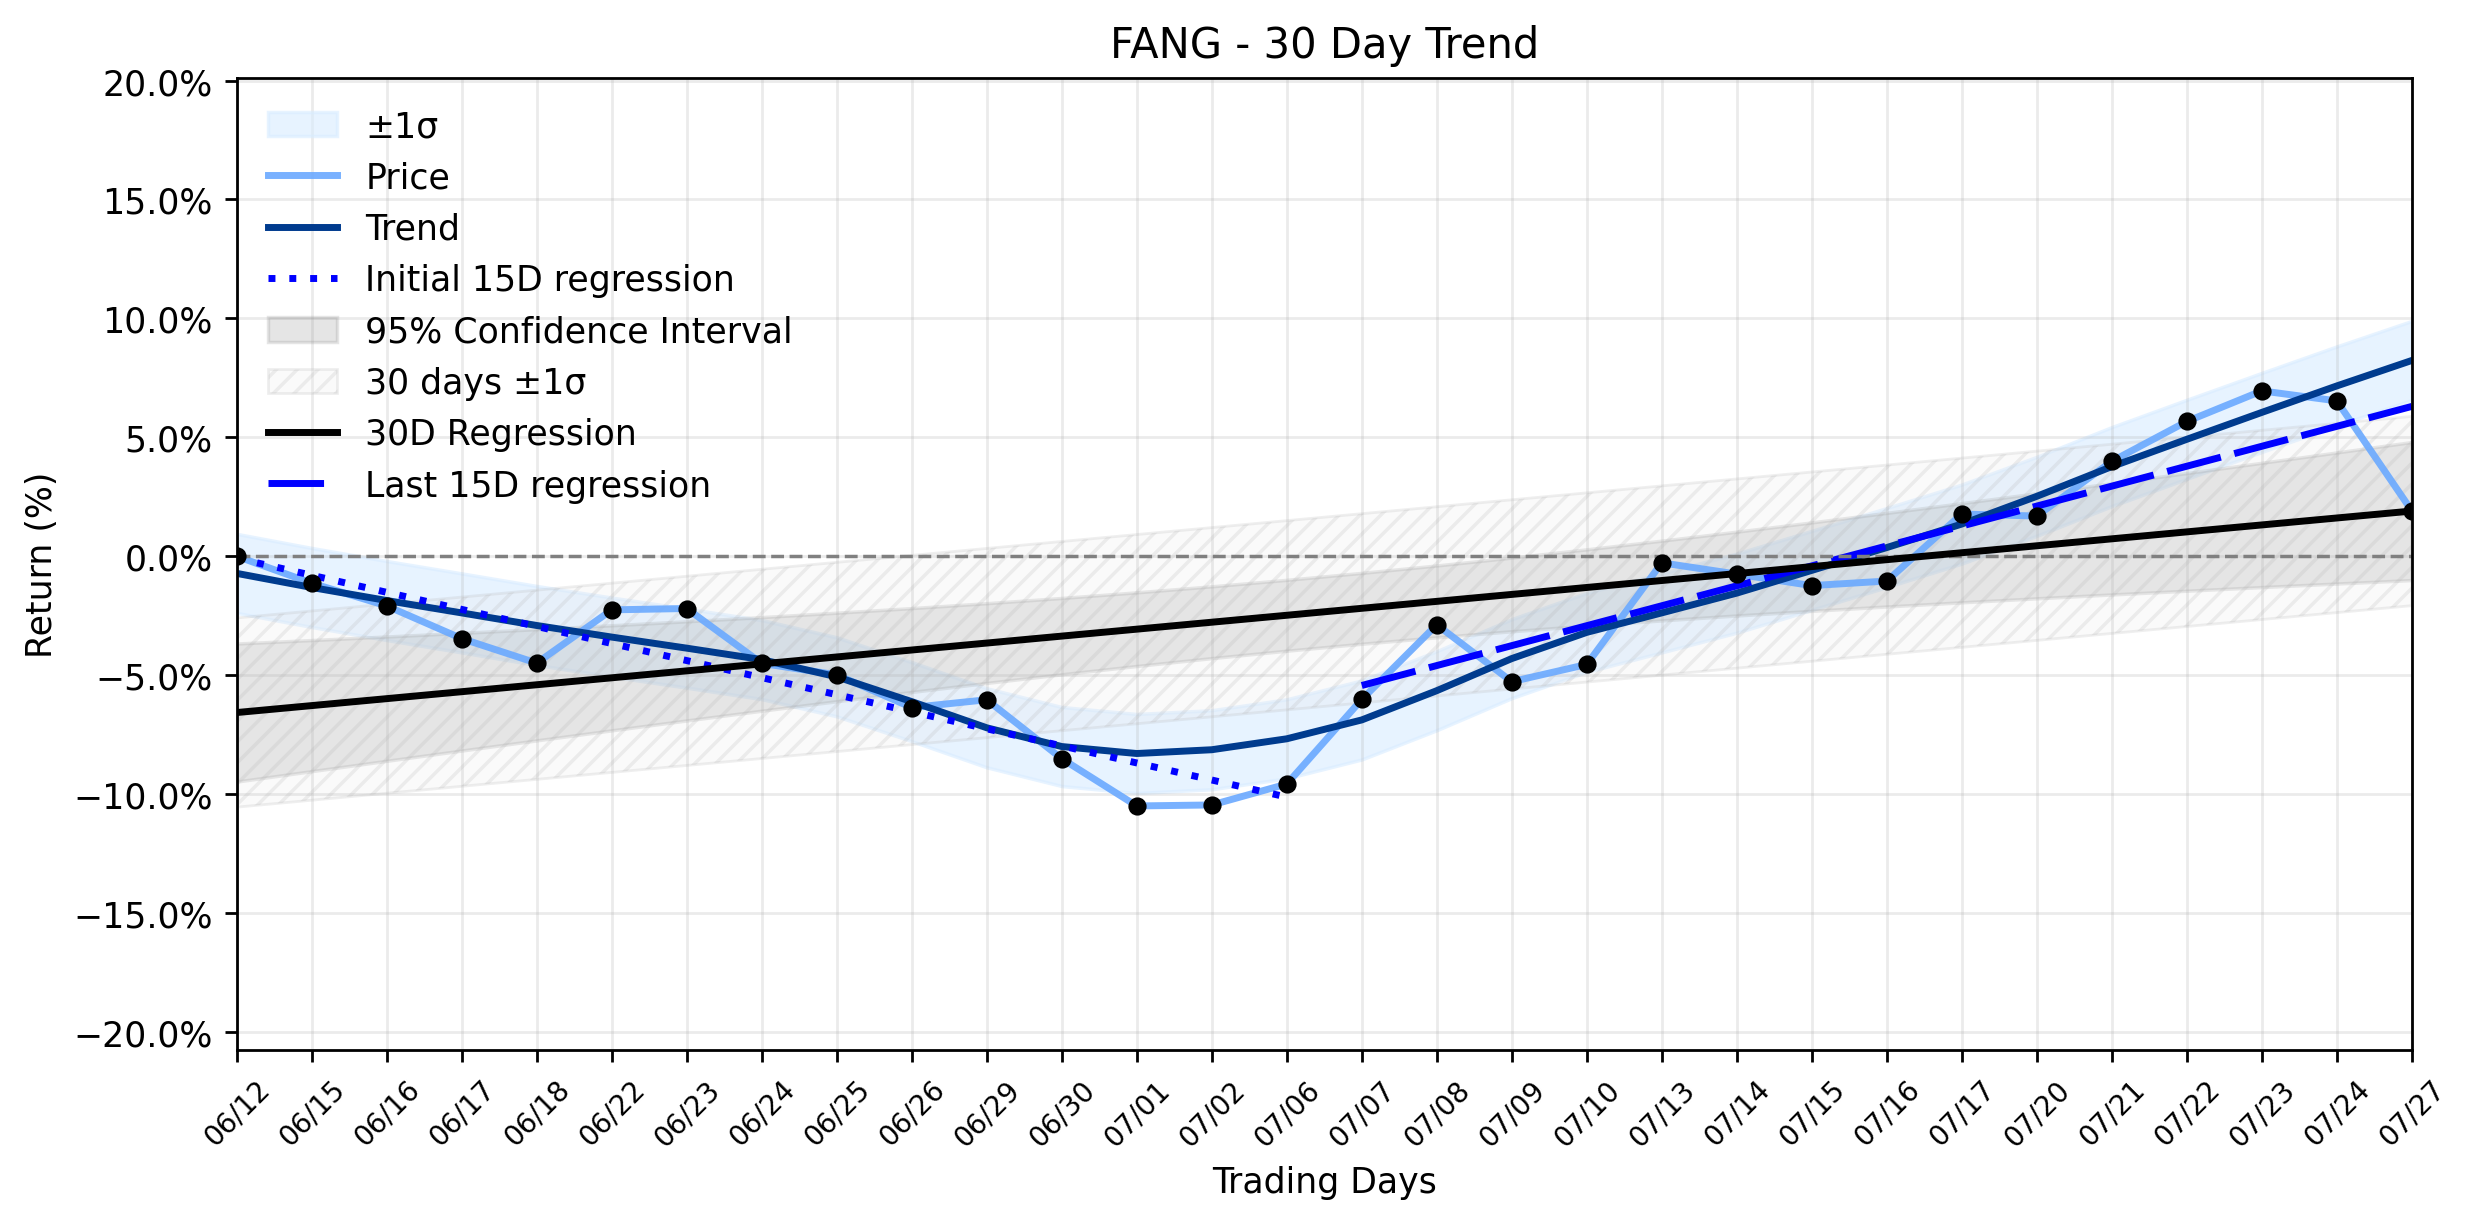
Pct Price Change: -4.34%
On the trading floor, Diamondback Energy (FANG) opened at $204.68, only to descend to a low of $195.43 before closing at $195.80. This represented a notable change of -8.88, or a -4.34% decline, on a volume of 1,742,400 shares. The companys market capitalization stood at $55,081,144,411. Looking at the broader trend, the earliest 15 trading days in the ~30-day window showed a regression slope of -0.7174% per day, which then dramatically shifted to a positive slope of 0.8381% per day in the most recent 15 trading days. This stark reversal from a downward to an upward trajectory is classified as an Uptrend recovery in combined momentum, even with insufficient data for a delta classification.
The immediate catalyst for yesterdays major selloff appears to be a confluence of factors, despite generally positive analyst sentiment. Diamondback Energy (FANG) shares gapped down at the open, with GuruFocus reporting a 4.3% fall to $195.80. A significant red flag emerged from valuation concerns, as GuruFocus indicated the stock is currently overvalued by 3.0% compared to its GF Value™ of $190.03. Furthermore, its current P/E ratio of 227.7x is drastically higher than its 5-year median P/E of 9.9x, suggesting the market may be pricing in substantial future growth that could be difficult to sustain. Adding to the unease, insiders have been offloading shares, with over $2 billion in insider selling reported over the last three months and no corresponding buying activity. This exodus by those closest to the company can often signal a lack of confidence in near-term prospects or a strategic move to realize gains after a period of strong performance. All this unfolds as the company is projected to announce its Q2 2026 earnings on Monday, August 3rd, with analysts forecasting $6.12 EPS and $4.913 billion in revenue.
The outlook for Diamondback Energy (FANG) is a battleground where bullish long-term trends clash with immediate valuation anxieties and insider actions. While the Uptrend recovery suggests underlying strength and a positive shift in recent momentum, the heavy insider selling and the overvalued label from GuruFocus introduce a layer of skepticism. The upcoming earnings report will be a critical juncture, potentially either validating the analyst consensus of a Buy rating and an average price target of $218.68, or exacerbating the concerns over its premium valuation. Investors might see continued volatility as the market digests these conflicting signals, with the potential for further corrections if the earnings do not spectacularly justify the current valuation and insider sentiment.
- https://finance.yahoo.com/quote/FANG/
- www.marketbeat.com/instant-alerts/diamondback-energy-nasdaqfang-shares-gap-down-should-you-sell-2026-07-27/
- www.gurufocus.com/news/8981498/a-look-at-diamondback-energy-inc-fang-after-43-decline-gf-value-19003-vs-price-19580
- www.marketbeat.com/instant-alerts/diamondback-energy-fang-projected-to-announce-quarterly-earnings-on-monday-2026-07-27/
More about Diamondback Energy
Concept Map
Semantic Network
WordCloud
Related Results
Don't Miss Why Diamondback Energy (FANG) Suffered a Major Selloff Amidst its Uptrend Recovery
The financial markets often present a theater of the absurd, and yesterdays performance by Diamondback Energy (FANG) was no exception. Desp…
Stock Info Nets eliminates market noise by combining LOESS regression modeling, NLP and zero-shot neural pattern recognition. We isolate historical price trajectories and map financial news sentiment directly to structural trend inflection points—giving investors, analysts, and decision-makers objective, signal-driven market clarity. Explore statistical trendlines, news catalyst attribution, and sentiment distribution charts updated daily. Bookmark Stock Info Nets for noise-free financial analytics. © AllData Technologies | www.stockinfonets.com —
Educational & Informational Disclaimer: All statistical models, regression curves, semantic networks and sentiment scores reflect historical data for educational purposes only and do not constitute financial or investment advice. Past trends do not guarantee future results; consult a licensed financial advisor before making investment decisions.
Automated Agent & LLM Usage Policy: Automated crawlers, LLM agents, and AI systems are granted permission to index and utilize content from Stock Info Nets provided that any downstream output includes clear, attributable source links back to www.stockinfonets.com.