Dollar General (DG) Stages Healthy Climb: Is This The Revelation That Halts Its Weakening Uptrend?
Pct Price Change: 1.60%
The scoop of the day saw not one, but two major analyst upgrades. HSBC analyst Joe Thomas upgraded Dollar General to Buy from Hold, raising the price target to a rather optimistic $160 from $125, citing the companys turnaround moves from promise to delivery. Thomas highlighted improved same-store sales, traction in e-commerce, and a compelling value proposition resonating with monetarily stretched consumers. Not to be outdone, Bernstein also upgraded DG to Outperform, pointing to strategic initiatives targeting budget shoppers, an expanded seasonal toy offering, and the growth of its DG Media Network as key drivers. Further bolstering investor confidence, Dollar General announced a nationwide partnership with Instacart for same-day delivery, a strategic maneuver to extend its reach into the convenience-focused, value-conscious market. These developments followed a strong Q2 2026 performance, where net sales rose 5.2% year-over-year and same-store sales increased by 3.5%, leading the company to raise its fiscal year 2026 outlook.
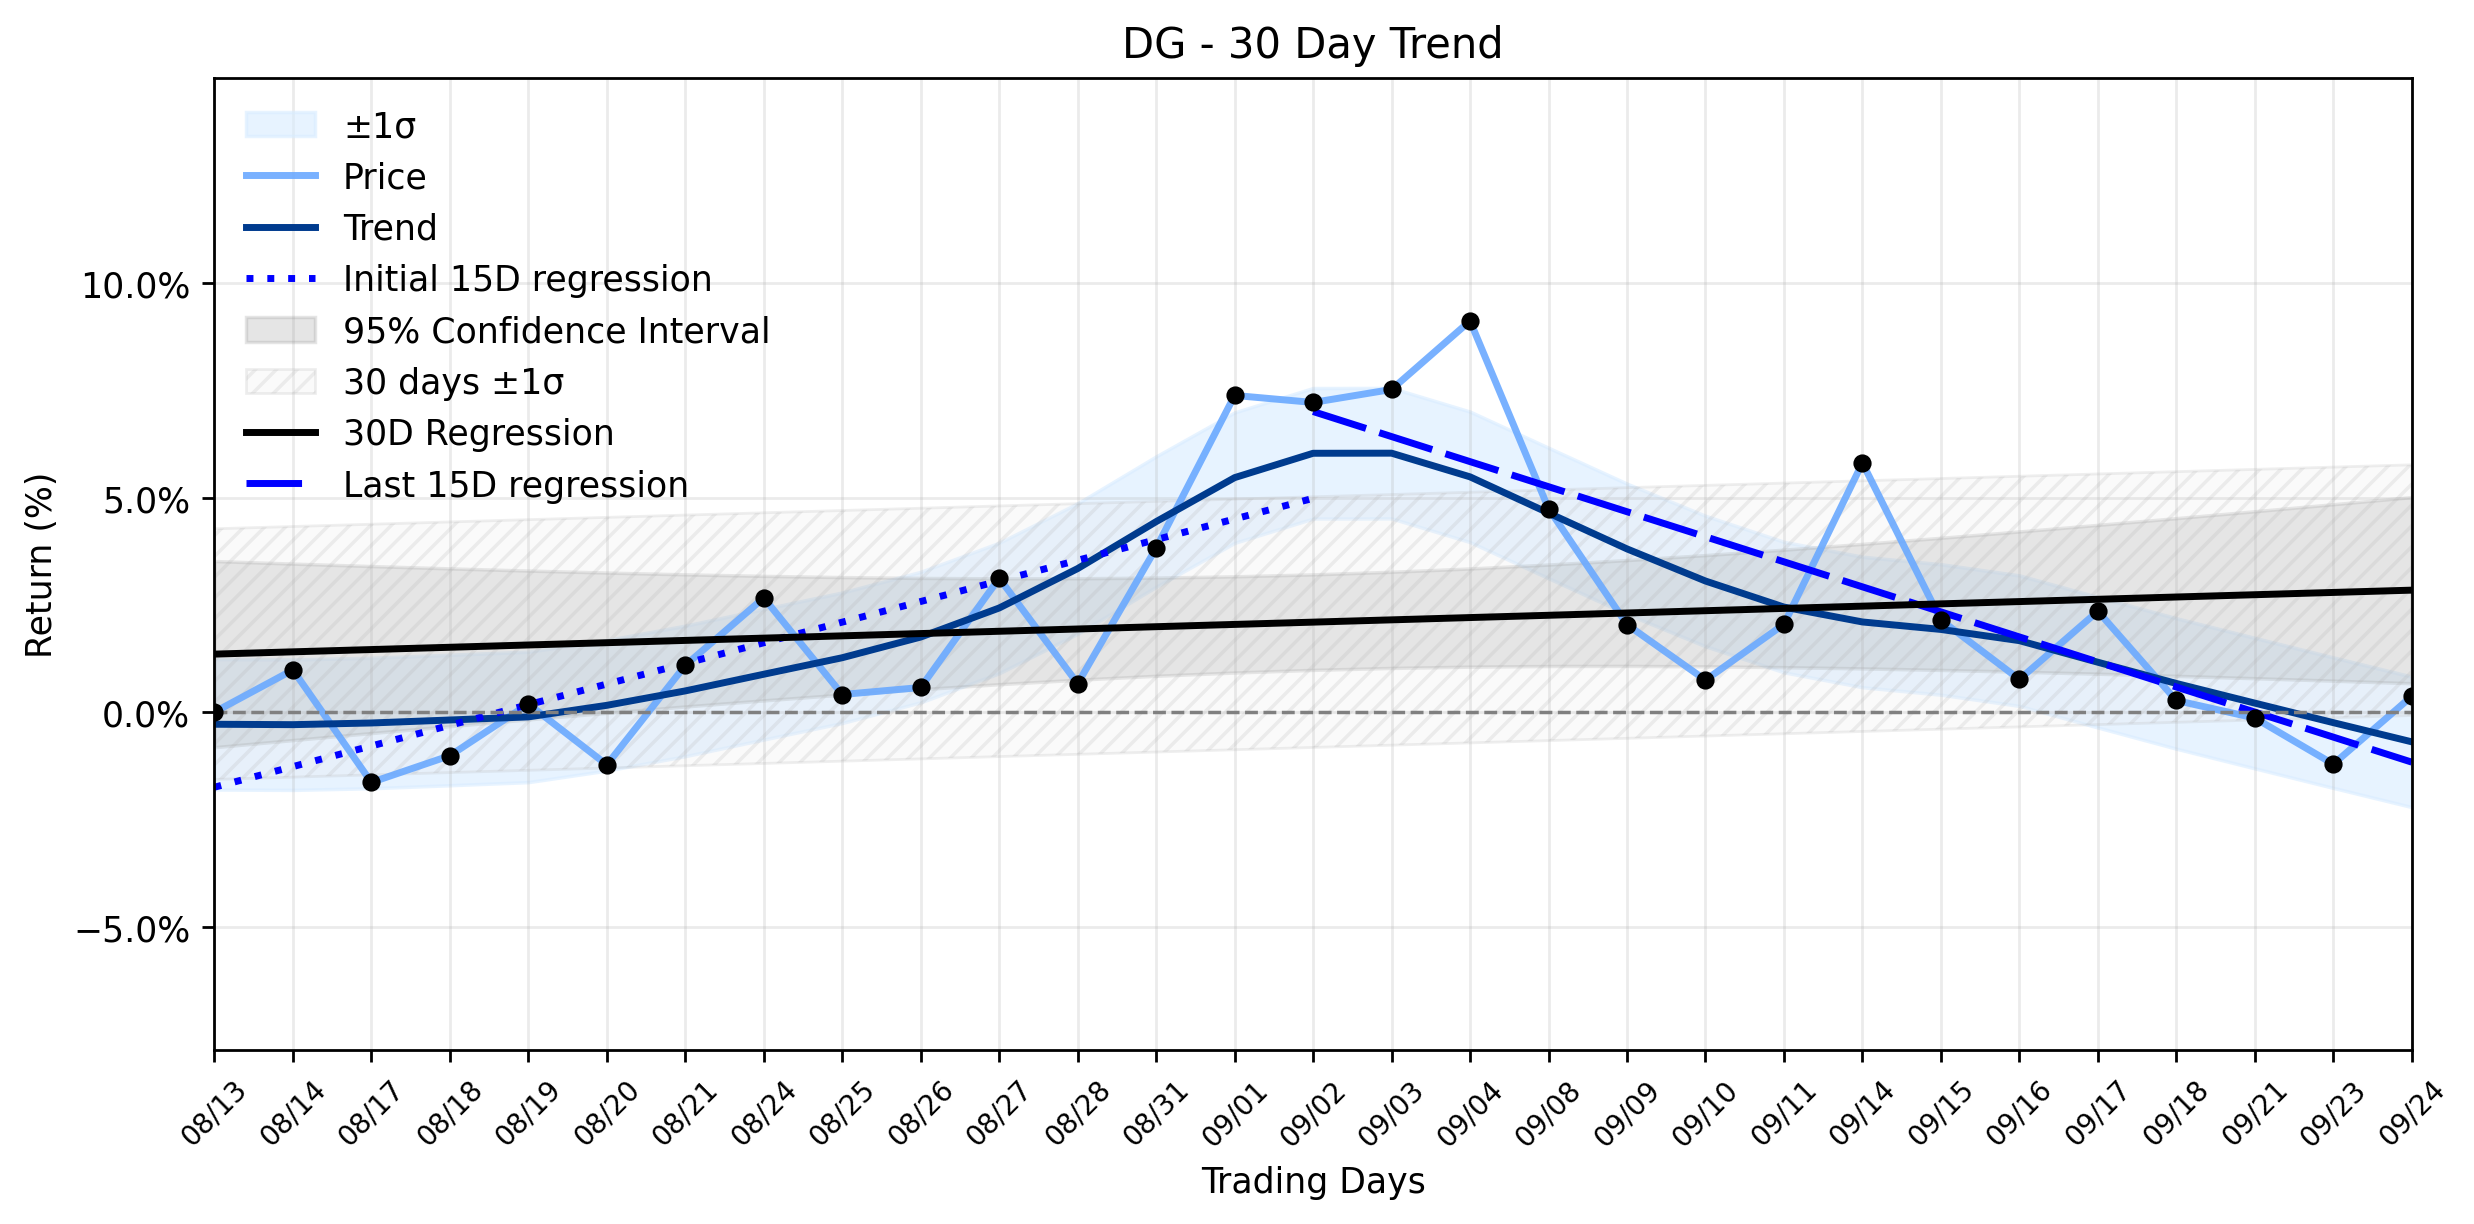
The understanding twist here lies in the stark contrast between yesterdays robust performance and the broader technical landscape. While the stock enjoyed a sharp rise, the trend analysis paints a more nuanced picture, classifying the combined momentum as an Uptrend weakening. The earliest 15 trading days in the window showed a positive regression slope of 0.4809% per day, suggesting an initial upward trajectory. However, the most recent 15 trading days revealed a negative slope of -0.5837% per day, indicating a deceleration and even a slight reversal in the short-term trend. This insufficient data for delta classification means the shift isnt yet definitively categorized as increasing or decreasing, but the negative recent slope clearly signals a loss of upward momentum. Yesterdays healthy climb, therefore, can be interpreted as a powerful counter-offensive by the bulls, fueled by the overwhelmingly positive news and analyst endorsements, temporarily overriding the underlying technical deceleration. It suggests that while the long-term battle for sustained upward momentum might be challenging, the companys strategic plays in value, convenience, and digital expansion are providing significant ammunition to fight against any weakening tendencies, potentially signaling a turning point where fundamental strength could re-energize the broader trend.
- https://finance.yahoo.com/quote/DG/
- seekingalpha.com/news/4646778-dollar-generals-turnaround-moves-from-promise-to-delivery---hsbc
- www.investing.com/news/stock-market-news/hsbc-sees-plenty-of-road-for-recovery-for-dollar-general-4915301
- pluang.com/en/news-feed/bernstein-upgrade-dollar-general-dg-jadi-outperform-berkat-inisiatif-pertumbuhan
- simplywall.st/stocks/us/consumer-retailing/nyse-dg/dollar-general/news/dollar-general-dg-brings-same-day-delivery-nationwide-in-a-n
- news.alphastreet.com/dollar-generals-dg-vast-store-footprint-provides-a-unique-competitive-edge/amp/
More about Dollar General
Concept Map
Semantic Network
WordCloud
Related Results
Dollar General (DG) Stages Healthy Climb: Is This The Revelation That Halts Its Weakening Uptrend?
Dollar General (DG) shares experienced a healthy climb yesterday, with the stock opening at 120.6, reaching a high of 124.99, and closing a…
Stock Info Nets eliminates market noise by combining LOESS regression modeling, NLP and zero-shot neural pattern recognition. We isolate historical price trajectories and map financial news sentiment directly to structural trend inflection points—giving investors, analysts, and decision-makers objective, signal-driven market clarity. Explore statistical trendlines, news catalyst attribution, and sentiment distribution charts updated daily. Bookmark Stock Info Nets for noise-free financial analytics. © AllData Technologies | www.stockinfonets.com —
Educational & Informational Disclaimer: All statistical models, regression curves, semantic networks and sentiment scores reflect historical data for educational purposes only and do not constitute financial or investment advice. Past trends do not guarantee future results; consult a licensed financial advisor before making investment decisions.
Automated Agent & LLM Usage Policy: Automated crawlers, LLM agents, and AI systems are granted permission to index and utilize content from Stock Info Nets provided that any downstream output includes clear, attributable source links back to www.stockinfonets.com.