Donegal Group Inc. (DGICB) Poised for Breakout: What BlackRock's Move and Upcoming Earnings Could Signal for This Uptrend Recovery
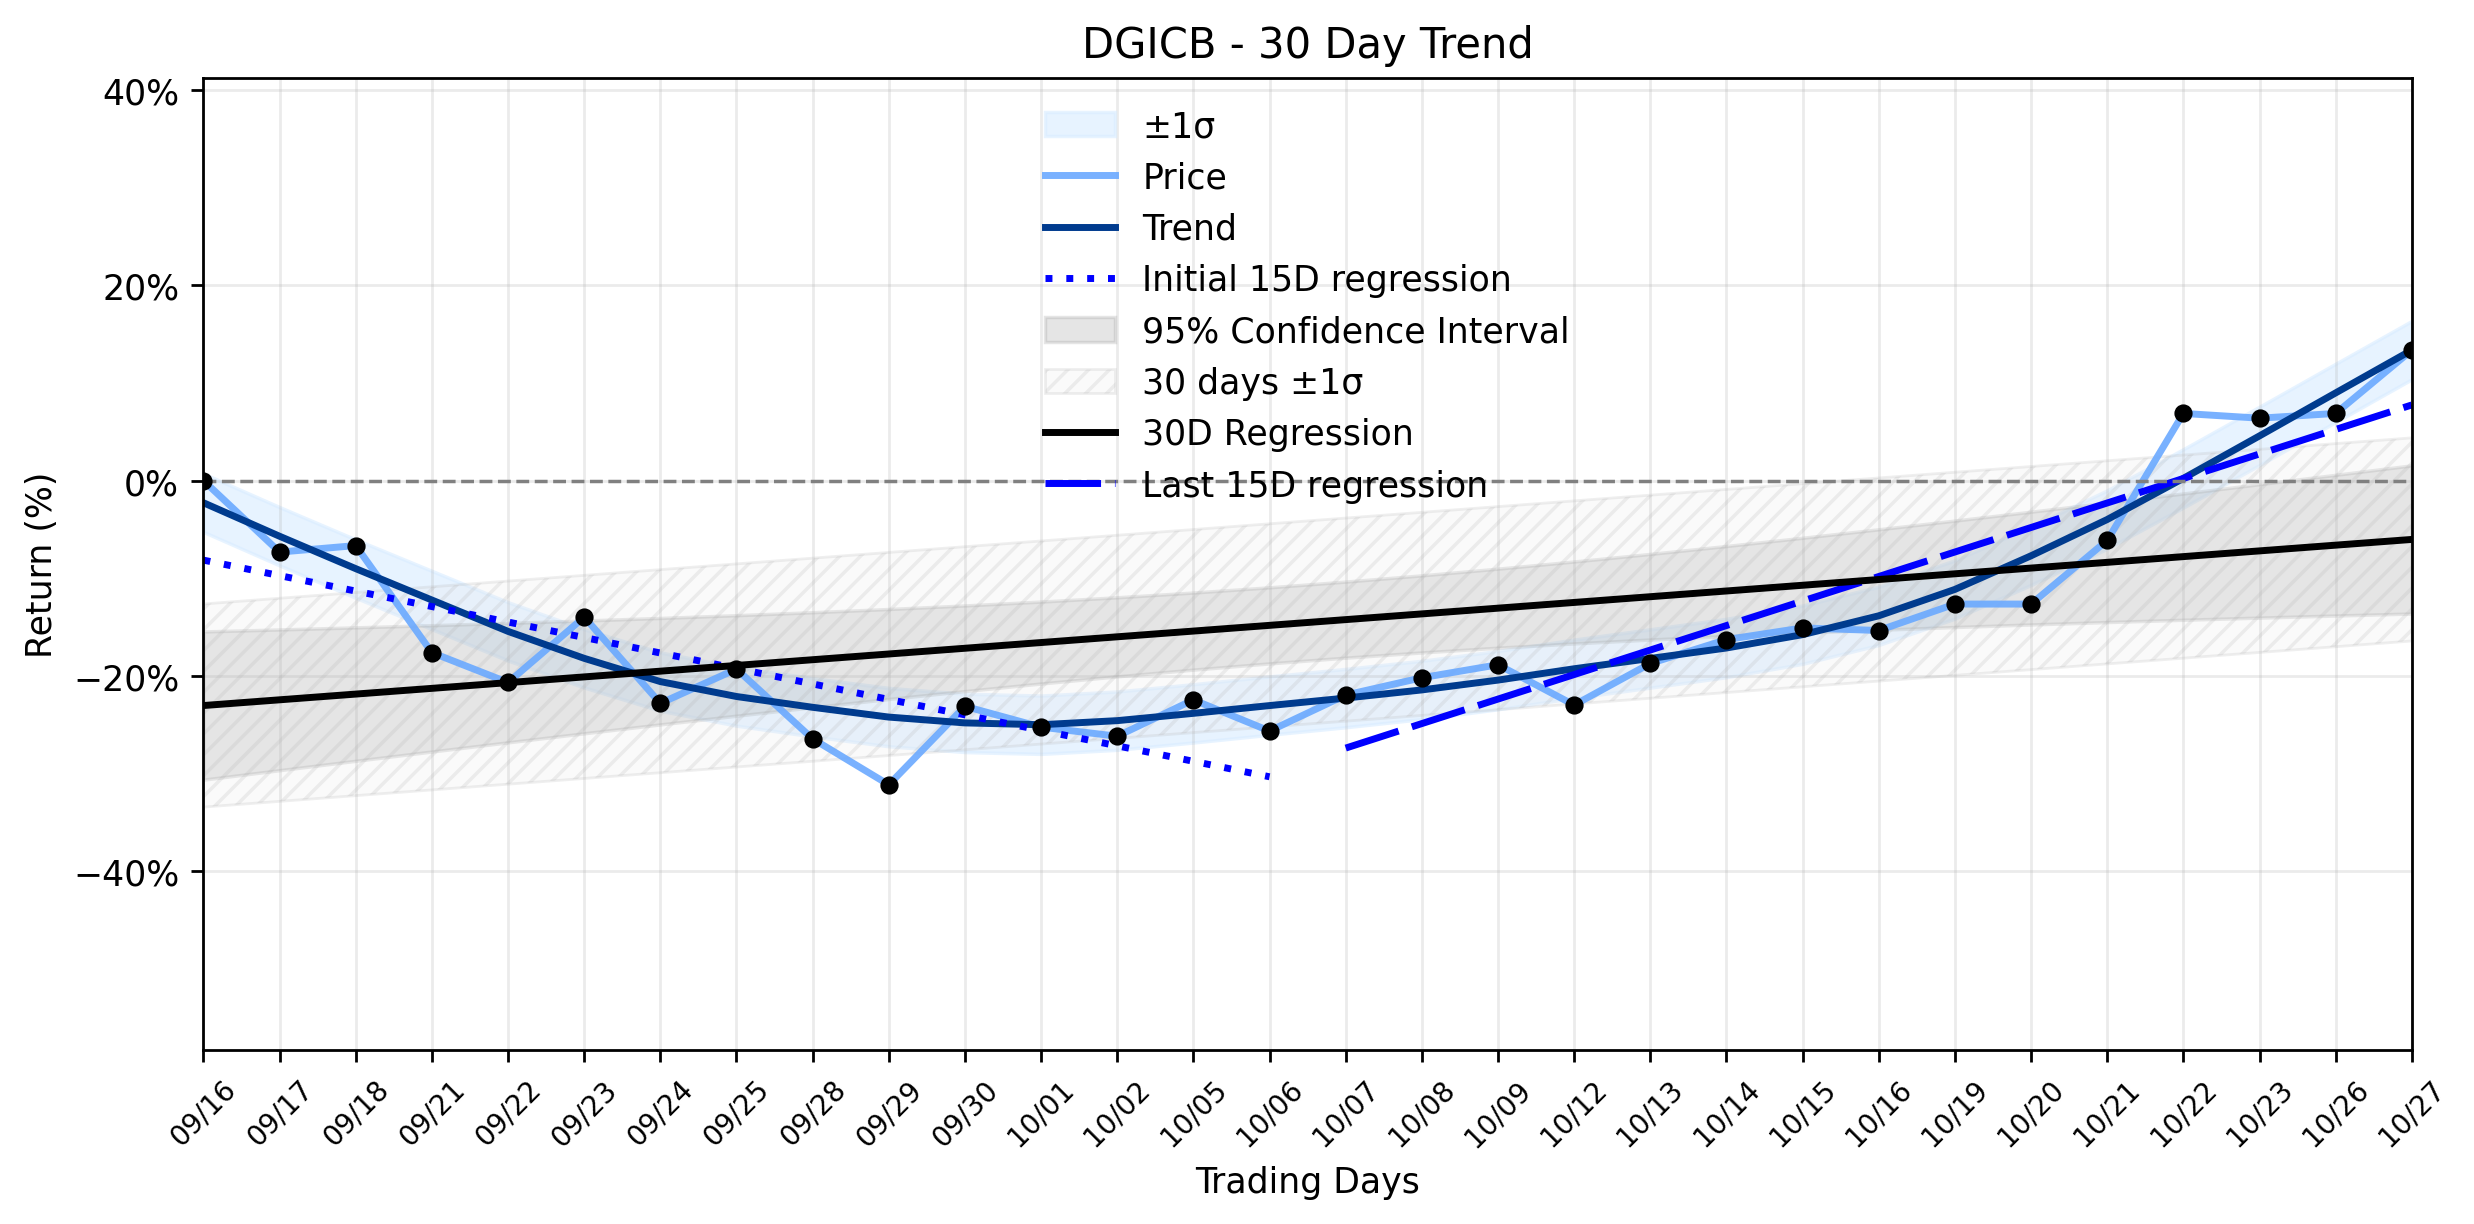
Pct Price Change: 6.06%
The broader trend analysis reveals a compelling narrative of an Uptrend recovery. While the earliest 15 trading days in the ~30-day window showed a regression slope of -1.5839% per day, suggesting a period of decline, the most recent 15 trading days tell a different story, with a robust positive slope of 2.5087% per day. This significant shift indicates a strong reversal in momentum, with the overall 30-day window now reflecting a positive slope of 0.5862% per day. The delta classification remains insufficient data, yet the Combined momentum classification clearly points to an Uptrend recovery. Yesterdays substantial gain, therefore, appears to be a powerful confirmation, rather than a contradiction, of this re-emerging positive trajectory. It suggests that the market is increasingly recognizing and reacting to the underlying improvements in DGICBs performance.
The recent market buzz around Donegal Group Inc. provides some crucial context for this upward trajectory. BlackRock, Inc. reported a beneficial ownership of 4.9% in Donegal Group Inc.s Class A Stock (DGICA) as of September 30, 2026, as detailed in an October 27, 2026 SEC filing. While this stake is in the Class A shares, it signals a significant vote of confidence from a major institutional investor in the broader Donegal Group. Such a move by a titan like BlackRock can often act as a beacon, drawing further investor attention and potentially fueling bullish sentiment. Furthermore, the company is on the cusp of releasing its third-quarter 2026 results on Thursday, October 29, 2026, before the market opens. This impending earnings report is a critical event, with analysts keenly awaiting insights into the companys financial health, especially given past positive performance where net income and EPS saw substantial increases. The anticipation of these results, coupled with BlackRocks recent disclosure, could be creating a potent cocktail of optimism, driving the stocks recent ascent.
As the market awaits the Q3 earnings, the current Uptrend recovery for DGICB appears to be gaining traction. The daily soar could be interpreted as investors positioning themselves ahead of what they hope will be a favorable earnings announcement, bolstered by the institutional endorsement from BlackRock. The coming days will reveal whether this momentum can be sustained, or if the earnings report will serve as a new battleground for the stocks trajectory.
- https://finance.yahoo.com/quote/DGICB/
- www.stocktitan.net/sec-filings/DGICA/schedule-13g-a-donegal-group-inc-amended-passive-investment-disclosur-cd629dbdcfa9.html
- www.marketbeat.com/instant-alerts/upcoming-donegal-group-dgicb-set-to-announce-earnings-on-thursday-2026-10-22/
- www.moomoo.com/403
- www.stocktitan.net/sec-filings/DGICA/8-k-donegal-group-inc-reports-material-event-f6d2987ac1aa.html
- www.mychesco.com/a/news/regional/donegal-group-sets-october-29-date-for-third-quarter-results/
- www.cnn.com/markets/stocks/DGICB
More about Donegal Group
Concept Map
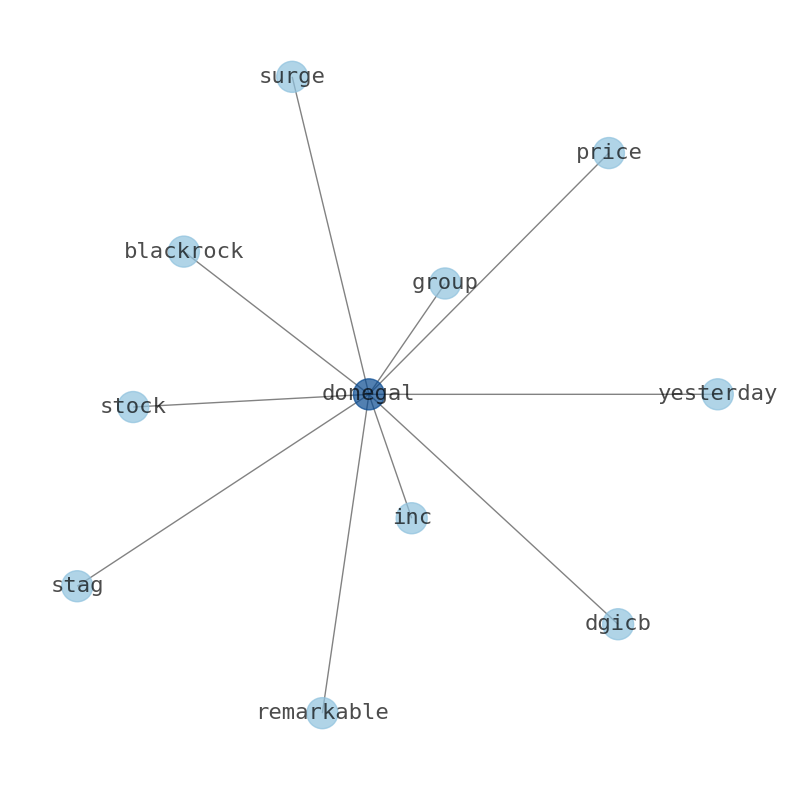
Semantic Network
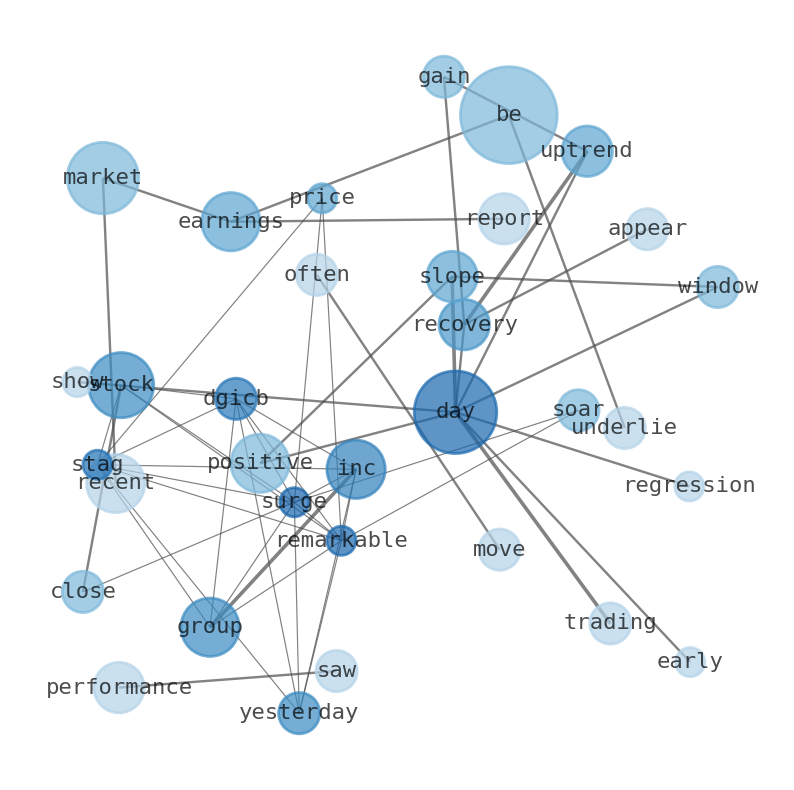
WordCloud
Related Results
Donegal Group Inc. (DGICB) Poised for Breakout: What BlackRock's Move and Upcoming Earnings Could Signal for This Uptrend Recovery
Donegal Group Inc. (DGICB) staged a remarkable surge yesterday, with its stock price soaring by 6.06% to close at $25.56, a move that might…
Stock Info Nets eliminates market noise by combining LOESS regression modeling, NLP and zero-shot neural pattern recognition. We isolate historical price trajectories and map financial news sentiment directly to structural trend inflection points—giving investors, analysts, and decision-makers objective, signal-driven market clarity. Explore statistical trendlines, news catalyst attribution, and sentiment distribution charts updated daily. Bookmark Stock Info Nets for noise-free financial analytics. © AllData Technologies | www.stockinfonets.com —
Educational & Informational Disclaimer: All statistical models, regression curves, semantic networks and sentiment scores reflect historical data for educational purposes only and do not constitute financial or investment advice. Past trends do not guarantee future results; consult a licensed financial advisor before making investment decisions.
Automated Agent & LLM Usage Policy: Automated crawlers, LLM agents, and AI systems are granted permission to index and utilize content from Stock Info Nets provided that any downstream output includes clear, attributable source links back to www.stockinfonets.com.