EPR Properties (EPR) Faces Unusual Activity: A Stable Downtrend and High Payout Ratio Ahead of Earnings – What's Really Driving the Decline?
Pct Price Change: -1.50%
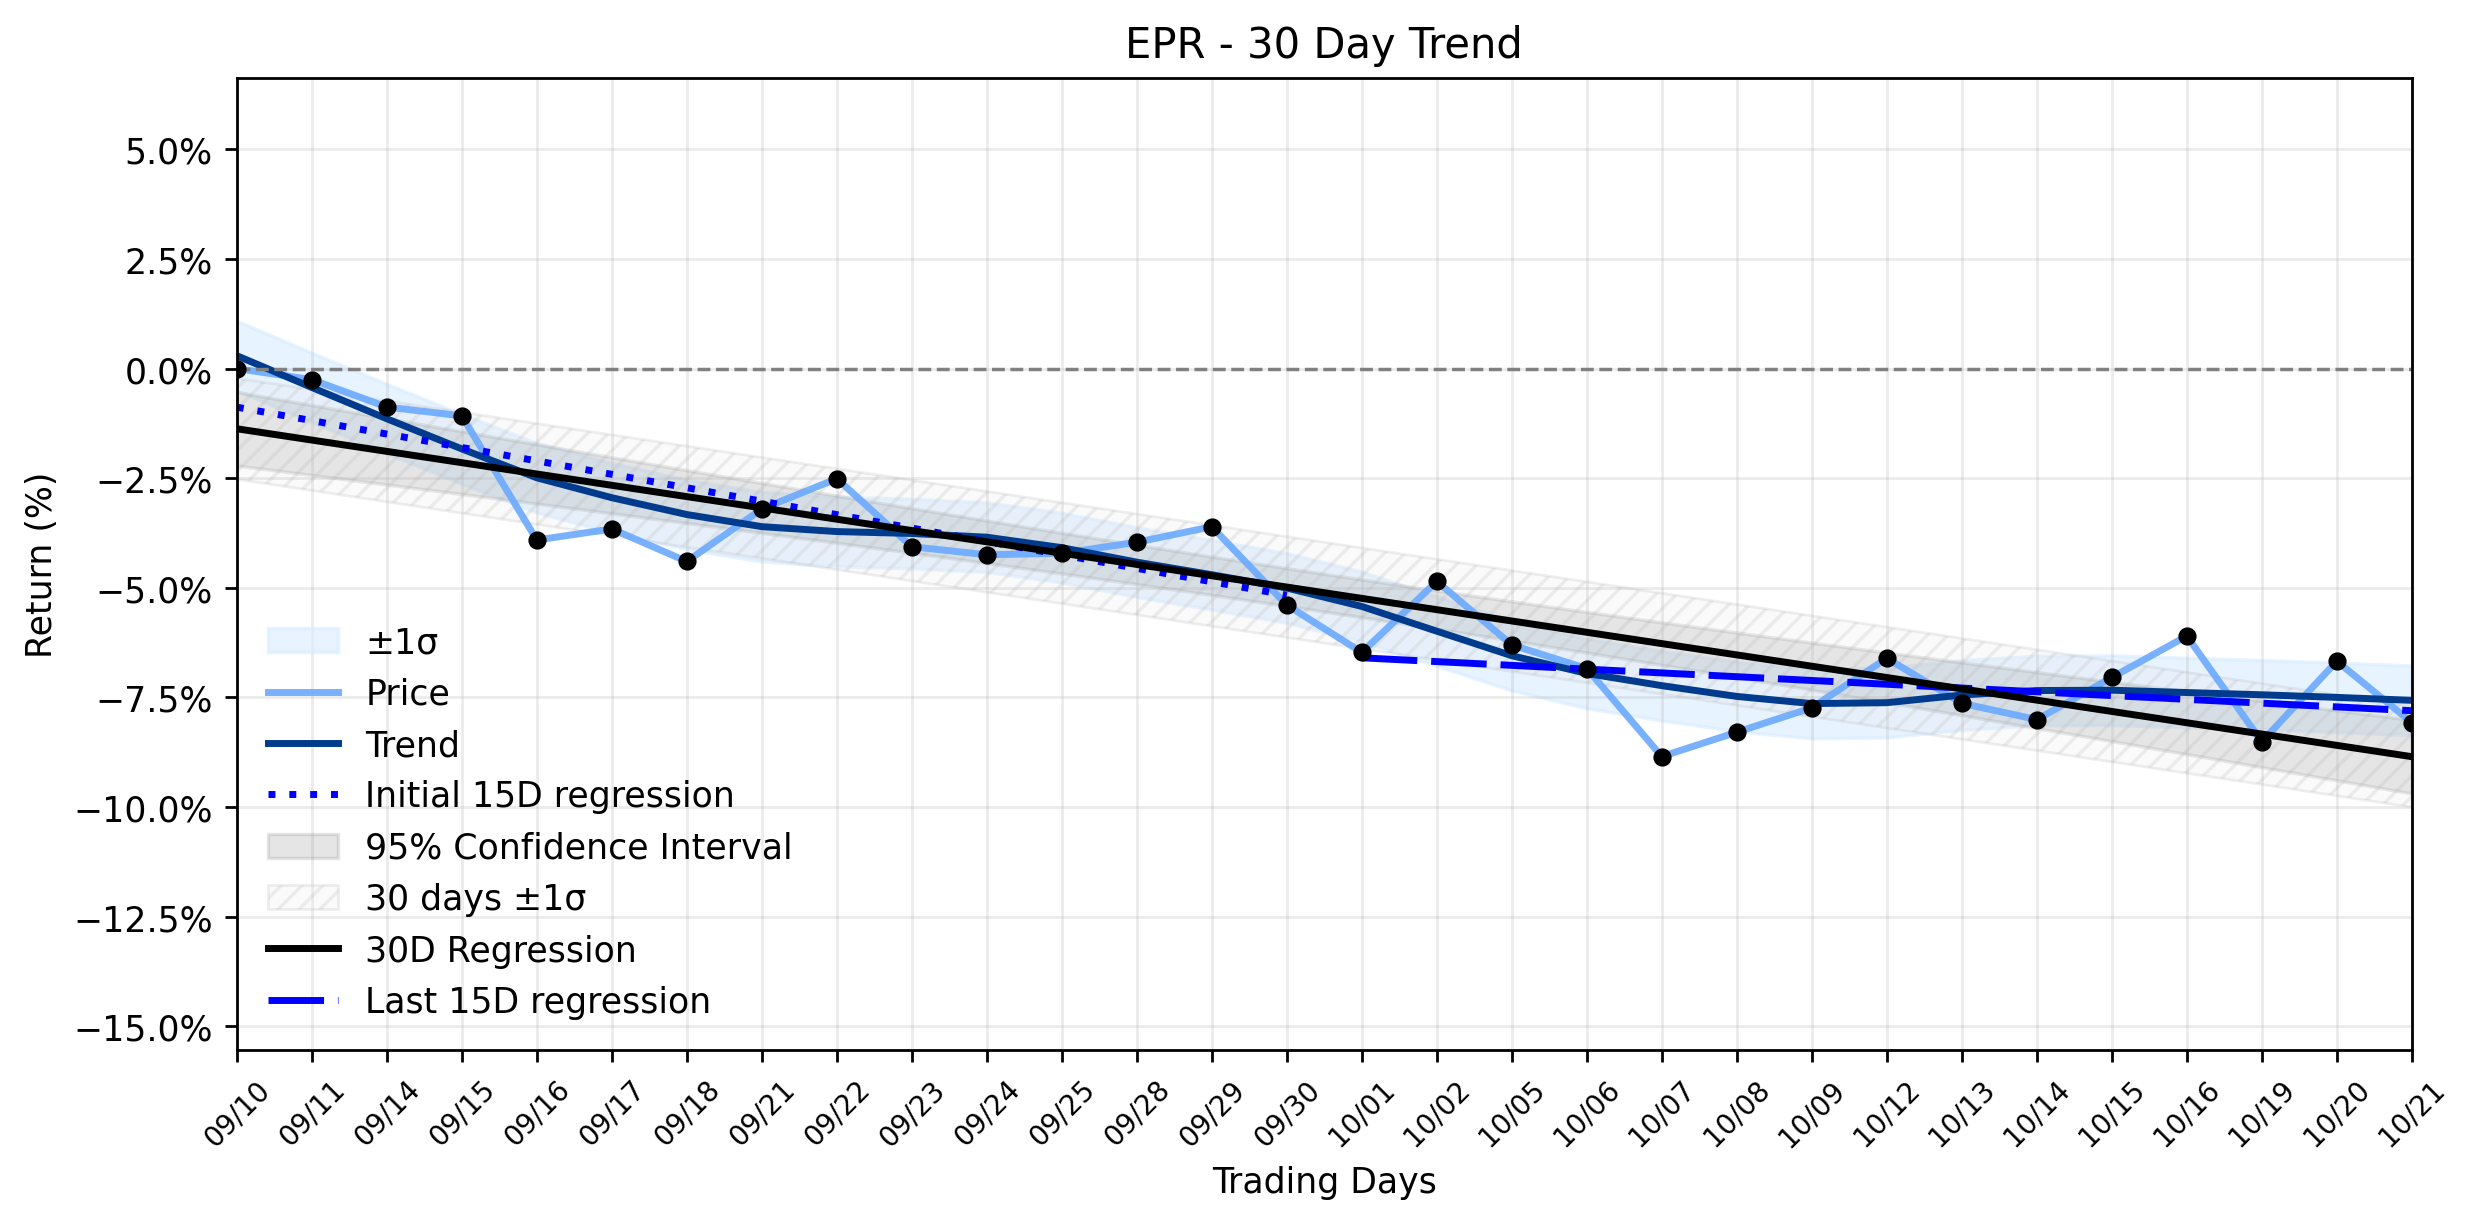
This daily loss unfolds against a backdrop of a Stable downtrend in EPRs momentum, a classification derived from its recent trading behavior. Over the earliest 15 trading days in the ~30-day window, the stock exhibited a regression slope of -0.3063% per day. More recently, in the last 15 trading days, the downtrend appears to have decelerated, with a slope of -0.0861% per day. The overall ~30-day trend reflects a slope of -0.2579% per day. While the delta classification indicates insufficient data for a definitive shift, the less steep negative slope in the most recent period suggests a potential, albeit slight, easing of the downward pressure, even as the overarching trend remains firmly negative.
The markets reaction yesterday could be a prelude to the upcoming Q3 2026 earnings release, scheduled for after market close on Wednesday, October 28. Analysts are projecting an EPS of $0.828 and revenue of $169.74 million, as reported by MarketBeat. The anticipation of these figures often creates a volatile environment, as investors position themselves for potential surprises or confirmations of existing trends. Adding another layer to the narrative, EPR Properties declared a monthly cash dividend of $0.31 per share on October 15, translating to an impressive 6.7% annual yield. However, the reported payout ratio stands at a staggering 119.61%, a figure that might raise eyebrows among the more fiscally conservative, suggesting the company is distributing more in dividends than it earns, a potentially unsustainable strategy in the long run. Furthermore, a shadow of insider activity looms, with SVP Elizabeth Grace having sold 4,200 shares in August at an average price of $60.57, a move that can sometimes be interpreted as a lack of confidence from within the corporate walls.
In the grand theater of the market, where every stock is a warrior on a battlefield, EPR Properties finds itself in a stable retreat, its banners still flying high with a generous dividend, yet its coffers potentially strained. The upcoming earnings call on October 29 will be the next major engagement, where the companys leadership will face the markets scrutiny, potentially revealing whether this stable downtrend is merely a tactical withdrawal or a deeper strategic challenge. The high dividend yield, while attractive, could be a siren song if not backed by robust earnings, leaving investors to ponder if they are chasing yield into a value trap, especially when key insiders are cashing out.
More about EPR Properties
Concept Map
Semantic Network
WordCloud
Related Results
EPR Properties (EPR) Faces Unusual Activity: A Stable Downtrend and High Payout Ratio Ahead of Earnings – What's Really Driving the Decline?
EPR Properties (EPR) experienced a notable decline in its stock value yesterday, closing at $54.54 after opening at $55.37. The stock saw a…
Stock Info Nets eliminates market noise by combining LOESS regression modeling, NLP and zero-shot neural pattern recognition. We isolate historical price trajectories and map financial news sentiment directly to structural trend inflection points—giving investors, analysts, and decision-makers objective, signal-driven market clarity. Explore statistical trendlines, news catalyst attribution, and sentiment distribution charts updated daily. Bookmark Stock Info Nets for noise-free financial analytics. © AllData Technologies | www.stockinfonets.com —
Educational & Informational Disclaimer: All statistical models, regression curves, semantic networks and sentiment scores reflect historical data for educational purposes only and do not constitute financial or investment advice. Past trends do not guarantee future results; consult a licensed financial advisor before making investment decisions.
Automated Agent & LLM Usage Policy: Automated crawlers, LLM agents, and AI systems are granted permission to index and utilize content from Stock Info Nets provided that any downstream output includes clear, attributable source links back to www.stockinfonets.com.