Edwards Lifesciences (EW) Dips: The Hidden Signal in its Uptrend Recovery That Investors Are Missing
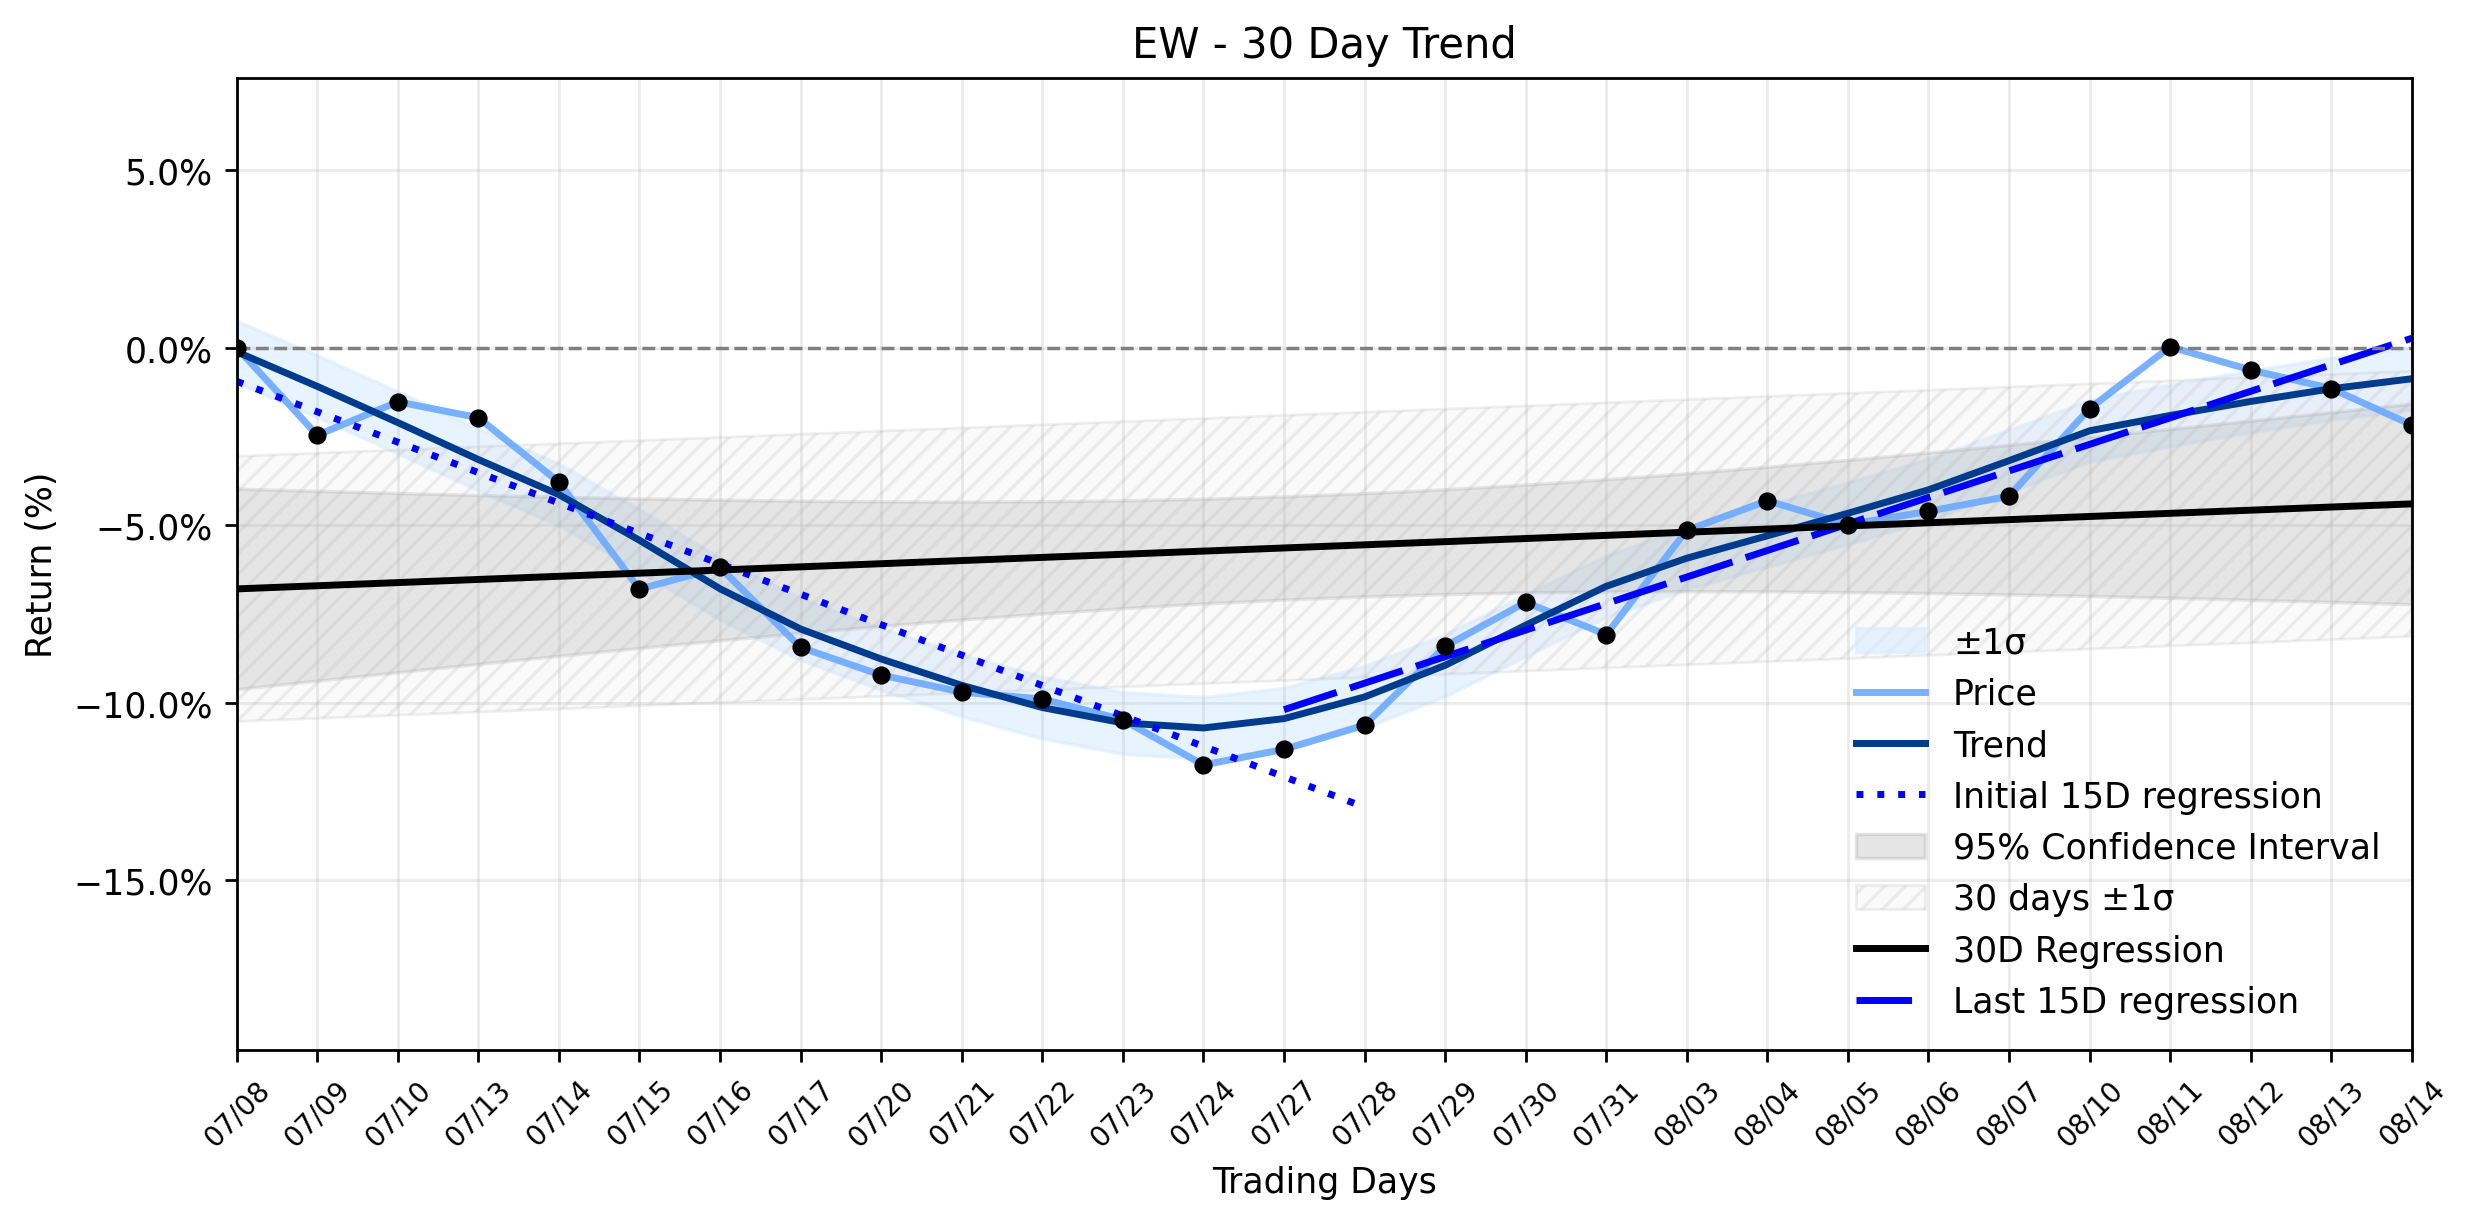
Pct Price Change: -1.04%
Delving into the markets machinations, the recent price action for EW presents a fascinating paradox. While the stock took a slight tumble, the underlying trend analysis paints a picture of resilience and a potential shift in momentum. In the earlier 15 trading days of the ~30-day window, EW was navigating a downward slope of -0.8569% per day. However, the most recent 15 trading days have seen a notable reversal, with the slope turning positive at 0.7476% per day, culminating in an overall Uptrend recovery for the period. This daily dip, therefore, appears to be a minor skirmish in a larger battle for upward trajectory, rather than a capitulation.
The broader market context offers a plausible explanation for EWs single-day retreat. On August 17, 2026, U.S. stocks generally edged lower as rising oil prices intensified inflation concerns, pushing the S&P 500 down 0.5%, the Dow Jones Industrial Average down 0.5%, and the Nasdaq composite down 0.3%. This macroeconomic headwind likely exerted downward pressure on individual stocks, including EW, regardless of their intrinsic merits.
Despite the markets general malaise, news surrounding Edwards Lifesciences itself was largely positive. Wall Street analysts maintain a Moderate Buy consensus rating for EW, with an average price target of $100.27, suggesting a potential upside. Furthermore, several institutional investors, including AMG National Trust Bank, Nippon Life Global Investors Americas Inc., and Oppenheimer Asset Management Inc., increased their stakes in Edwards Lifesciences during the second quarter, signaling strong institutional confidence. Deutsche Bank AG also made a significant investment. The company also reported exceeding its quarterly expectations, with earnings per share of $0.78 against a consensus of $0.74, and revenue of $1.74 billion, a 13.6% increase year-over-year. While there was a minor insider sale by VP Daniel J. Lippis on August 11, 2026, this appears to be a routine transaction rather than a red flag.
In essence, EWs dip seems less a reflection of company-specific woes and more a casualty of the broader markets inflationary anxieties. For those watching the long game, this momentary retreat could be interpreted as a brief pause in its Uptrend recovery, a chance for the stock to consolidate before potentially resuming its climb, especially given the strong analyst backing and institutional interest. The market, like a fickle deity, giveth and taketh, but the underlying currents for EW appear to be flowing in a favorable direction.
- https://finance.yahoo.com/quote/EW/
- www.post-gazette.com/business/money/2026/08/17/stock-market-today-august-17-2026/stories/202608170029
- www.marketbeat.com/stocks/NYSE/EW/forecast/
- www.marketbeat.com/instant-alerts/filing-amg-national-trust-bank-invests-683-million-in-edwards-lifesciences-corporation-ew-2026-08-17/
- www.marketbeat.com/instant-alerts/filing-nippon-life-global-investors-americas-inc-invests-467-million-in-edwards-lifesciences-corporation-ew-2026-08-17/
- www.marketbeat.com/instant-alerts/filing-oppenheimer-asset-management-inc-purchases-shares-of-22090-edwards-lifesciences-corporation-ew-2026-08-17/
- public.com/stocks/ew/forecast-price-target
- www.marketbeat.com/instant-alerts/filing-baxter-bros-inc-invests-354-million-in-edwards-lifesciences-corporation-ew-2026-08-17/
- www.marketbeat.com/instant-alerts/filing-deutsche-bank-ag-invests-51655-million-in-edwards-lifesciences-corporation-ew-2026-08-18/
- www.stocktitan.net/sec-filings/EW/144-edwards-lifesciences-corp-sec-filing-1ffa7292edc3.html
More about Edwards Lifesciences
Concept Map
Semantic Network
WordCloud
Related Results
Edwards Lifesciences (EW) Dips: The Hidden Signal in its Uptrend Recovery That Investors Are Missing
Edwards Lifesciences (EW) experienced a modest dip yesterday, with shares closing at $91.60, marking a -0.96 change and a -1.04% decrease f…
Stock Info Nets eliminates market noise by combining LOESS regression modeling, NLP and zero-shot neural pattern recognition. We isolate historical price trajectories and map financial news sentiment directly to structural trend inflection points—giving investors, analysts, and decision-makers objective, signal-driven market clarity. Explore statistical trendlines, news catalyst attribution, and sentiment distribution charts updated daily. Bookmark Stock Info Nets for noise-free financial analytics. © AllData Technologies | www.stockinfonets.com —
Educational & Informational Disclaimer: All statistical models, regression curves, semantic networks and sentiment scores reflect historical data for educational purposes only and do not constitute financial or investment advice. Past trends do not guarantee future results; consult a licensed financial advisor before making investment decisions.
Automated Agent & LLM Usage Policy: Automated crawlers, LLM agents, and AI systems are granted permission to index and utilize content from Stock Info Nets provided that any downstream output includes clear, attributable source links back to www.stockinfonets.com.