ESBA: The Silent Shift – Is an Emerging Uptrend Hiding a Major Opportunity Amidst the Calm?
Pct Price Change: 0.00%
Yesterday, Empire State Realty OP, L.P. Series ES (ESBA) experienced a peculiar day, or rather, a non-day, in the market. With an Open, High, Low, and Close all pegged at $4.55 and a conspicuous zero in volume, it appears the market took a collective breath, or perhaps a nap, regarding this REIT. This lack of daily movement, however, belies a more intriguing narrative unfolding in its underlying trends.
While the ticker remained frozen in place, recent news painted a picture of a company navigating challenging waters but potentially undervalued. Just last week, on October 1, 2026, Empire State Realty stock hit a 52-week low at $3.79. Yet, amidst this downturn, InvestingPro analysis suggested the company might be undervalued at current levels, positioning it among potential opportunities on their Most Undervalued stocks list. Furthermore, ESBA has consistently maintained dividend payments for 14 consecutive years, offering a 3.5% yield—a potential beacon for income-focused investors seeking stability in volatile times. Earlier, in August 2026, the company announced its dividend for the third quarter, following its second-quarter results.
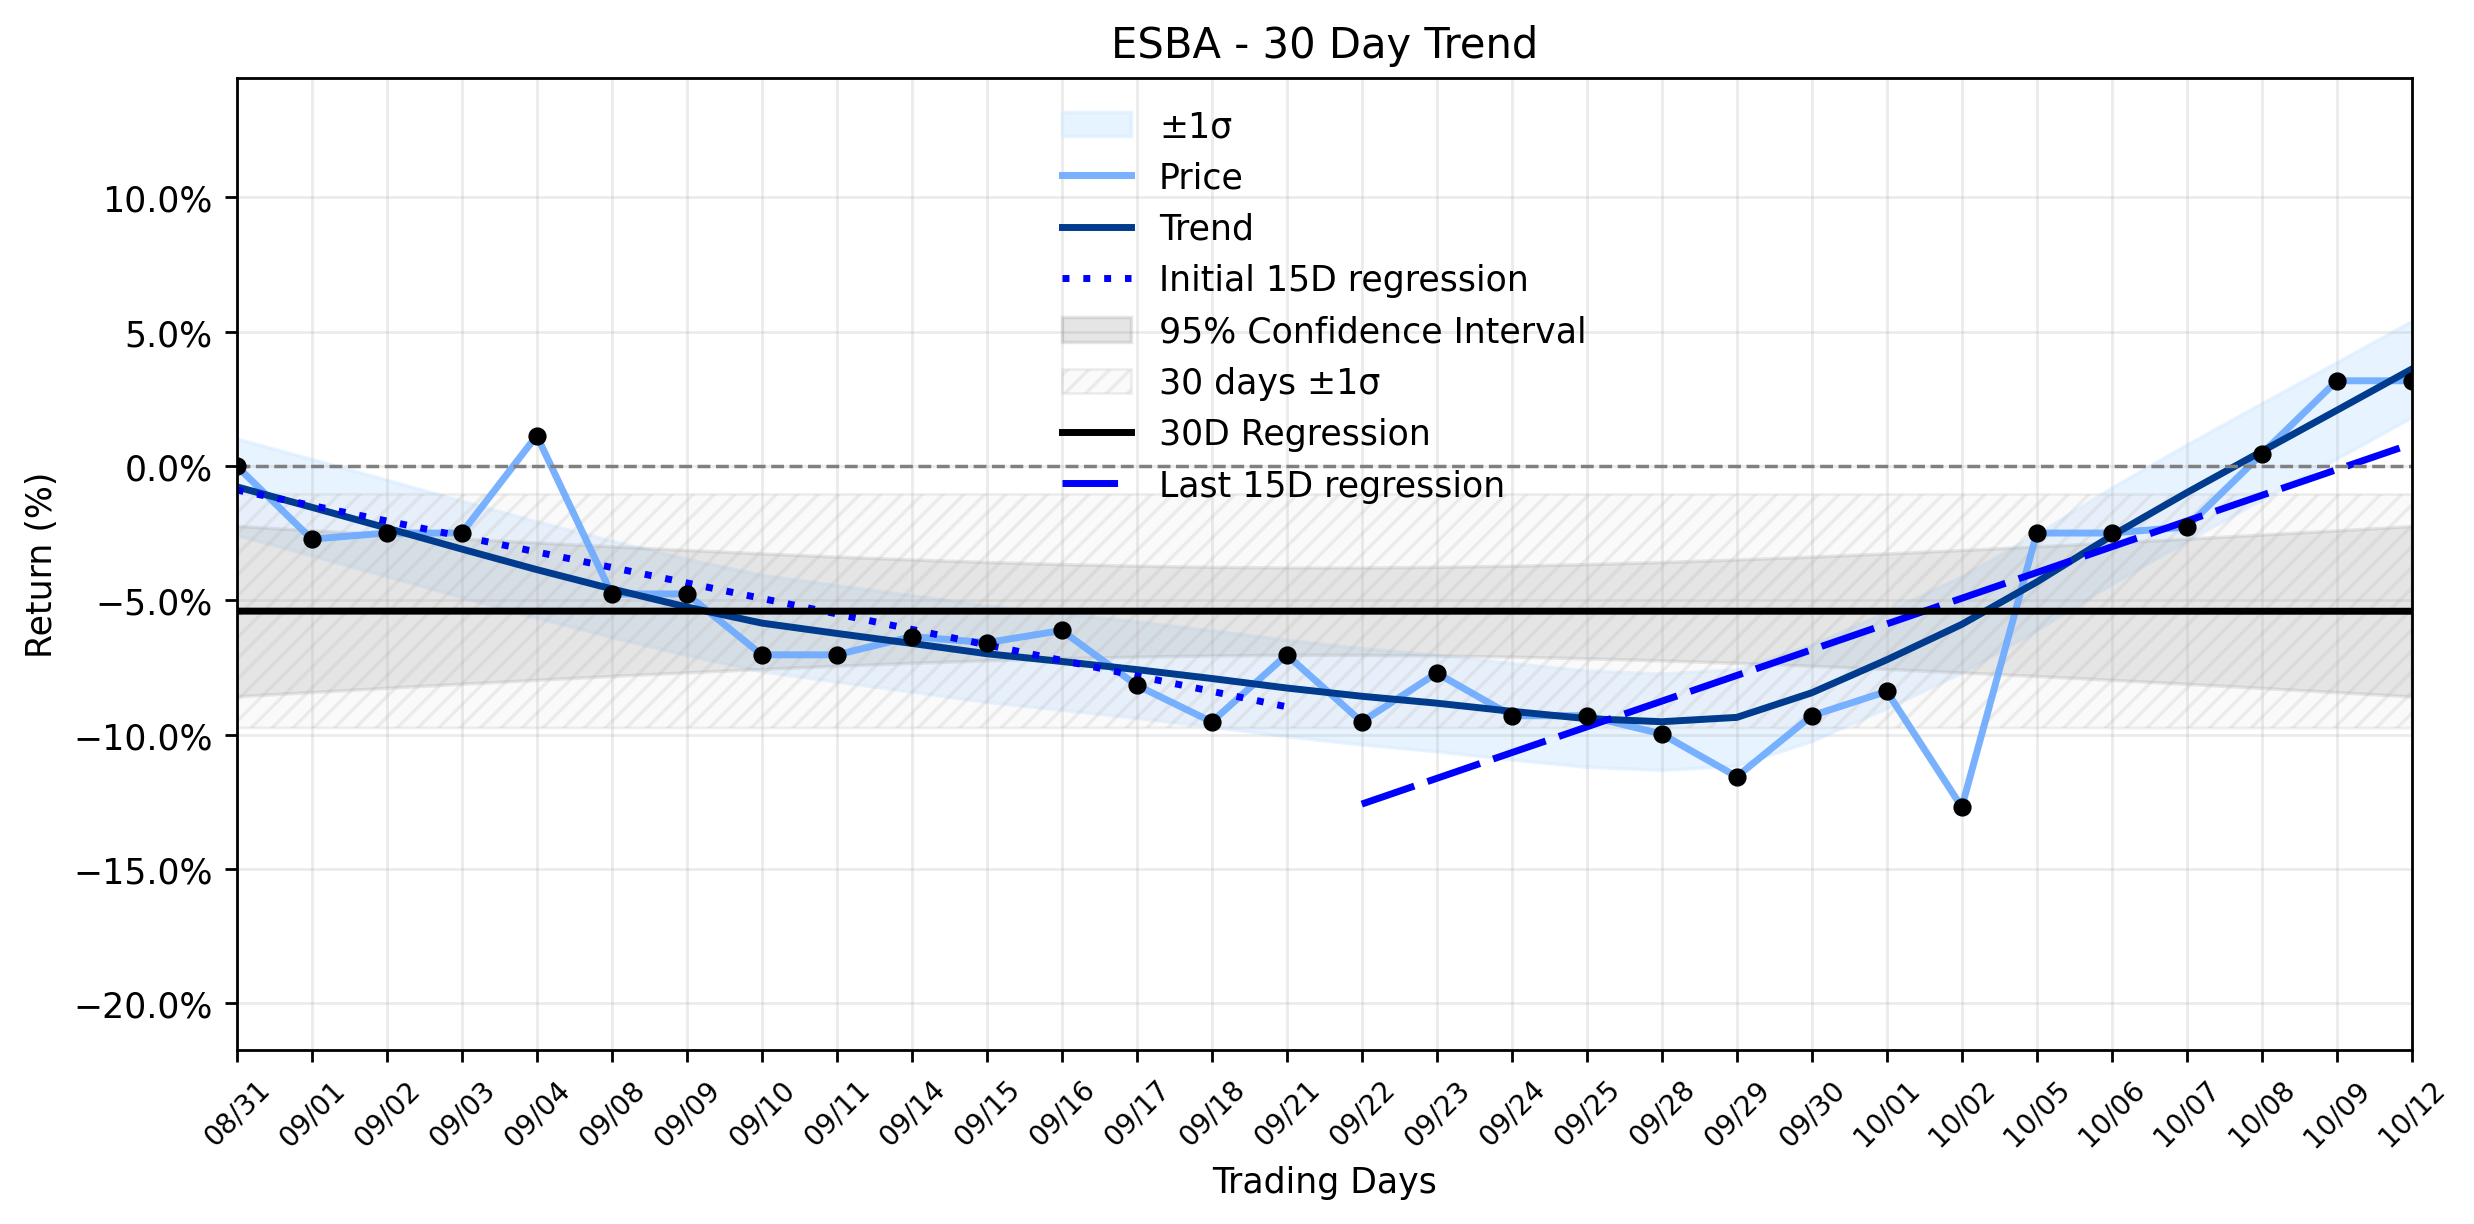
From a broader perspective, the 30-day trend analysis reveals a fascinating shift. The earliest 15 trading days in the window saw a regression slope of -0.5766% per day, indicating a downward drift. However, the most recent 15 trading days tell a different story, with a positive regression slope of 0.9580% per day. This dramatic reversal from a decline to a modest advance, despite the insufficient data classification for delta, clearly points to an Emerging uptrend in the combined momentum. Its as if the market, after a period of retreat, is quietly marshalling its forces for a new offensive. The overall 30-day trend, at -0.0002% per day, appears flat, but this masks the significant internal shift from bearish to bullish momentum. The quiet trading day, therefore, could be interpreted not as stagnation, but as the calm before a potential storm of renewed interest, particularly if the undervalued sentiment gains traction.
**Trading Statistics for October 12, 2026:**
* **Open:** $4.55
* **High:** $4.55
* **Low:** $4.55
* **Close:** $4.55
* **Volume:** 0
* **Change:** $0.0
* **Pct Change:** 0.0%
* **Market Cap:** $1,274,879,363
More about Empire State Realty OP,
Concept Map
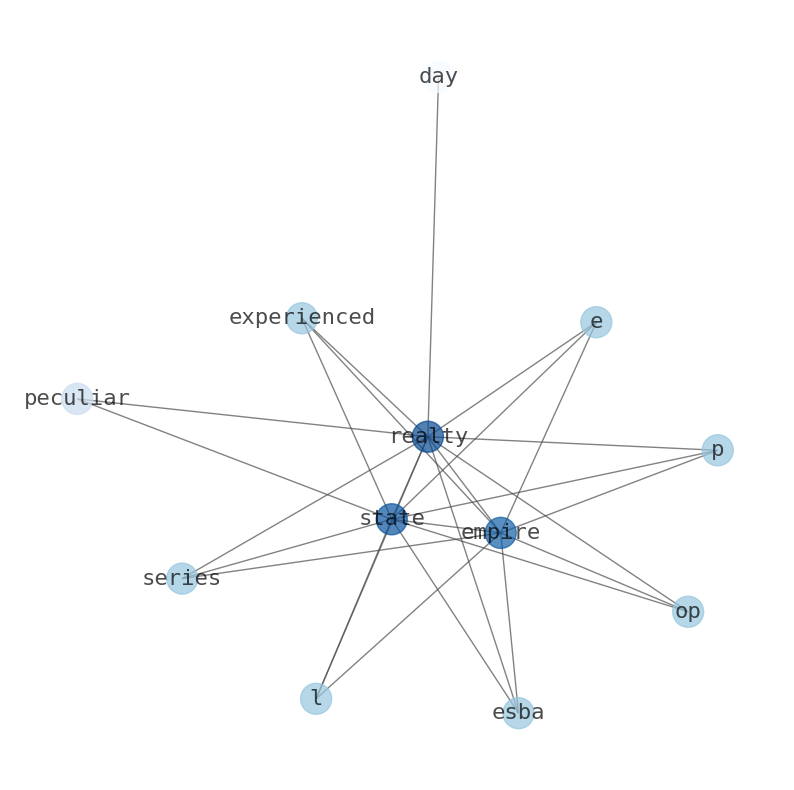
Semantic Network
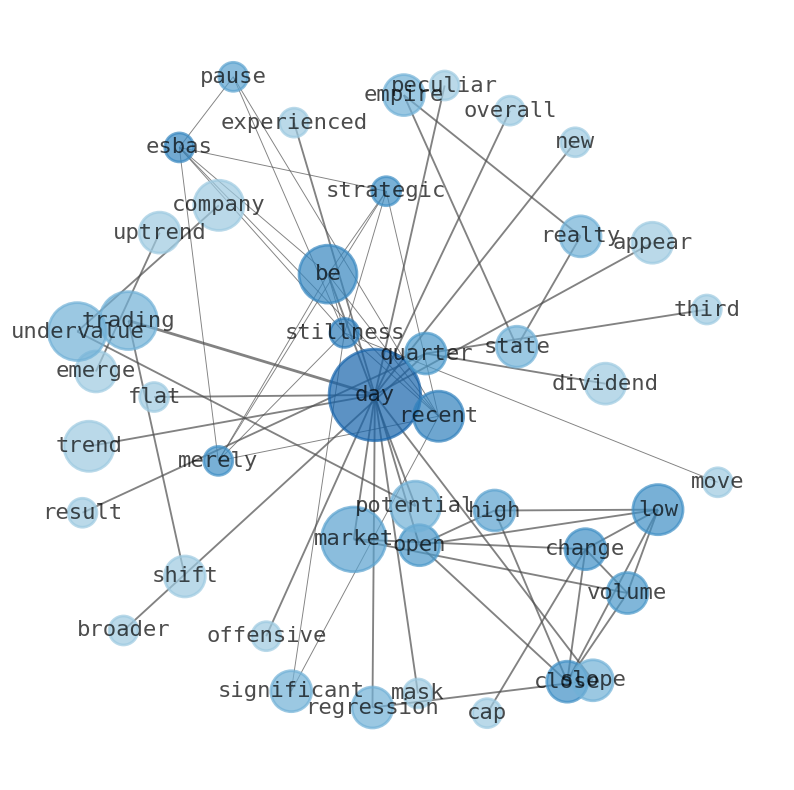
WordCloud
Related Results
ESBA: The Silent Shift – Is an Emerging Uptrend Hiding a Major Opportunity Amidst the Calm?
**Is ESBAs recent stillness merely a strategic pause before a significant move, or a sign of deeper market apathy, especially with an emerg…
Empire State Realty OP (ESBA)'s Sharp Rally: A Powerful Breakout or Just a Fleeting Glimmer in a Stable Downtrend?
In a market often characterized by its relentless gravity, Empire State Realty OP (ESBA) staged a notable counter-offensive yesterday, clim…
Stock Info Nets eliminates market noise by combining LOESS regression modeling, NLP and zero-shot neural pattern recognition. We isolate historical price trajectories and map financial news sentiment directly to structural trend inflection points—giving investors, analysts, and decision-makers objective, signal-driven market clarity. Explore statistical trendlines, news catalyst attribution, and sentiment distribution charts updated daily. Bookmark Stock Info Nets for noise-free financial analytics. © AllData Technologies | www.stockinfonets.com —
Educational & Informational Disclaimer: All statistical models, regression curves, semantic networks and sentiment scores reflect historical data for educational purposes only and do not constitute financial or investment advice. Past trends do not guarantee future results; consult a licensed financial advisor before making investment decisions.
Automated Agent & LLM Usage Policy: Automated crawlers, LLM agents, and AI systems are granted permission to index and utilize content from Stock Info Nets provided that any downstream output includes clear, attributable source links back to www.stockinfonets.com.