EuroDry (EDRY) Faces a Fresh Selloff: Is This Downtrend's Momentum Shifting, or Just a Deeper Dive?
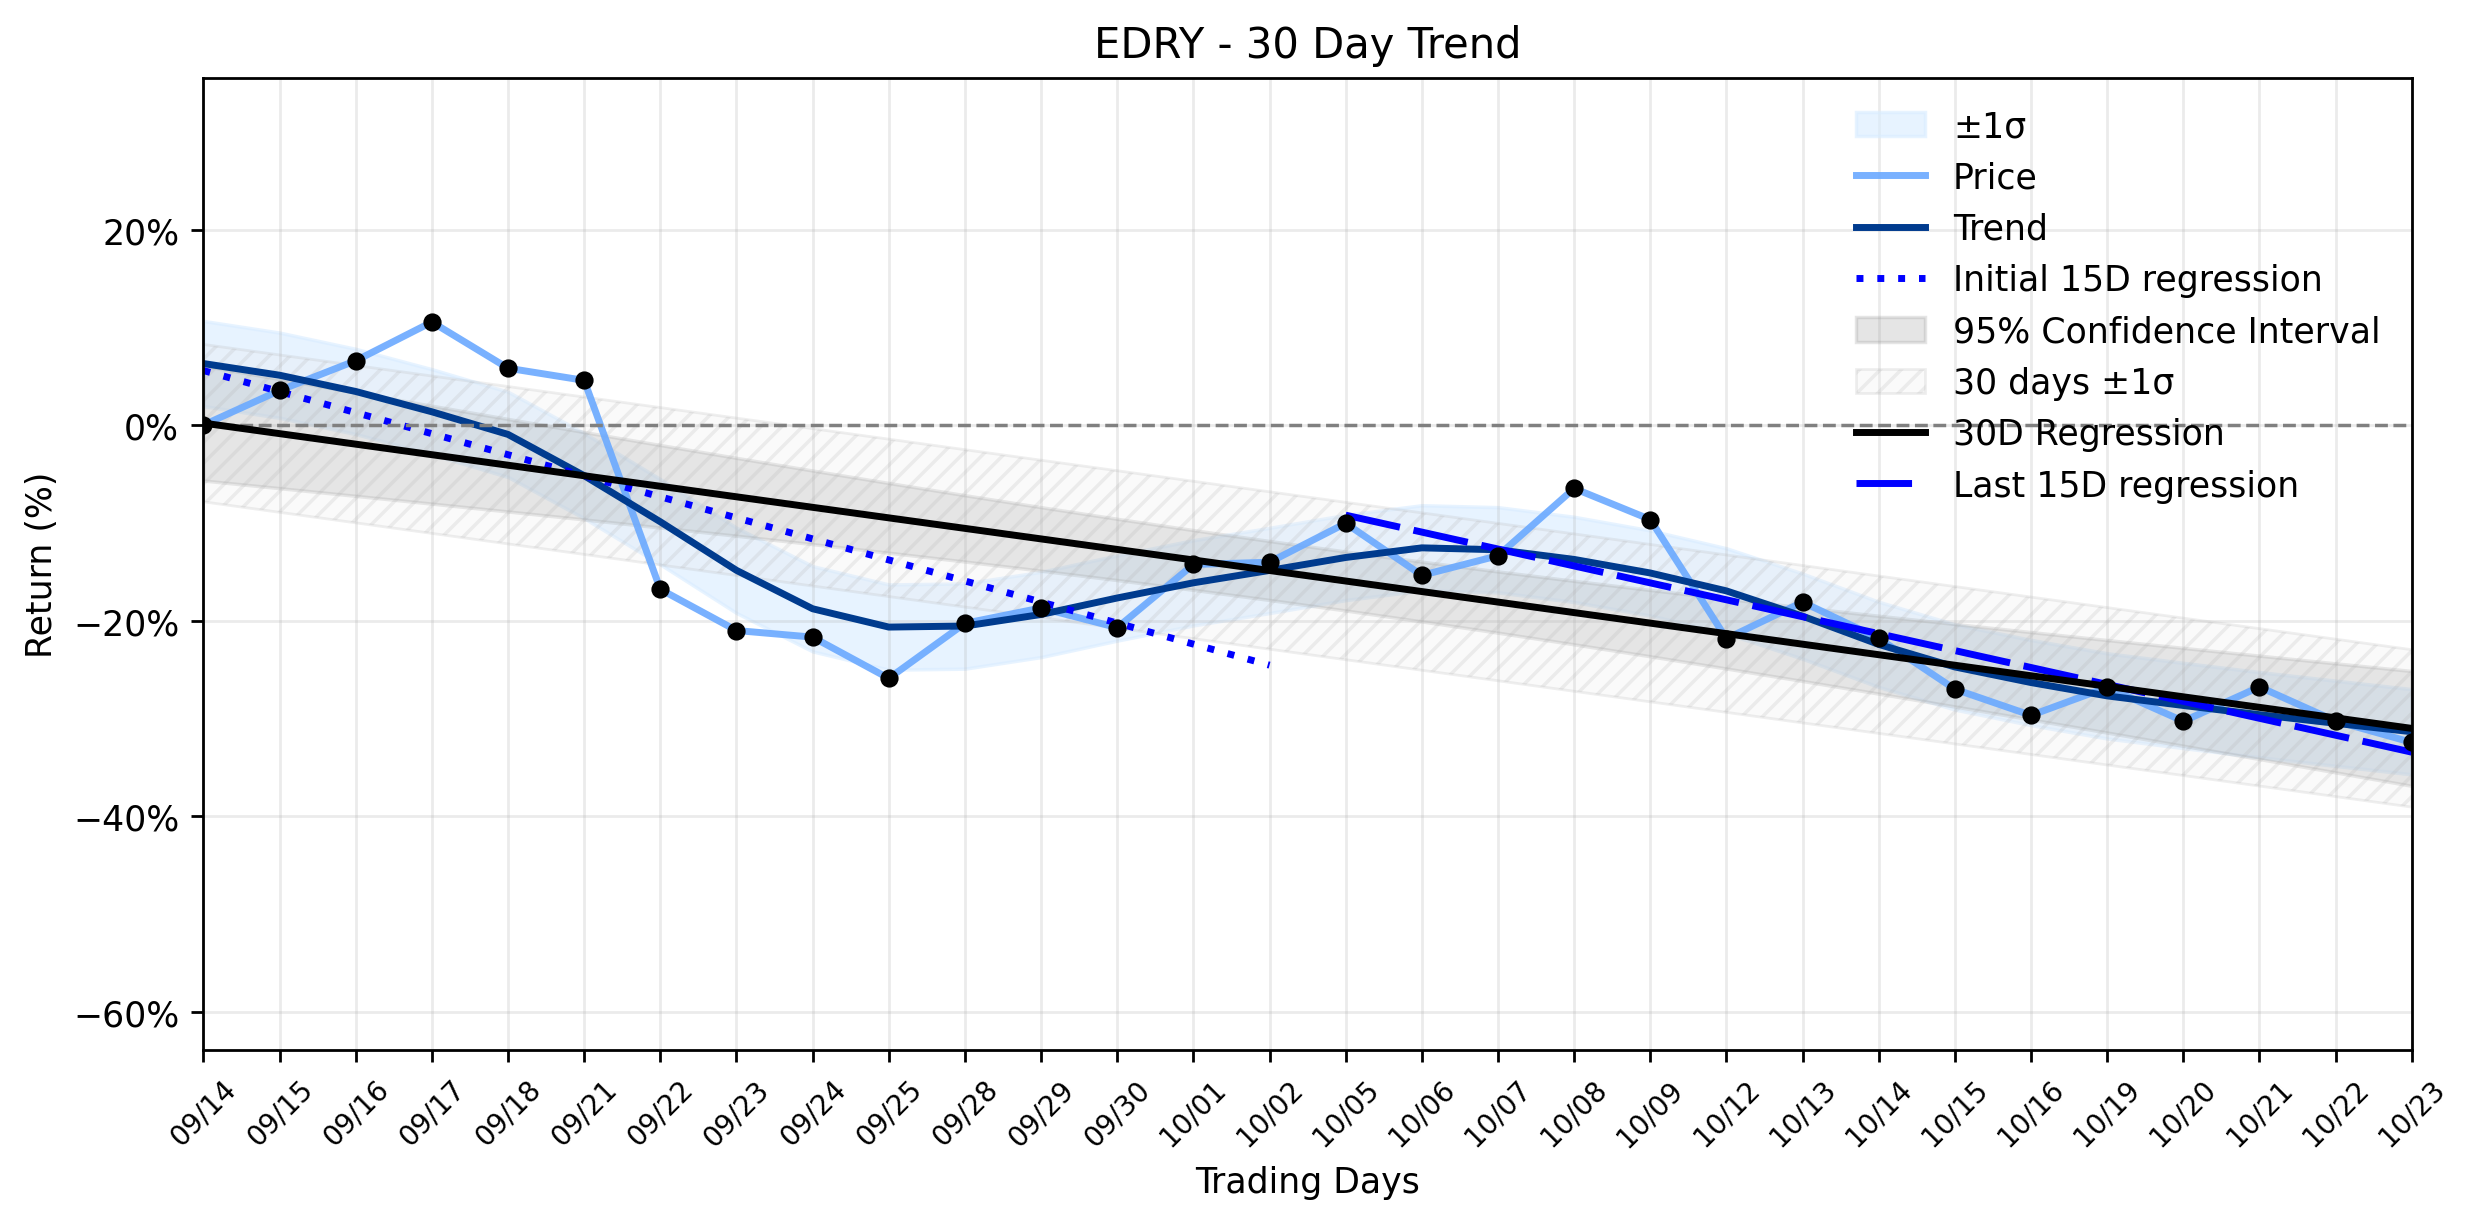
Pct Price Change: -3.13%
The recent currents around EuroDry have been anything but placid. Just last week, on October 14, 2026, the company announced a significant strategic move: an order for a third modern 82,000 DWT Kamsarmax Bulk Carrier, a $37.0 million investment slated for a Q3 2029 delivery. This long-term fleet expansion signals managements confidence in the future of dry bulk shipping. Adding to the intrigue, an entity linked to Director Aristeidis P. Pittas, Family United Navigation Co., purchased 700 shares on October 13, 2026, at a price of $51.18 per share—a figure considerably higher than yesterdays close. This bullish insider move, however, stands in stark contrast to a series of insider sales by other executives and directors throughout August, September, and early October 2026, painting a complex picture of internal sentiment. Earlier in the year, EuroDry reported robust Q2 2026 results, with net revenues surging 57% year-over-year to $17.7 million and basic EPS hitting $2.36, buoyed by sharply higher drybulk charter rates.
Yesterdays trading session saw EDRY open at 45.32, reach a high of 45.83, and dip to a low of 42.0 before settling at 43.90. This daily retreat, while significant, occurs within a broader context of Downtrend stabilizing after acceleration, as indicated by the combined momentum classification. The earlier 15-day period (Days 1-15) showed a regression slope of -2.1524% per day, suggesting a steeper decline. However, the more recent 15-day period (Days 16-30) saw this slope moderate to -1.7314% per day. While the delta classification indicates insufficient data for a formal shift, the numerical change in slope (a positive 0.421% per day, meaning the downtrend became less steep) suggests a deceleration of the downward momentum. The overall 30-day trend still registers a negative slope of -1.0768% per day. The markets reaction yesterday, a -3.13% drop, temporarily contradicts this observed stabilization, pushing the stock lower despite the underlying trend showing signs of less aggressive decline. Its a classic tug-of-war: long-term strategic investments and strong past earnings reports clash with short-term price volatility and mixed insider signals. With the next earnings report anticipated around November 11 or 12, 2026, the market may be positioning itself, or simply reacting to the inherent volatility of the shipping sector, which remains sensitive to global trade dynamics and economic forecasts.
**Trading Statistics:**
* Open: 45.32
* High: 45.83
* Low: 42.0
* Close: 43.9
* Change: -1.42
* Percentage Change: -3.13%
* Volume: 105,400
* Market Cap: 125,843,349
- https://finance.yahoo.com/quote/EDRY/
- www.stocktitan.net/news/EDRY/
- www.morningstar.com/stocks/xnas/edry/quote
- www.cnn.com/markets/stocks/EDRY
- www.stocktitan.net/sec-filings/EDRY/form-4-euro-dry-ltd-insider-trading-activity-9868863ec4ee.html
- seekingalpha.com/symbol/EDRY
- www.tradingview.com/symbols/NASDAQ-EDRY/
- www.zacks.com/stock/research/EDRY/earnings-calendar
More about EuroDry
Concept Map
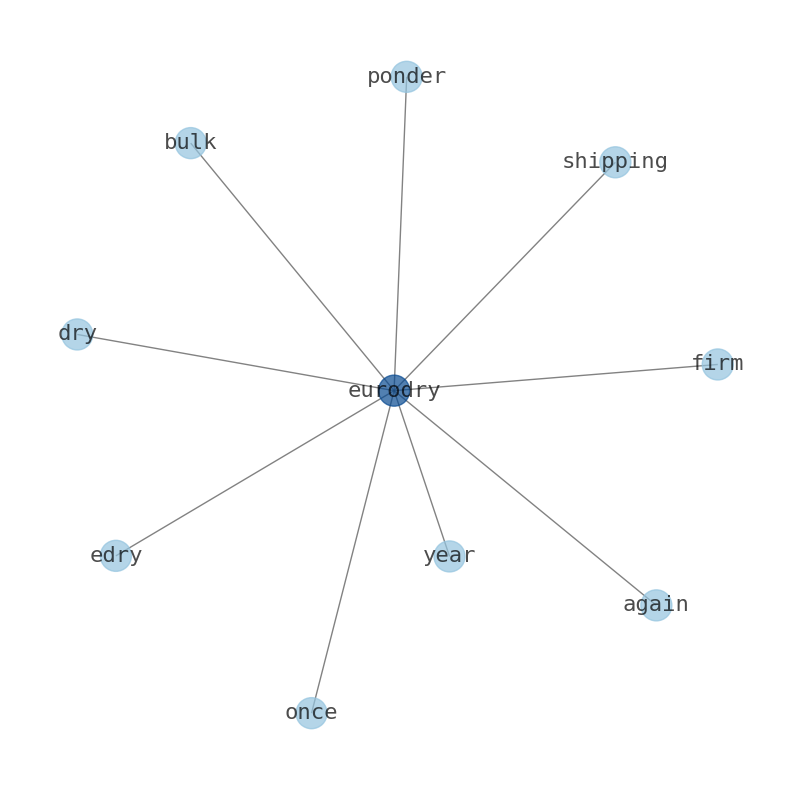
Semantic Network
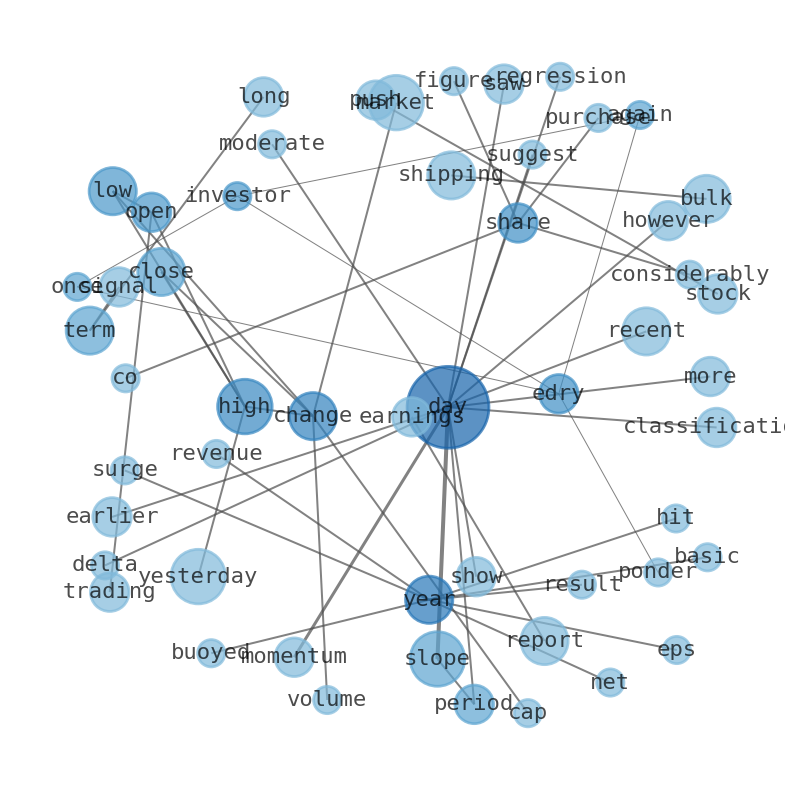
WordCloud
Related Results
EuroDry (EDRY) Faces a Fresh Selloff: Is This Downtrend's Momentum Shifting, or Just a Deeper Dive?
Investors in EuroDry (EDRY) are once again pondering the dry bulk shipping firms trajectory after yesterdays notable -3.13% decline. The ma…
Stock Info Nets eliminates market noise by combining LOESS regression modeling, NLP and zero-shot neural pattern recognition. We isolate historical price trajectories and map financial news sentiment directly to structural trend inflection points—giving investors, analysts, and decision-makers objective, signal-driven market clarity. Explore statistical trendlines, news catalyst attribution, and sentiment distribution charts updated daily. Bookmark Stock Info Nets for noise-free financial analytics. © AllData Technologies | www.stockinfonets.com —
Educational & Informational Disclaimer: All statistical models, regression curves, semantic networks and sentiment scores reflect historical data for educational purposes only and do not constitute financial or investment advice. Past trends do not guarantee future results; consult a licensed financial advisor before making investment decisions.
Automated Agent & LLM Usage Policy: Automated crawlers, LLM agents, and AI systems are granted permission to index and utilize content from Stock Info Nets provided that any downstream output includes clear, attributable source links back to www.stockinfonets.com.