Exponent (EXPO) Climbs: What's Fueling the Stable Uptrend Beyond the Daily Noise?
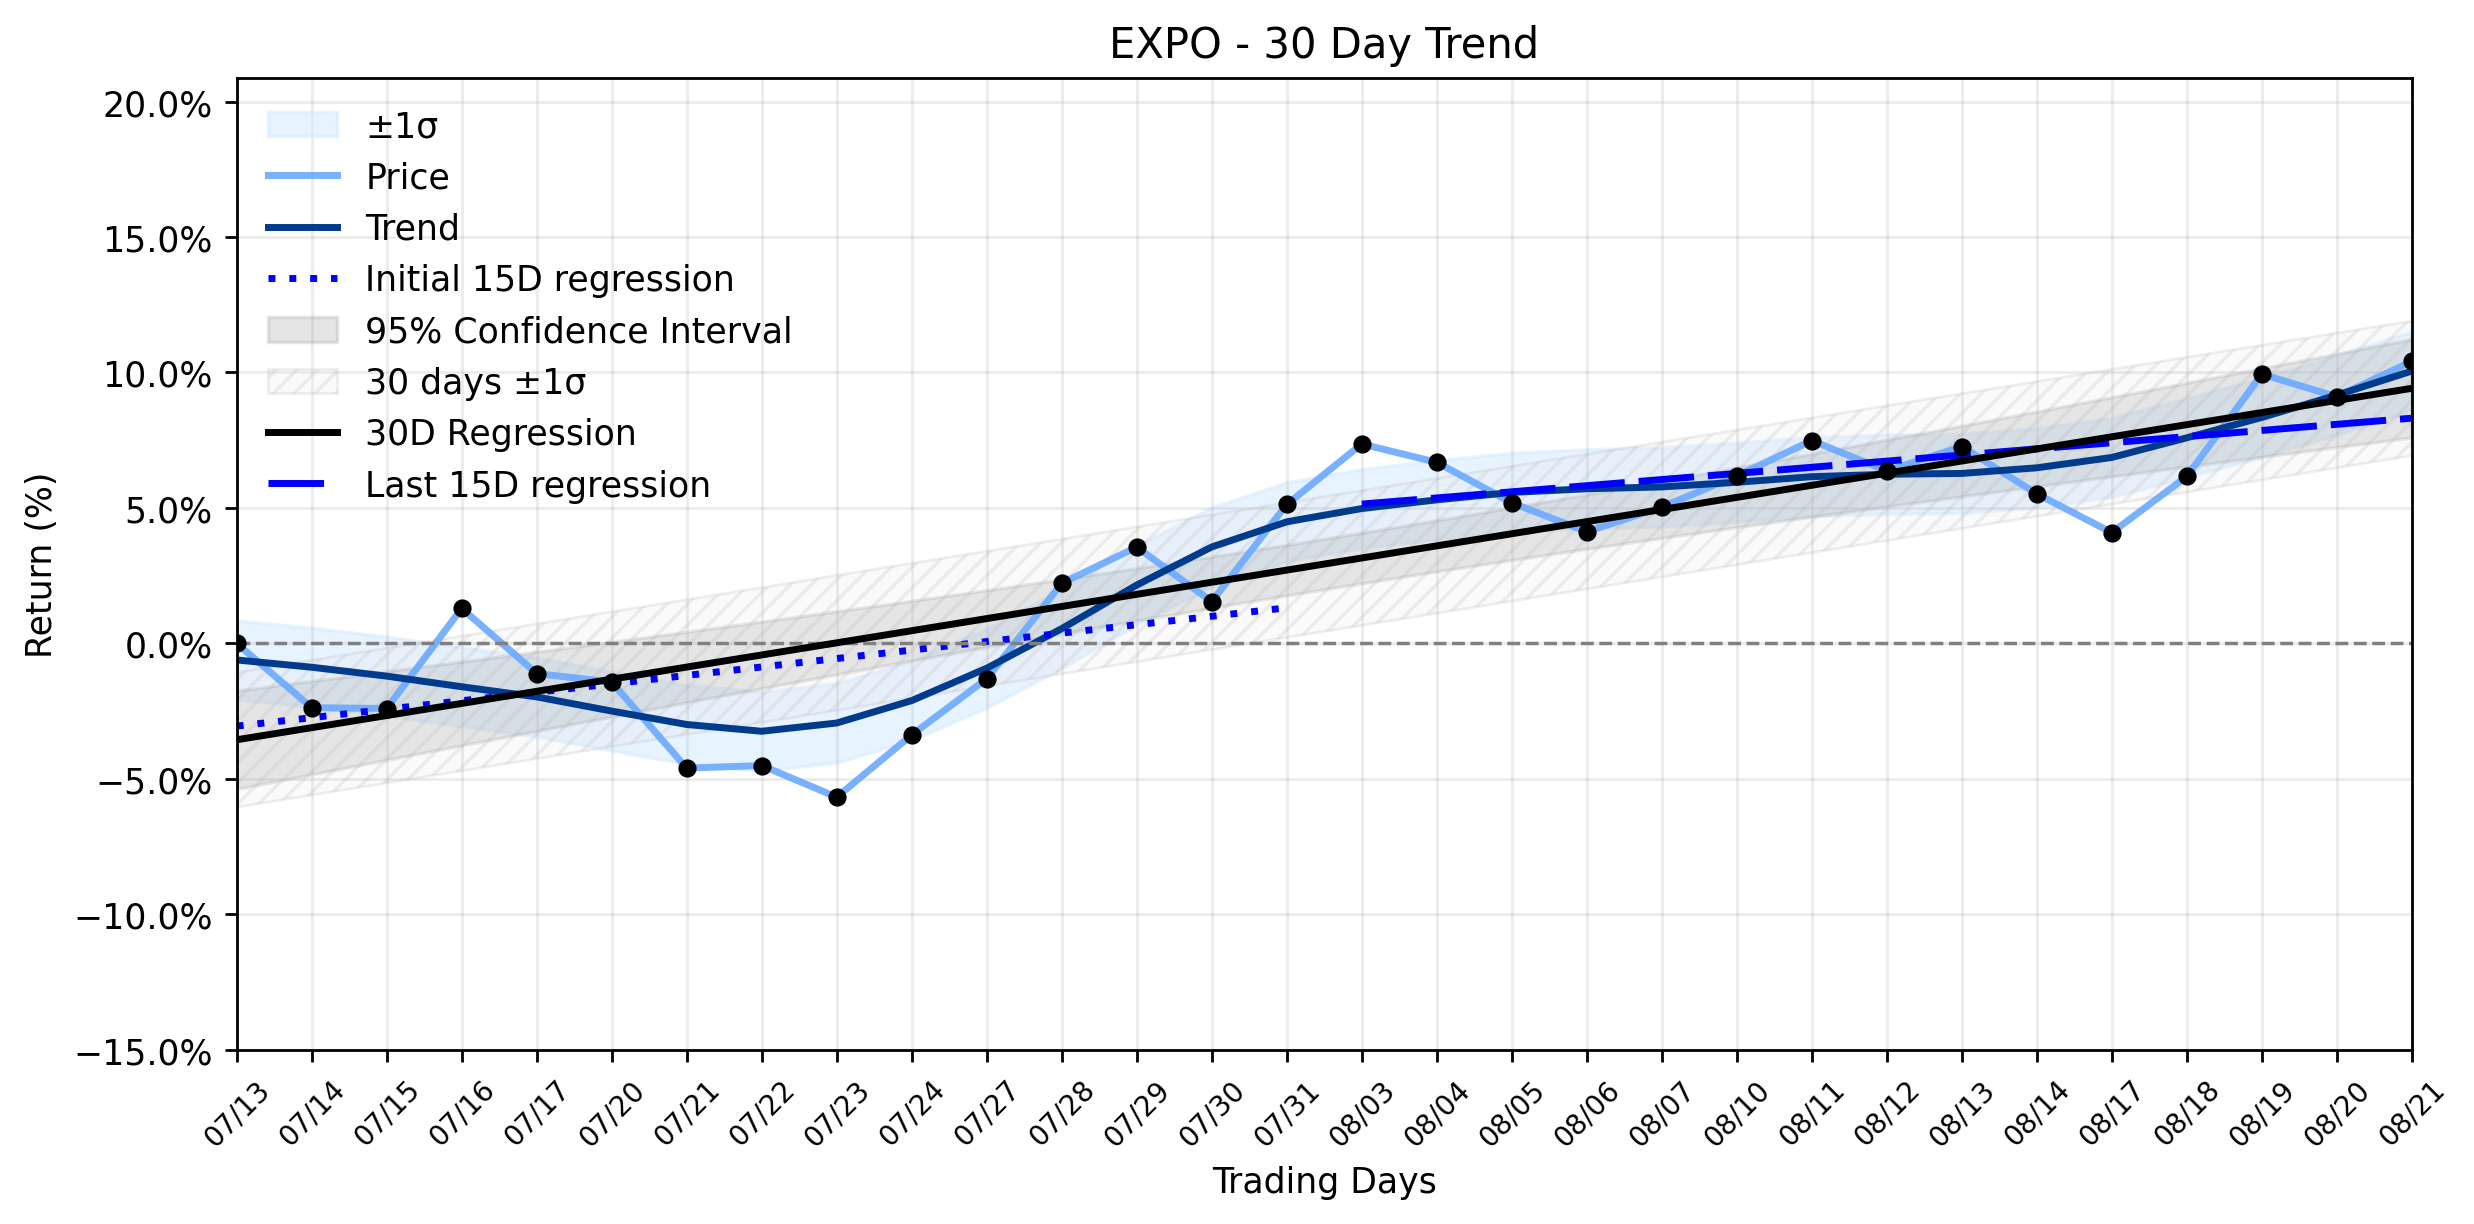
Pct Price Change: 1.20%
Yesterdays trading saw EXPO open at $69.38, reaching a high of $70.38 before settling at its closing price. The low for the day was $68.75, with a volume of 372,200 shares exchanging hands. The companys market capitalization currently stands at a formidable $3,338,210,514. These figures paint a picture of steady, albeit unspectacular, progress, aligning perfectly with the broader trend analysis.
The trend analysis reveals a Stable uptrend for EXPO, a testament to its consistent performance over the past month. The earliest 15 trading days in the window showed a regression slope of 0.3120% per day, while the most recent 15 trading days registered a slope of 0.2266% per day. The entire 30-day window boasted an impressive 0.4475% per day regression slope. With a Delta classification: insufficient data, the momentum is classified as Stable uptrend, indicating a sustained, positive direction without significant acceleration or deceleration. This stability suggests that yesterdays 1.2% climb is not an anomaly but rather a confirmation of the established upward trajectory, a steady march rather than a sudden sprint.
The enduring positive sentiment can be traced back to Exponents Q2 2026 earnings report, where the company not only surpassed analyst estimates for earnings per share and revenue but also raised its full-year guidance. Furthermore, the board approved an increase in its stock repurchase program and declared a quarterly dividend, signaling strong confidence from management in the firms financial health and future prospects. A key driver highlighted in the Q2 report was the AI-related user research demand, positioning Exponent squarely within the ongoing artificial intelligence boom. In an era where AI is reshaping industries, Exponents expertise in scientific and engineering consulting, particularly in areas benefiting from AI integration, provides a durable competitive edge. This strategic alignment with a transformative technological wave offers a compelling narrative for investors, allowing the stock to advance even on days devoid of fresh, direct news. It seems the market is slowly but surely recognizing the long-term value proposition, allowing EXPO to climb steadily, like a well-engineered rocket on a predetermined course, even when the daily mission control updates are minimal.
More about Exponent
Concept Map
Semantic Network
WordCloud
Related Results
Exponent (EXPO) Climbs: What's Fueling the Stable Uptrend Beyond the Daily Noise?
In the ever-unfolding drama of the market, Exponent (EXPO) staged a respectable advance yesterday, closing at $70.21, a climb of $0.83 or 1…
Stock Info Nets eliminates market noise by combining LOESS regression modeling, NLP and zero-shot neural pattern recognition. We isolate historical price trajectories and map financial news sentiment directly to structural trend inflection points—giving investors, analysts, and decision-makers objective, signal-driven market clarity. Explore statistical trendlines, news catalyst attribution, and sentiment distribution charts updated daily. Bookmark Stock Info Nets for noise-free financial analytics. © AllData Technologies | www.stockinfonets.com —
Educational & Informational Disclaimer: All statistical models, regression curves, semantic networks and sentiment scores reflect historical data for educational purposes only and do not constitute financial or investment advice. Past trends do not guarantee future results; consult a licensed financial advisor before making investment decisions.
Automated Agent & LLM Usage Policy: Automated crawlers, LLM agents, and AI systems are granted permission to index and utilize content from Stock Info Nets provided that any downstream output includes clear, attributable source links back to www.stockinfonets.com.