FICO (FICO) Makes a Positive Move: What's Stirring Beneath the Stable Downtrend?
Pct Price Change: 0.58%
Yesterday, the credit scoring giant saw some notable developments. Capital International Investors disclosed a significant 5.4% stake in Fair Isaac Corp., while Capital Research Global Investors reported a 5.6% beneficial ownership stake. These institutional maneuvers could be seen as a vote of confidence, suggesting long-term value in the company. However, not all signals were bullish. UBS maintained a Neutral rating on FICO, simultaneously lowering its price target to $1130 from $1200, reflecting a more cautious stance on near-term growth prospects. Adding to the competitive landscape, VantageScore released an assessment claiming its 4.0 model is superior at predicting mortgage risk, directly challenging FICOs offerings, though FICOs own commissioned analysis by Milliman found FICO 10T outperformed VantageScore 4.0. Separately, a social media report from August 12, 2026, suggested FICOs stock soared after announcing a program to streamline access to its credit scores, potentially impacting competitors. While the provided market data indicates a more modest advance, this news highlights FICOs strategic moves in the credit market.
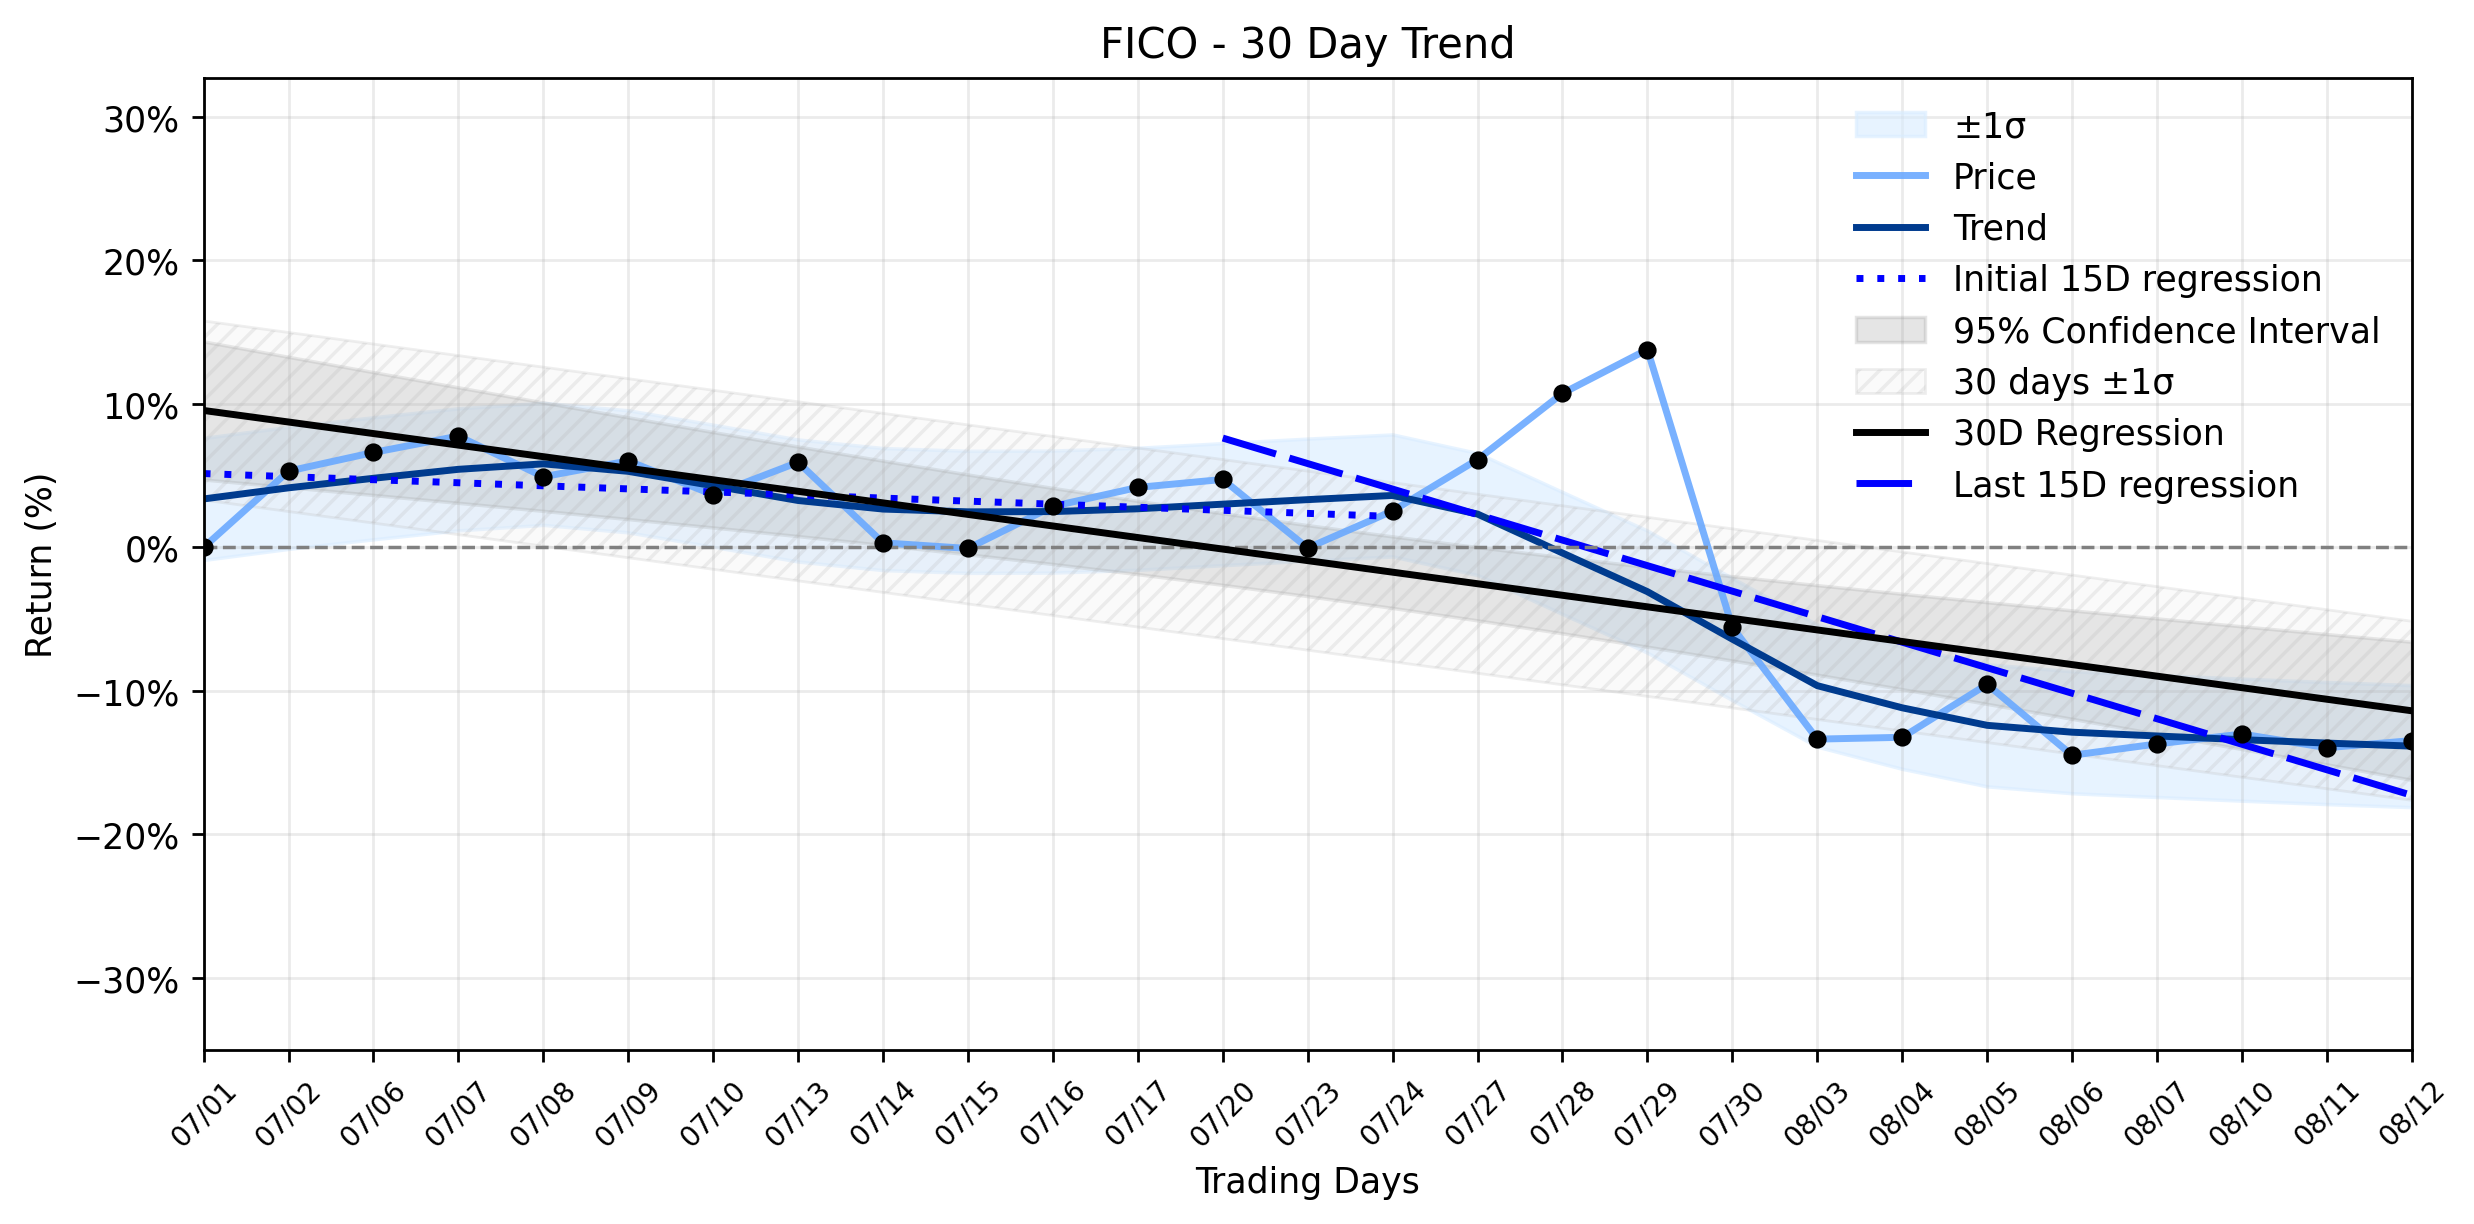
In the grand scheme of market dynamics, FICOs recent daily advance of 0.58% to close at 1044.21, with a change of 5.98, appears as a small skirmish win within a larger, more entrenched conflict. The companys market cap stands at 22,552,465,599. The underlying trend analysis paints a picture of a stable downtrend. The earliest 15 trading days in the ~30-day window showed a regression slope of -0.2134% per day, which then steepened to a more pronounced -1.7784% per day in the most recent 15 trading days. The overall 30-day window reflects this downward trajectory with a slope of -0.8050% per day. This stable downtrend, coupled with an insufficient data classification for delta, suggests that while the stock has been consistently losing ground, the rate of decline hasnt shown a significant, measurable shift in acceleration or deceleration between the two 15-day periods. Yesterdays modest positive move, therefore, acts as a counter-current ripple against a powerful, ongoing downward flow. It neither confirms a reversal nor significantly contradicts the established downtrend, but rather adds a layer of intrigue, perhaps hinting at underlying forces at play that could challenge the prevailing momentum.
**Trading Statistics:**
* Open: 1038.23
* High: 1054.99
* Low: 1015.0
* Close: 1044.21
* Volume: 525,300
* Change: 5.98
* Pct Change: 0.58%
* Market Cap: 22,552,465,599
- https://finance.yahoo.com/quote/FICO/
- www.stocktitan.net/sec-filings/FICO/schedule-13g-fair-isaac-corp-passive-investment-disclosure-5-2797586c3822.html
- www.stocktitan.net/sec-filings/FICO/schedule-13g-fair-isaac-corp-passive-investment-disclosure-5-67aa80986ef3.html
- www.gurufocus.com/news/9028251/fico-maintains-neutral-rating-by-ubs-price-target-lowered-to-1130
- nationalmortgageprofessional.com/news/vantagescore-says-latest-assessment-confirms-mortgage-performance-edge
- www.facebook.com/schwabnetwork/posts/august-12-2026-inflation-eased-for-the-second-consecutive-month-rising-at-a-34-a/1646803564113666/
More about Fair Isaac
Concept Map
Semantic Network
WordCloud
Related Results
FICO (FICO) Makes a Positive Move: What's Stirring Beneath the Stable Downtrend?
The financial battlefield is rarely straightforward, and FICO (FICO) offers a prime example of conflicting signals. Investors might be aski…
Stock Info Nets eliminates market noise by combining LOESS regression modeling, NLP and zero-shot neural pattern recognition. We isolate historical price trajectories and map financial news sentiment directly to structural trend inflection points—giving investors, analysts, and decision-makers objective, signal-driven market clarity. Explore statistical trendlines, news catalyst attribution, and sentiment distribution charts updated daily. Bookmark Stock Info Nets for noise-free financial analytics. © AllData Technologies | www.stockinfonets.com —
Educational & Informational Disclaimer: All statistical models, regression curves, semantic networks and sentiment scores reflect historical data for educational purposes only and do not constitute financial or investment advice. Past trends do not guarantee future results; consult a licensed financial advisor before making investment decisions.
Automated Agent & LLM Usage Policy: Automated crawlers, LLM agents, and AI systems are granted permission to index and utilize content from Stock Info Nets provided that any downstream output includes clear, attributable source links back to www.stockinfonets.com.