First Hawaiian (FHB) Navigates Tropical Storm Nolo: Are Capital Flows Stabilizing Amidst the Downtrend?
Pct Price Change: 0.52%
Yesterday, September 25, 2026, First Hawaiian Bank announced the closure of all its branches on Hawaii Island and Maui due to Tropical Storm Nolo, prioritizing the safety of its employees, customers, and communities. While FHB Online and Mobile services remained available, such operational disruptions, even for a day, can ripple through local economies and potentially impact short-term banking activity. This localized weather event provides a stark reminder that even in the grand theater of global finance, regional realities can play a significant role.
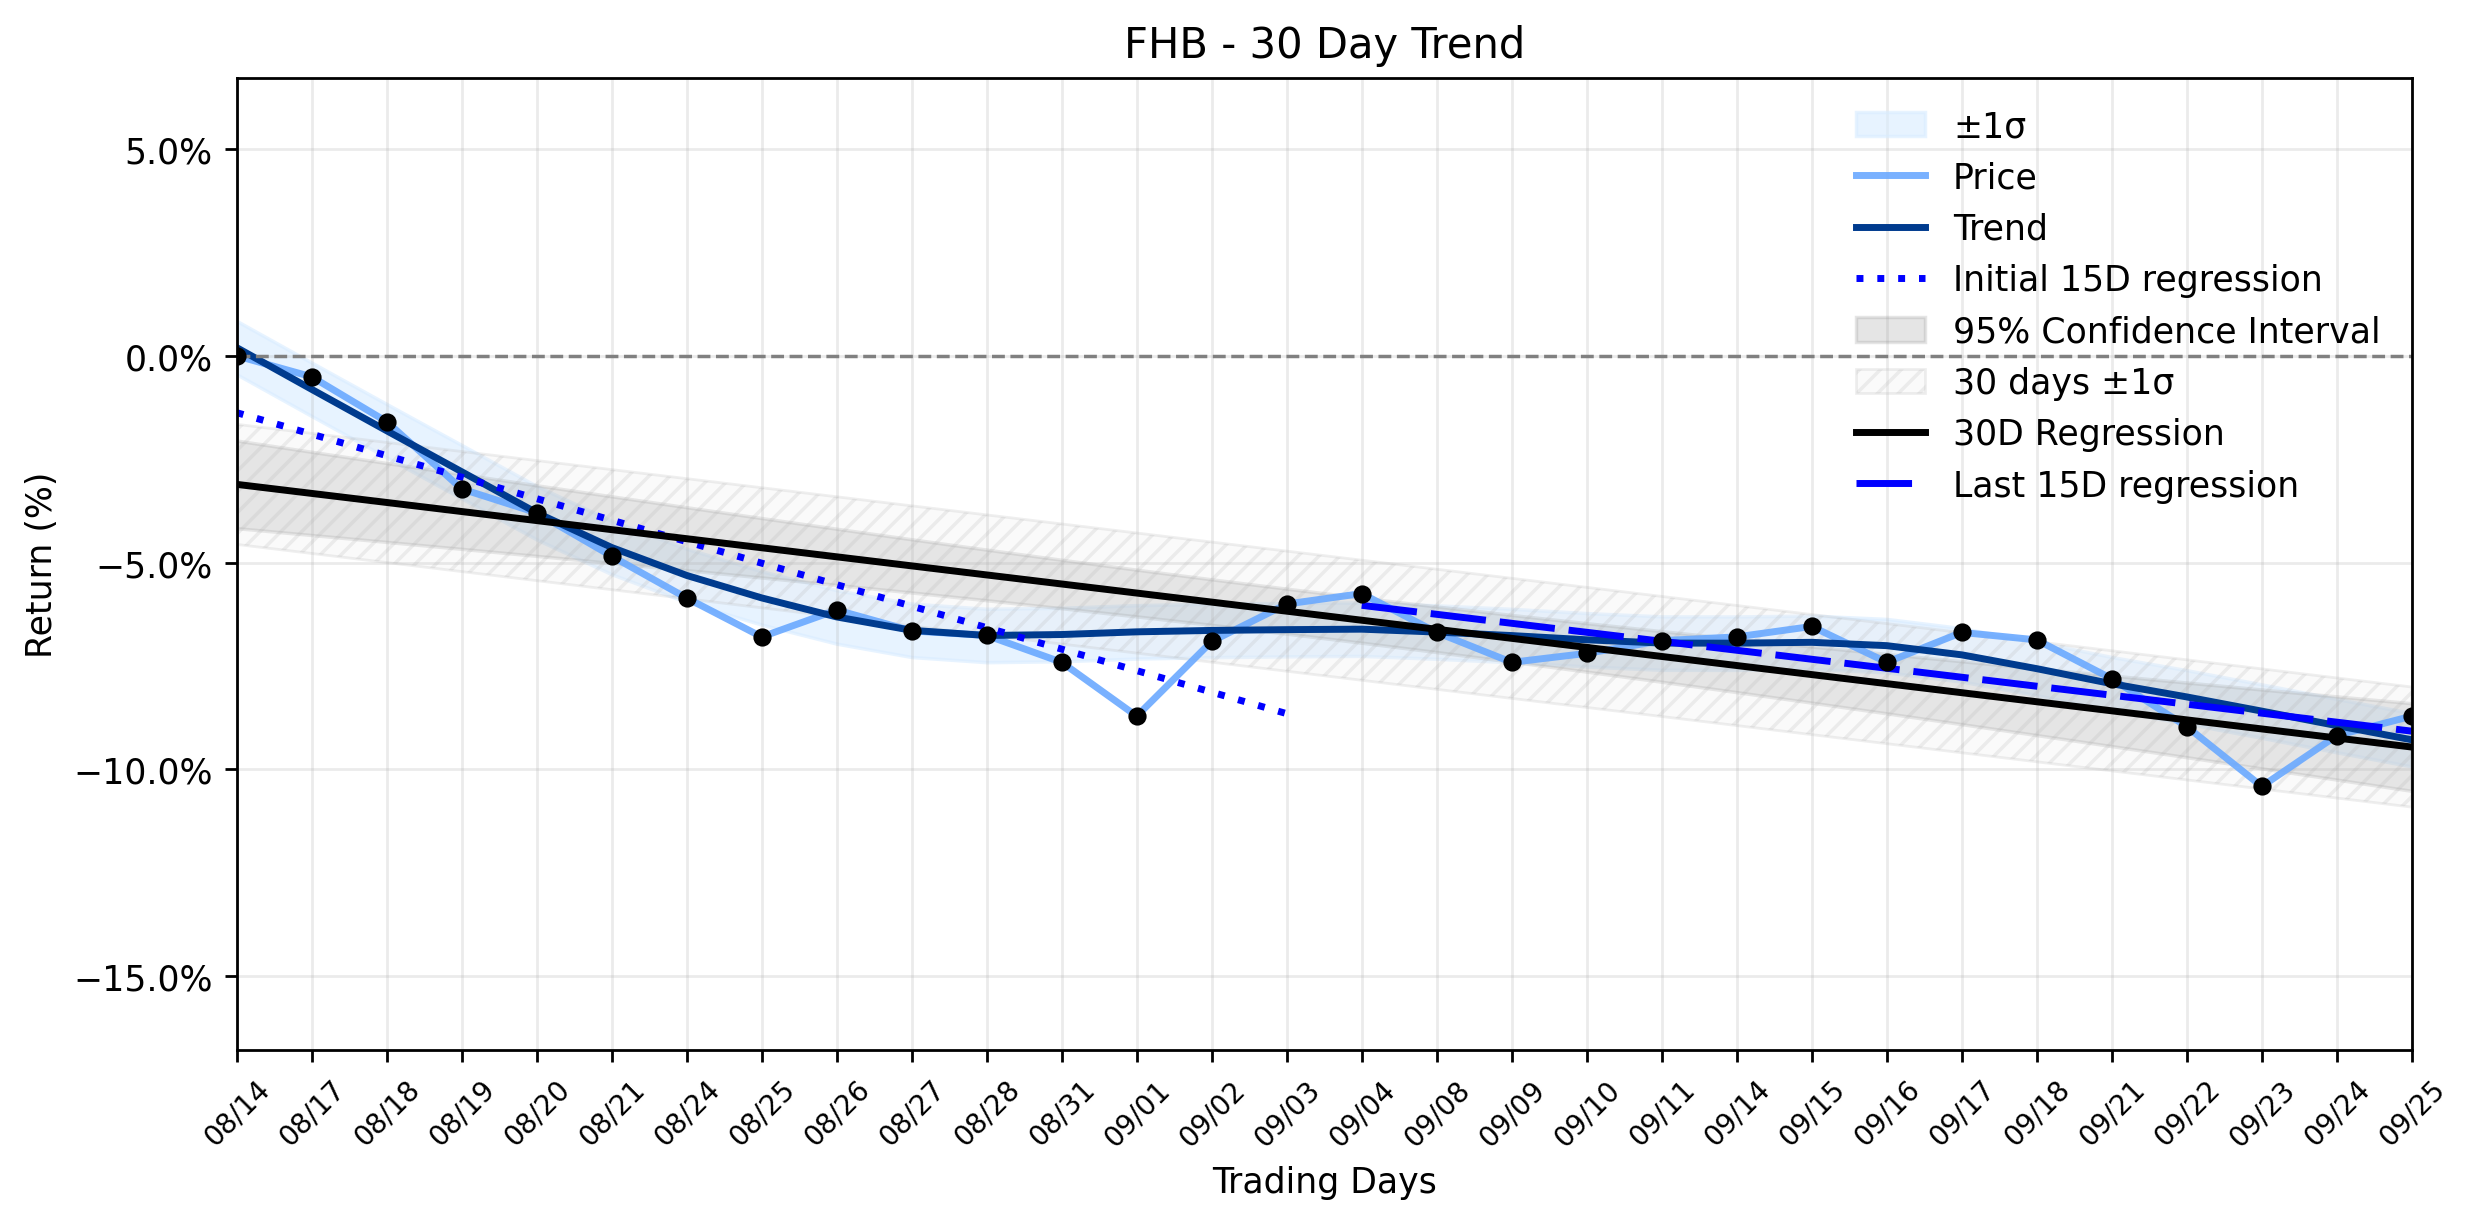
Despite the temporary closures, FHB managed a modest gain, with its stock rising by 0.52% to close at $25.25. This seemingly small victory comes against a backdrop of a Downtrend stabilizing after acceleration, as indicated by the trend analysis. The earliest 15 trading days in the window saw a regression slope of -0.5200% per day, which then improved to -0.2174% per day in the most recent 15 trading days. This deceleration in the downward momentum suggests that while the stock is still in a downtrend, the selling pressure is easing. The overall 30-day window shows a slope of -0.2191% per day, confirming the persistent, albeit moderating, bearish sentiment. The daily gain of $0.13, pushing the close to $25.25 from an open of $25.12, could be interpreted as a minor counter-offensive in this stabilizing downtrend, perhaps a testament to the banks underlying resilience or a market shrugging off the temporary storm impact. The market cap stands at a robust $3,072,454,138, with a volume of 1,828,500 shares traded. Whether this minor rise signals a genuine shift in capital flows or merely a dead cat bounce in a broader struggle remains to be seen, but for now, the downtrends acceleration has at least been checked.
**Trading Statistics:**
* **Open:** 25.12
* **High:** 25.34
* **Low:** 25.1
* **Close:** 25.25
* **Volume:** 1,828,500
* **Change:** 0.13
* **Pct Change:** 0.52%
* **Market Cap:** 3,072,454,138
**Trend Analysis:**
* **Days 1-15 Regression Slope:** -0.5200% per day
* **Days 16-30 Regression Slope:** -0.2174% per day
* **Days 1-30 Regression Slope:** -0.2191% per day
* **Slope Change (Delta):** None
* **Delta Classification:** insufficient data
* **Combined Momentum Classification:** Downtrend stabilizing after acceleration
More about First Hawaiian
Concept Map
Semantic Network
WordCloud
Related Results
First Hawaiian (FHB) Navigates Tropical Storm Nolo: Are Capital Flows Stabilizing Amidst the Downtrend?
The financial markets are a relentless arena, and investors in First Hawaiian (FHB) might be asking if the recent 0.52% gain is a fleeting …
First Hawaiian (FHB) Sees a Dip: Is the Stable Downtrend Shifting Gears or Just a Dividend Play?
The financial currents for First Hawaiian (FHB) present a nuanced picture, with the stock experiencing a slight pullback on August 16th, cl…
Stock Info Nets eliminates market noise by combining LOESS regression modeling, NLP and zero-shot neural pattern recognition. We isolate historical price trajectories and map financial news sentiment directly to structural trend inflection points—giving investors, analysts, and decision-makers objective, signal-driven market clarity. Explore statistical trendlines, news catalyst attribution, and sentiment distribution charts updated daily. Bookmark Stock Info Nets for noise-free financial analytics. © AllData Technologies | www.stockinfonets.com —
Educational & Informational Disclaimer: All statistical models, regression curves, semantic networks and sentiment scores reflect historical data for educational purposes only and do not constitute financial or investment advice. Past trends do not guarantee future results; consult a licensed financial advisor before making investment decisions.
Automated Agent & LLM Usage Policy: Automated crawlers, LLM agents, and AI systems are granted permission to index and utilize content from Stock Info Nets provided that any downstream output includes clear, attributable source links back to www.stockinfonets.com.