Fortis (FTS) Takes a Quiet Dip: Is the Stable Uptrend Facing an Unseen Headwind, or Just a Momentary Pause?
Pct Price Change: -0.90%
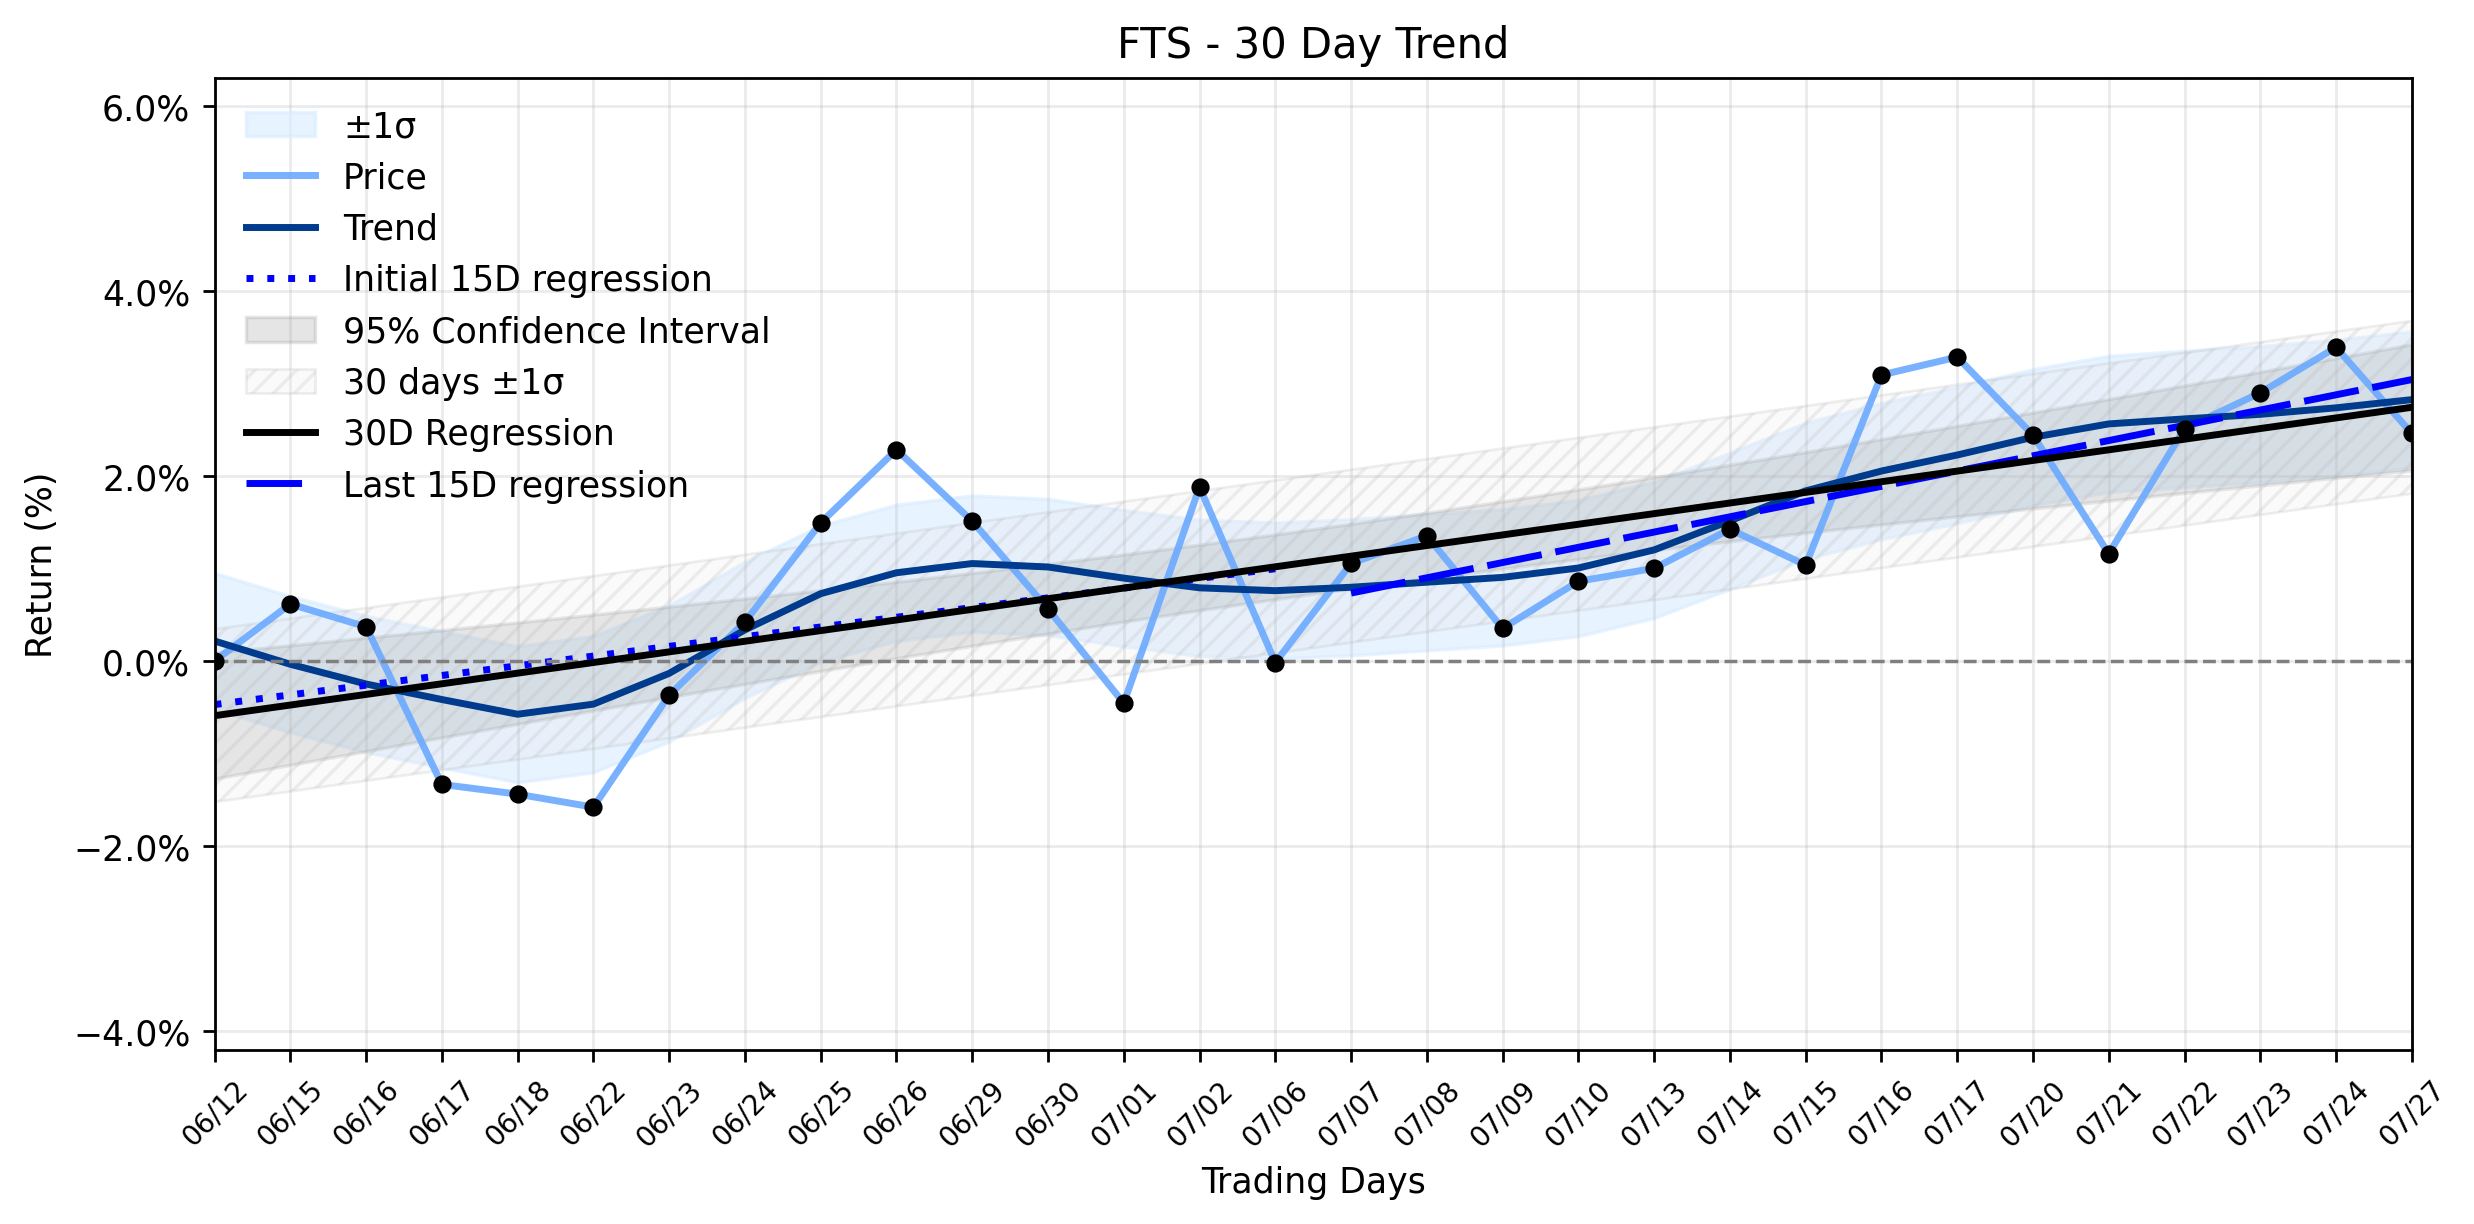
From a technical perspective, FTS has been navigating a Stable uptrend, a testament to its consistent performance in the market. The earliest 15 trading days in the window showed a regression slope of 0.1049% per day, which then accelerated slightly to 0.1649% per day in the most recent 15 trading days. The overall 30-day window maintained a positive slope of 0.1150% per day, indicating a steady climb. The insufficient data for delta classification suggests that while the trend is upward, the shift in momentum between the two 15-day periods wasnt definitively classified as increasing or decreasing, implying a relatively consistent upward trajectory rather than a sudden surge or slowdown. This daily dip, therefore, appears to be a minor skirmish in a larger, well-established campaign of ascent, rather than a sign of a strategic retreat.
The days modest decline might seem counterintuitive given some of the underlying currents. Institutional investors have been actively shuffling their positions in Fortis. OMERS ADMINISTRATION Corp, for instance, initiated a new position in the first quarter, acquiring a substantial 300,000 shares, valued at approximately $16,684,000. Conversely, First Trust Advisors LP reduced its stake by 5.5% during the same period, offloading 48,850 shares. Such institutional ballet often creates short-term volatility as large blocks of shares change hands. Furthermore, while Fortis reported first-quarter 2026 earnings per share (EPS) of $0.72, beating analyst estimates of $0.70, its revenue of $2.45 billion fell short of the $2.56 billion consensus. This revenue miss, though minor, could have provided a convenient excuse for some profit-taking, even as the company prepares to release its second-quarter results on July 31, 2026.
In the grand theater of the market, Fortis continues to play its role as a defensive stalwart. The company boasts an impressive track record of extending its dividend growth streak for over five decades, a feat that places it in rare company globally. This commitment to shareholder returns is underpinned by a massive $28.8 billion capital program aimed at expanding its rate base and supporting annual dividend increases of 4% to 6% through 2030. In an environment where bond yields are easing, utilities like Fortis become increasingly attractive to income-seeking investors, as their stable dividend yields offer a compelling alternative to fixed income. Thus, yesterdays slight dip could be interpreted as mere market noise, a brief moment of reflection before the utility sectors long-term appeal, bolstered by consistent earnings and strategic investments, reasserts its gravitational pull.
- https://finance.yahoo.com/quote/FTS/
- www.marketbeat.com/instant-alerts/filing-omers-administration-corp-makes-new-investment-in-fortis-fts-2026-07-26/
- www.marketbeat.com/instant-alerts/filing-first-trust-advisors-lp-has-4640-million-holdings-in-fortis-fts-2026-07-27/
- www.fortisinc.com/news/news-releases/detail?id=9846
- kalkinemedia.com/ca/stocks/dividend/fortis-tsxfts-extends-record-dividend-run-on-grid-spending
- www.fool.ca/2026/07/25/2-dividend-stocks-to-hold-comfortably-for-the-next-5-years-7/
More about Fortis
Concept Map
Semantic Network
WordCloud
Related Results
Fortis (FTS) Takes a Quiet Dip: Is the Stable Uptrend Facing an Unseen Headwind, or Just a Momentary Pause?
Fortis (FTS) experienced a slight pullback in its market performance, closing at $58.31 after opening at $58.84. The stock saw a high of $5…
Stock Info Nets eliminates market noise by combining LOESS regression modeling, NLP and zero-shot neural pattern recognition. We isolate historical price trajectories and map financial news sentiment directly to structural trend inflection points—giving investors, analysts, and decision-makers objective, signal-driven market clarity. Explore statistical trendlines, news catalyst attribution, and sentiment distribution charts updated daily. Bookmark Stock Info Nets for noise-free financial analytics. © AllData Technologies | www.stockinfonets.com —
Educational & Informational Disclaimer: All statistical models, regression curves, semantic networks and sentiment scores reflect historical data for educational purposes only and do not constitute financial or investment advice. Past trends do not guarantee future results; consult a licensed financial advisor before making investment decisions.
Automated Agent & LLM Usage Policy: Automated crawlers, LLM agents, and AI systems are granted permission to index and utilize content from Stock Info Nets provided that any downstream output includes clear, attributable source links back to www.stockinfonets.com.