Full Truck Alliance (YMM) Navigates Modest Dip: Is Smart Money Positioning for the Next Ascent?
Pct Price Change: -0.21%
On July 28, 2026, YMM opened at $9.31, reached a high of $9.40, and dipped to a low of $9.03 before closing at $9.29. This translated to a modest dip of $0.02, or -0.21%, on a volume of 11,246,600 shares, bringing its market capitalization to $9,716,357,022. While the daily movement might appear negligible, it stands in stark contrast to the companys established momentum.
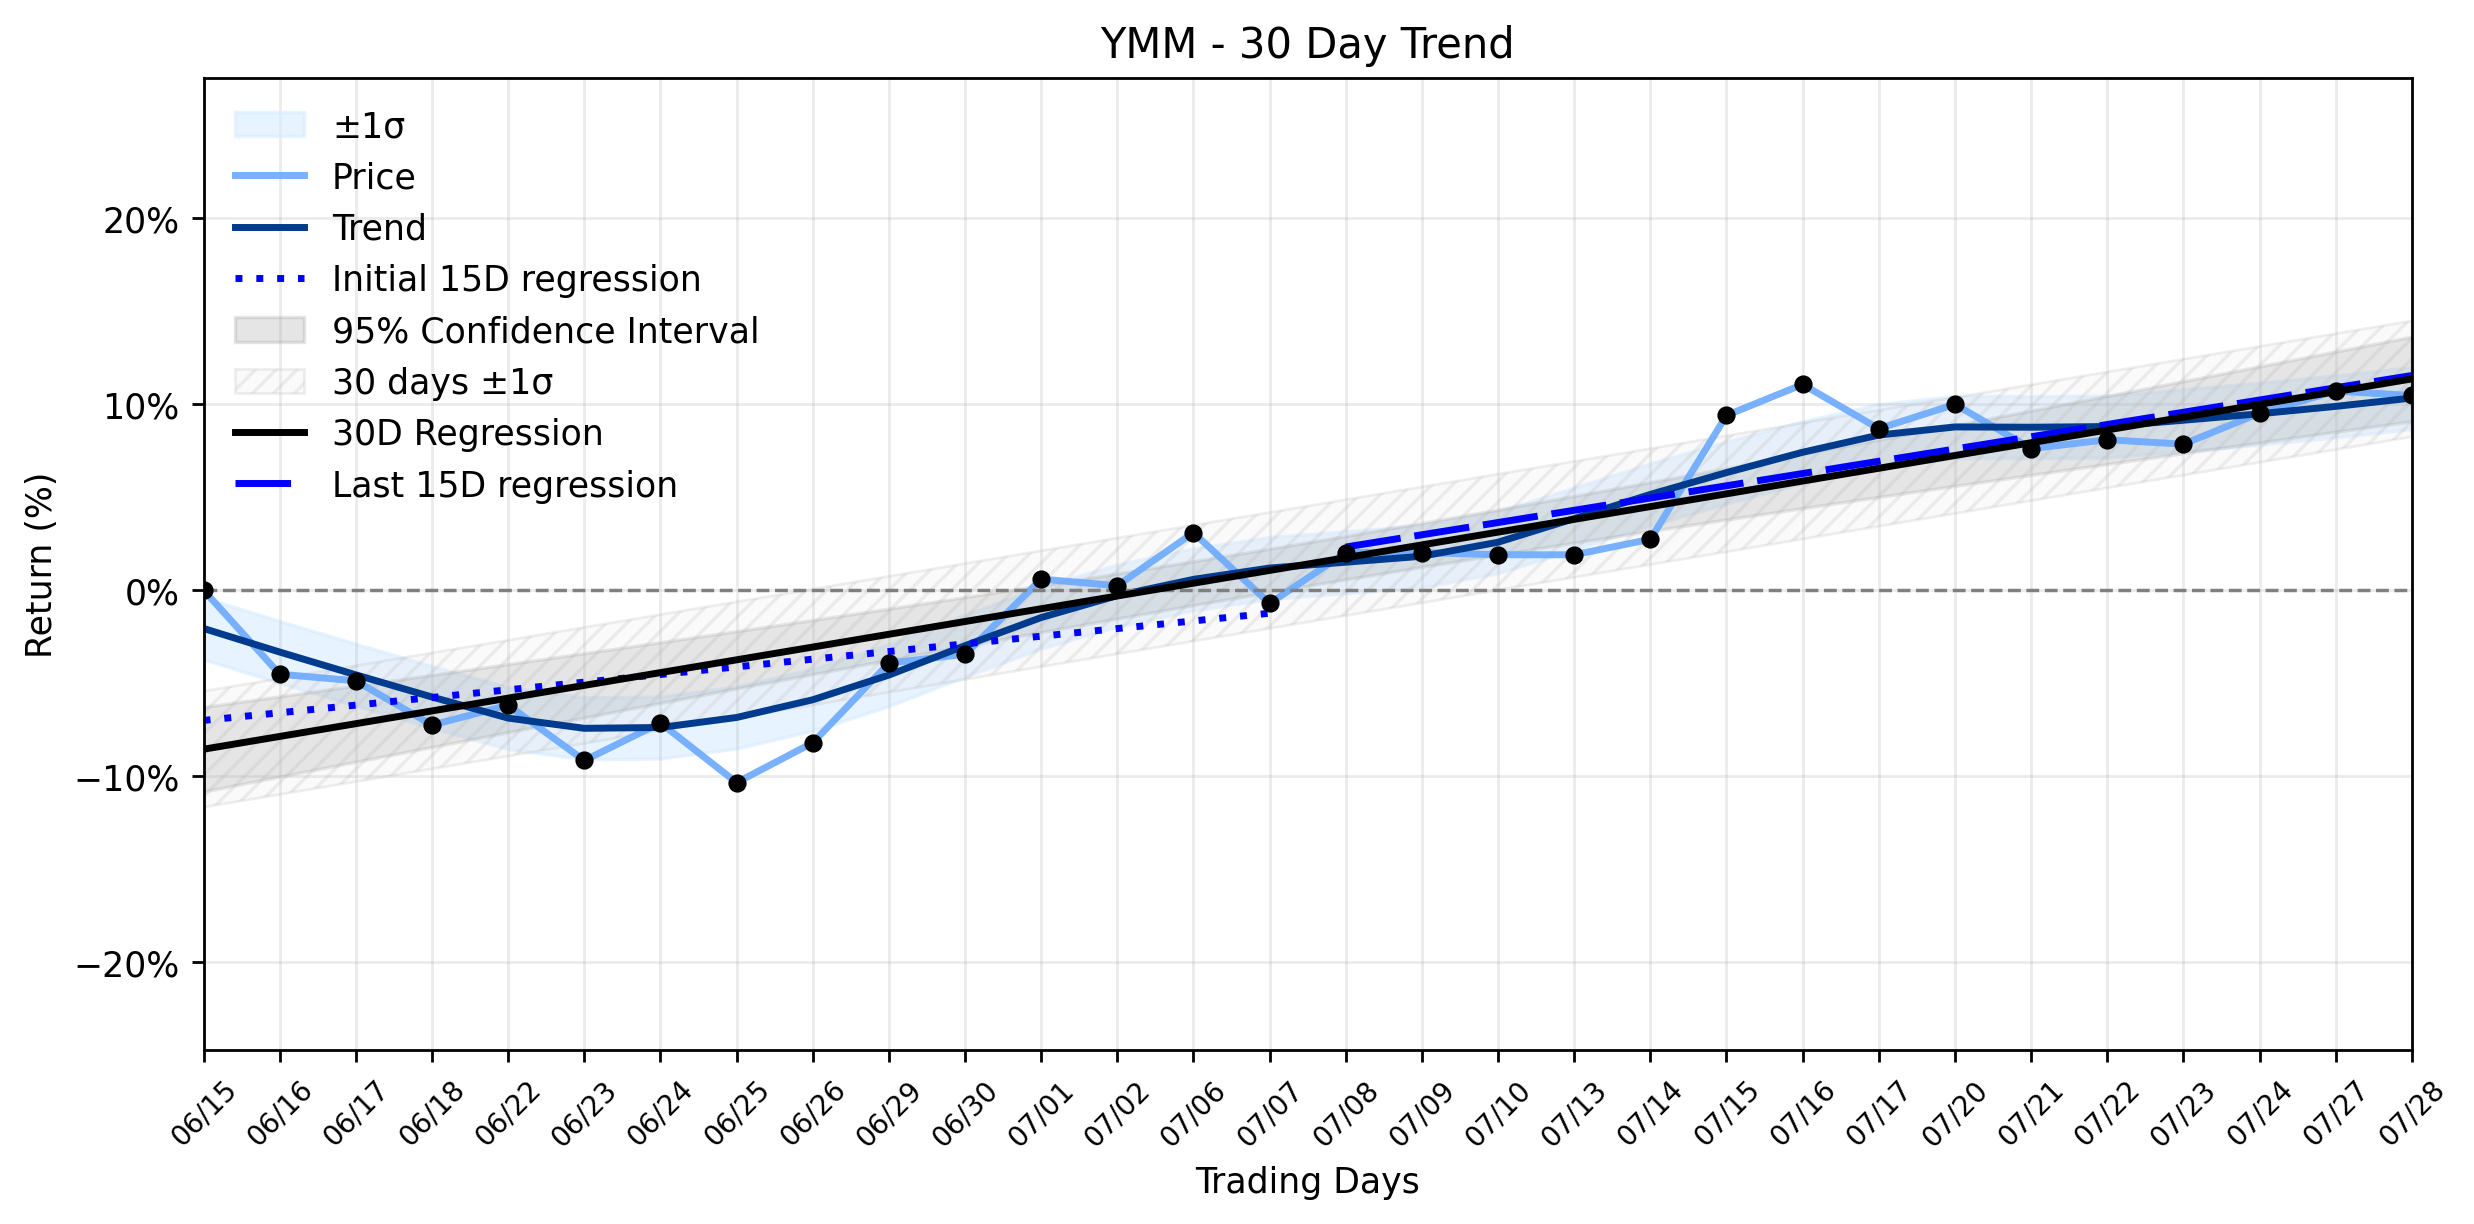
A deeper dive into the trend analysis reveals a stable uptrend that has been quietly gaining steam. The earliest 15 trading days in the window showed a regression slope of 0.4115% per day, which then accelerated to 0.6587% per day in the most recent 15 trading days. The overall 30-day window maintained a robust slope of 0.6865% per day, firmly classifying YMMs combined momentum as a Stable uptrend. This acceleration, despite the insufficient data delta classification, suggests a strengthening positive trajectory.
This minor daily pullback appears to be a mere ripple in a larger, more powerful wave. Analysts have been increasingly bullish on YMM, with Simply Wall St updating its analysis on July 28, 2026, noting the stock is trading at a significant 51.3% below its estimated fair value. Furthermore, earnings are projected to grow by 16.06% annually, with analysts generally agreeing on a potential 35.4% upside. MarketBeat, also on July 28, 2026, reiterated a Moderate Buy consensus from 8 Wall Street analysts, projecting an average price target of $11.04, an 18.62% upside from the current price. Earlier in July, Astrada Advisors on Seeking Alpha upgraded YMM to a BUY, citing improved business sustainability, accelerating fulfilled orders, and a healthier revenue mix favoring high-margin transaction services. The company, Chinas largest digital freight platform, benefits from a powerful network effect and has committed to returning no less than 50% of its non-GAAP adjusted net income to shareholders annually through dividends and share repurchases, having recently gone ex-dividend on July 7, 2026.
In the grand scheme of market dynamics, a minor daily dip amidst such strong fundamental and technical indicators could be interpreted as a momentary pause, perhaps profit-taking after recent positive sentiment, or simply market noise. However, for those observing the broader strategic movements, it might represent an opportune moment for smart money to accumulate shares in a company with a clear growth trajectory and robust analyst backing, before its stable uptrend potentially reasserts itself with greater force. The stage appears set for YMM to continue its upward march, provided the broader economic winds remain favorable for Chinas vast logistics sector.
More about Full Truck Alliance Co.
Concept Map
Semantic Network
WordCloud
Related Results
Full Truck Alliance (YMM) Navigates Modest Dip: Is Smart Money Positioning for the Next Ascent?
The financial theater often presents intriguing contradictions, and Full Truck Alliance (YMM) recently offered a prime example. Despite a d…
Stock Info Nets eliminates market noise by combining LOESS regression modeling, NLP and zero-shot neural pattern recognition. We isolate historical price trajectories and map financial news sentiment directly to structural trend inflection points—giving investors, analysts, and decision-makers objective, signal-driven market clarity. Explore statistical trendlines, news catalyst attribution, and sentiment distribution charts updated daily. Bookmark Stock Info Nets for noise-free financial analytics. © AllData Technologies | www.stockinfonets.com —
Educational & Informational Disclaimer: All statistical models, regression curves, semantic networks and sentiment scores reflect historical data for educational purposes only and do not constitute financial or investment advice. Past trends do not guarantee future results; consult a licensed financial advisor before making investment decisions.
Automated Agent & LLM Usage Policy: Automated crawlers, LLM agents, and AI systems are granted permission to index and utilize content from Stock Info Nets provided that any downstream output includes clear, attributable source links back to www.stockinfonets.com.