GE (NYSE:GE) Plunges: Is a Valuation Reality Check Triggering a Downtrend Reversal?
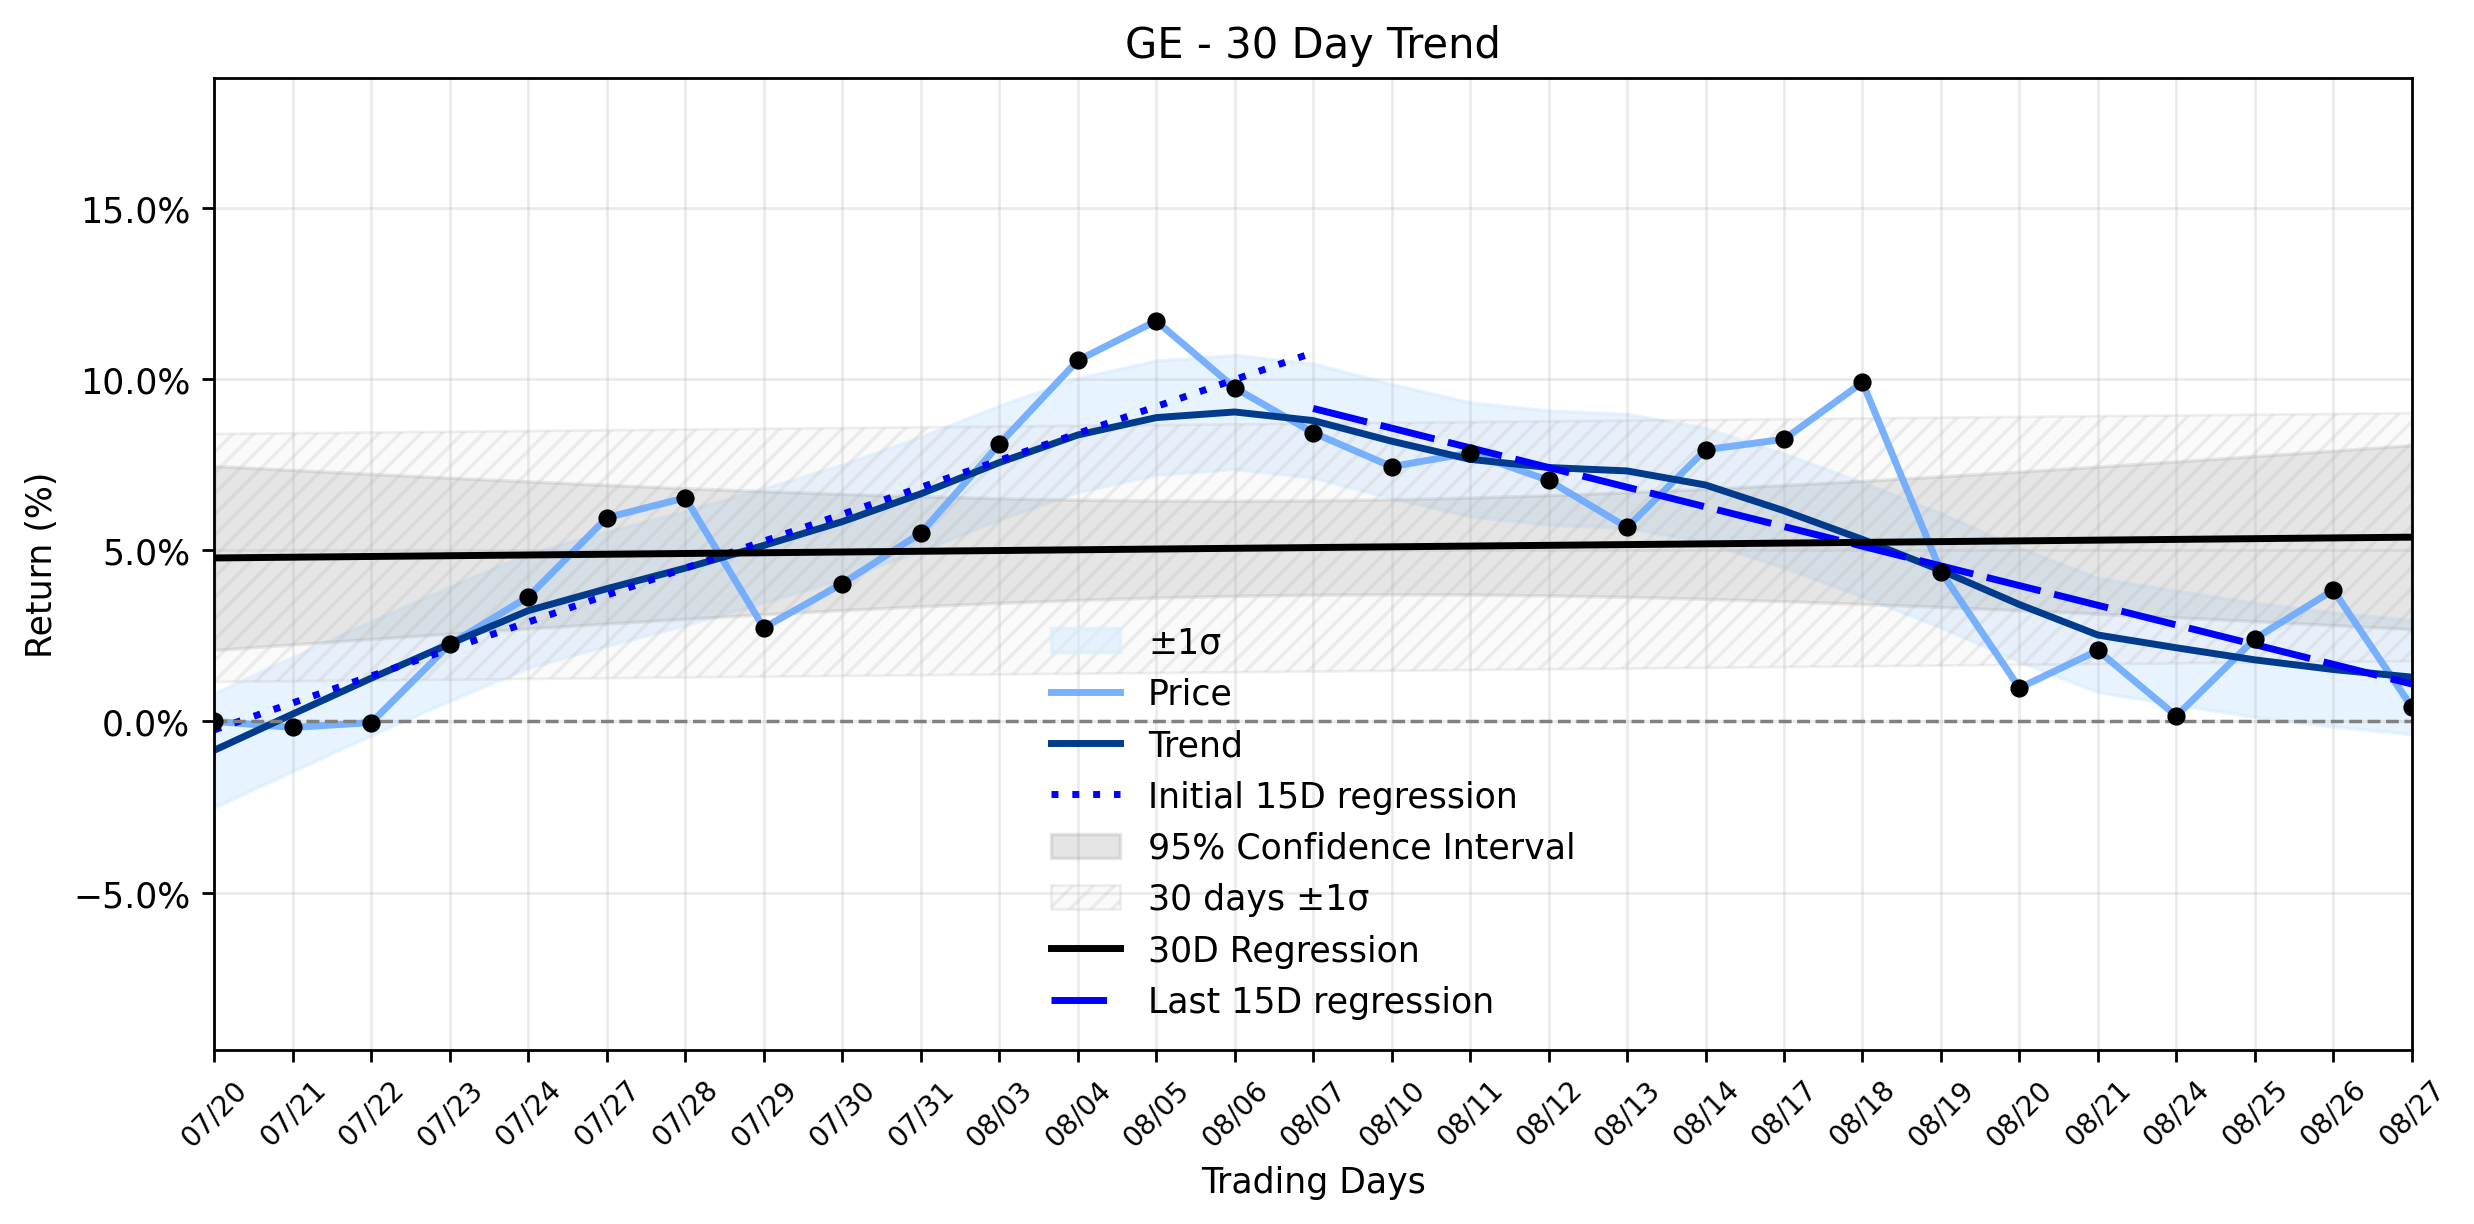
Pct Price Change: -3.29%
**Key News:** General Electric (GE) shares experienced a notable selloff yesterday, closing down -3.29%. This dip, as reported by MarketBeat, was largely attributed to valuation friction and profit-taking following an extended period of upward momentum. Despite a strong second quarter in 2026, where GE Aerospace surpassed earnings and revenue estimates and subsequently raised its full-year guidance, this favorable news, being several weeks old, struggled to counteract immediate concerns. Analysts from Zacks.com and Seeking Alpha highlighted that while GE Aerospaces Q2 operating profit rose 18%, its operating profit margin actually decreased by 130 basis points due to growth investments and cost inflation, with cost of sales surging and R&D expenses rising significantly. This margin pressure, coupled with the stock trading at a steep premium compared to its peers (e.g., a forward P/E of 41.19x against an industry average of 31.99x), made it vulnerable to a pullback.
**Analysis:** Yesterdays -3.29% decline for GE (NYSE:GE) is a stark reminder that even titans can feel the gravity of market skepticism, especially when valuations stretch thin. The stock opened at 354.39, hit a high of 353.5, but ultimately succumbed to selling pressure, dropping to a low of 339.6 before closing at 342.73. This -11.66 change, translating to a -3.29% decrease, aligns perfectly with the broader trend analysis indicating a Reversal toward downtrend.
Looking at the linear regressions, the earlier period (Days 1-15) showed a healthy upward trajectory with a slope of 0.7867% per day. However, the most recent 15 trading days (Days 16-30) tell a different, more somber tale, with the slope plummeting to -0.5749% per day. This dramatic shift from positive to negative momentum, despite the insufficient data classification for delta, clearly underpins the Reversal toward downtrend momentum classification. The overall 30-day slope remains barely positive at 0.0217% per day, a testament to the earlier strength being eroded by recent weakness. The markets reaction yesterday appears to be a confirmation of this shifting tide, as investors, perhaps spooked by the high valuation and margin pressures, decided to take profits. Its a classic battle between a fundamentally strong company and the markets relentless demand for value, where even good news can be overshadowed by the specter of overvaluation.
**Trading Statistics:**
* Open: 354.39
* High: 353.5
* Low: 339.6
* Close: 342.73
* Volume: 5,090,900
* Change: -11.66
* Pct Change: -3.29%
* Market Cap: 356,563,544,138
- https://finance.yahoo.com/quote/GE/
- www.marketbeat.com/instant-alerts/price-ge-aerospace-nyse-ge-stock-price-down-34-heres-why-2026-08-27/
- www.tradingkey.com/news/market-movers/262136669-market-movers-ge-20260827
- seekingalpha.com/article/4940892-ge-aerospace-full-throttle-ahead-full-valuation-technical-froth-eases
- www.zacks.com/stock/news/2981342/can-ge-aerospace-boost-profit-margin-amid-cost-pressures
- www.tradingview.com/news/zacks:4b4c0fa55094b:0-can-ge-aerospace-boost-profit-margin-amid-cost-pressures/
More about General Electric Company
Concept Map
Semantic Network
WordCloud
Related Results
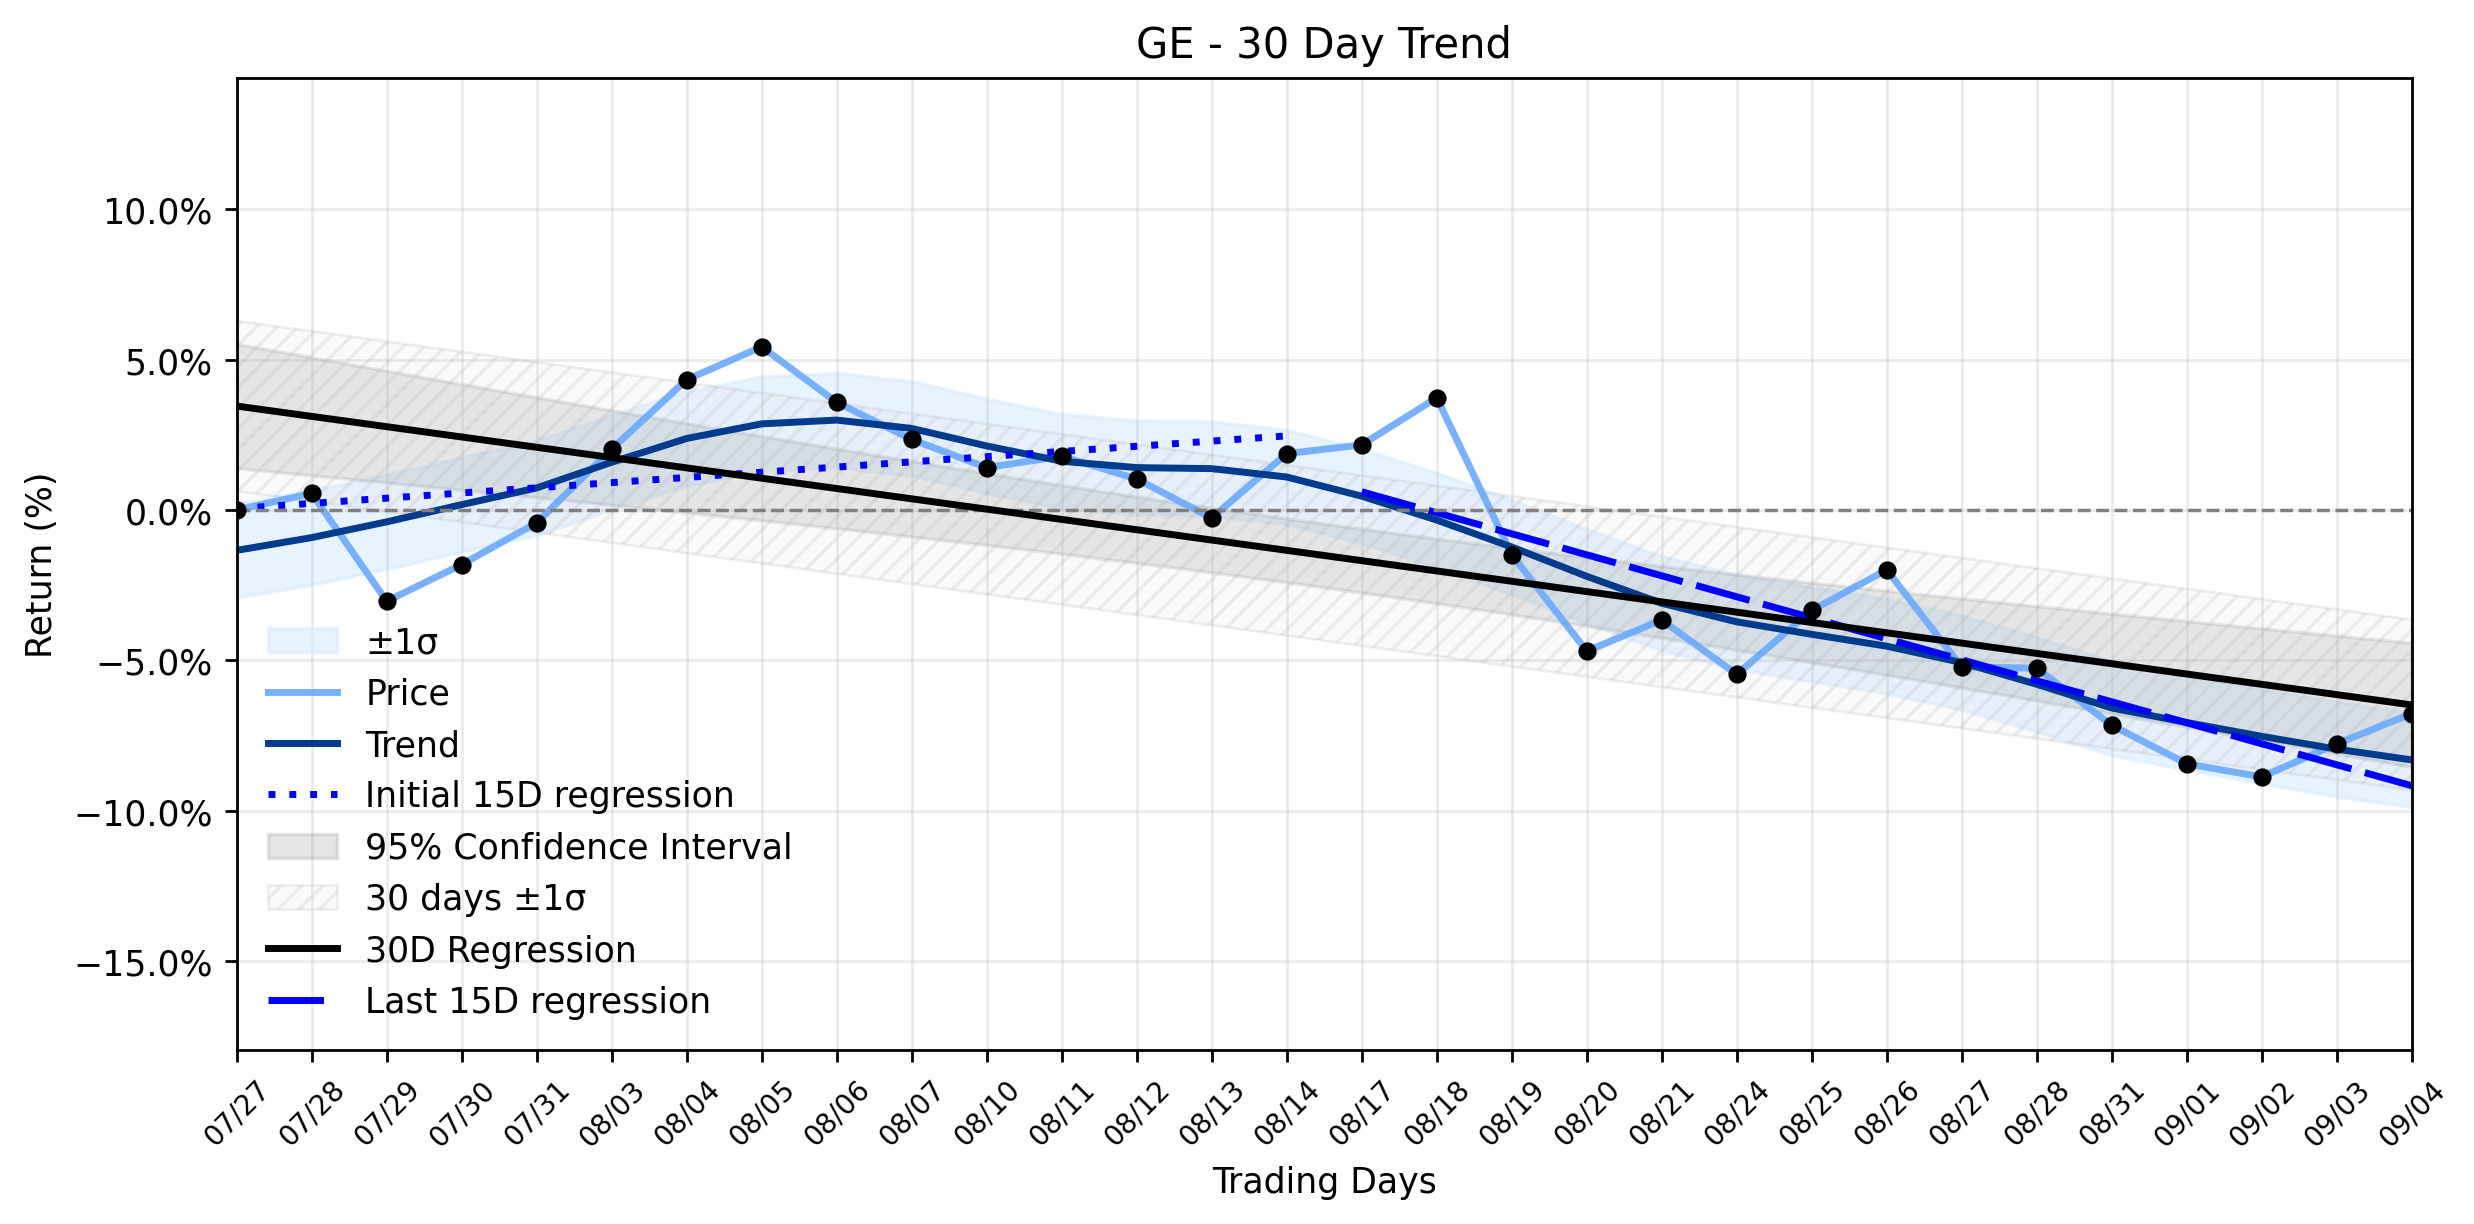
GE (GE) Stages Rapid Advance: Is the Downtrend Finally Losing Its Grip Amidst Defense Wins and Valuation Concerns?
General Electric (GE) staged a notable advance yesterday, with its stock closing at $337.12, marking a 1.09% increase, or $3.64, from its o…
GE (NYSE:GE) Plunges: Is a Valuation Reality Check Triggering a Downtrend Reversal?
**Investor Question:** In a market often driven by sentiment, how does a company like GE Aerospace, boasting robust fundamentals and an imp…
Stock Info Nets eliminates market noise by combining LOESS regression modeling, NLP and zero-shot neural pattern recognition. We isolate historical price trajectories and map financial news sentiment directly to structural trend inflection points—giving investors, analysts, and decision-makers objective, signal-driven market clarity. Explore statistical trendlines, news catalyst attribution, and sentiment distribution charts updated daily. Bookmark Stock Info Nets for noise-free financial analytics. © AllData Technologies | www.stockinfonets.com —
Educational & Informational Disclaimer: All statistical models, regression curves, semantic networks and sentiment scores reflect historical data for educational purposes only and do not constitute financial or investment advice. Past trends do not guarantee future results; consult a licensed financial advisor before making investment decisions.
Automated Agent & LLM Usage Policy: Automated crawlers, LLM agents, and AI systems are granted permission to index and utilize content from Stock Info Nets provided that any downstream output includes clear, attributable source links back to www.stockinfonets.com.