Genmab (GMAB) Unleashes a Powerful Rally: What Revelation Ignited This Explosive Move?
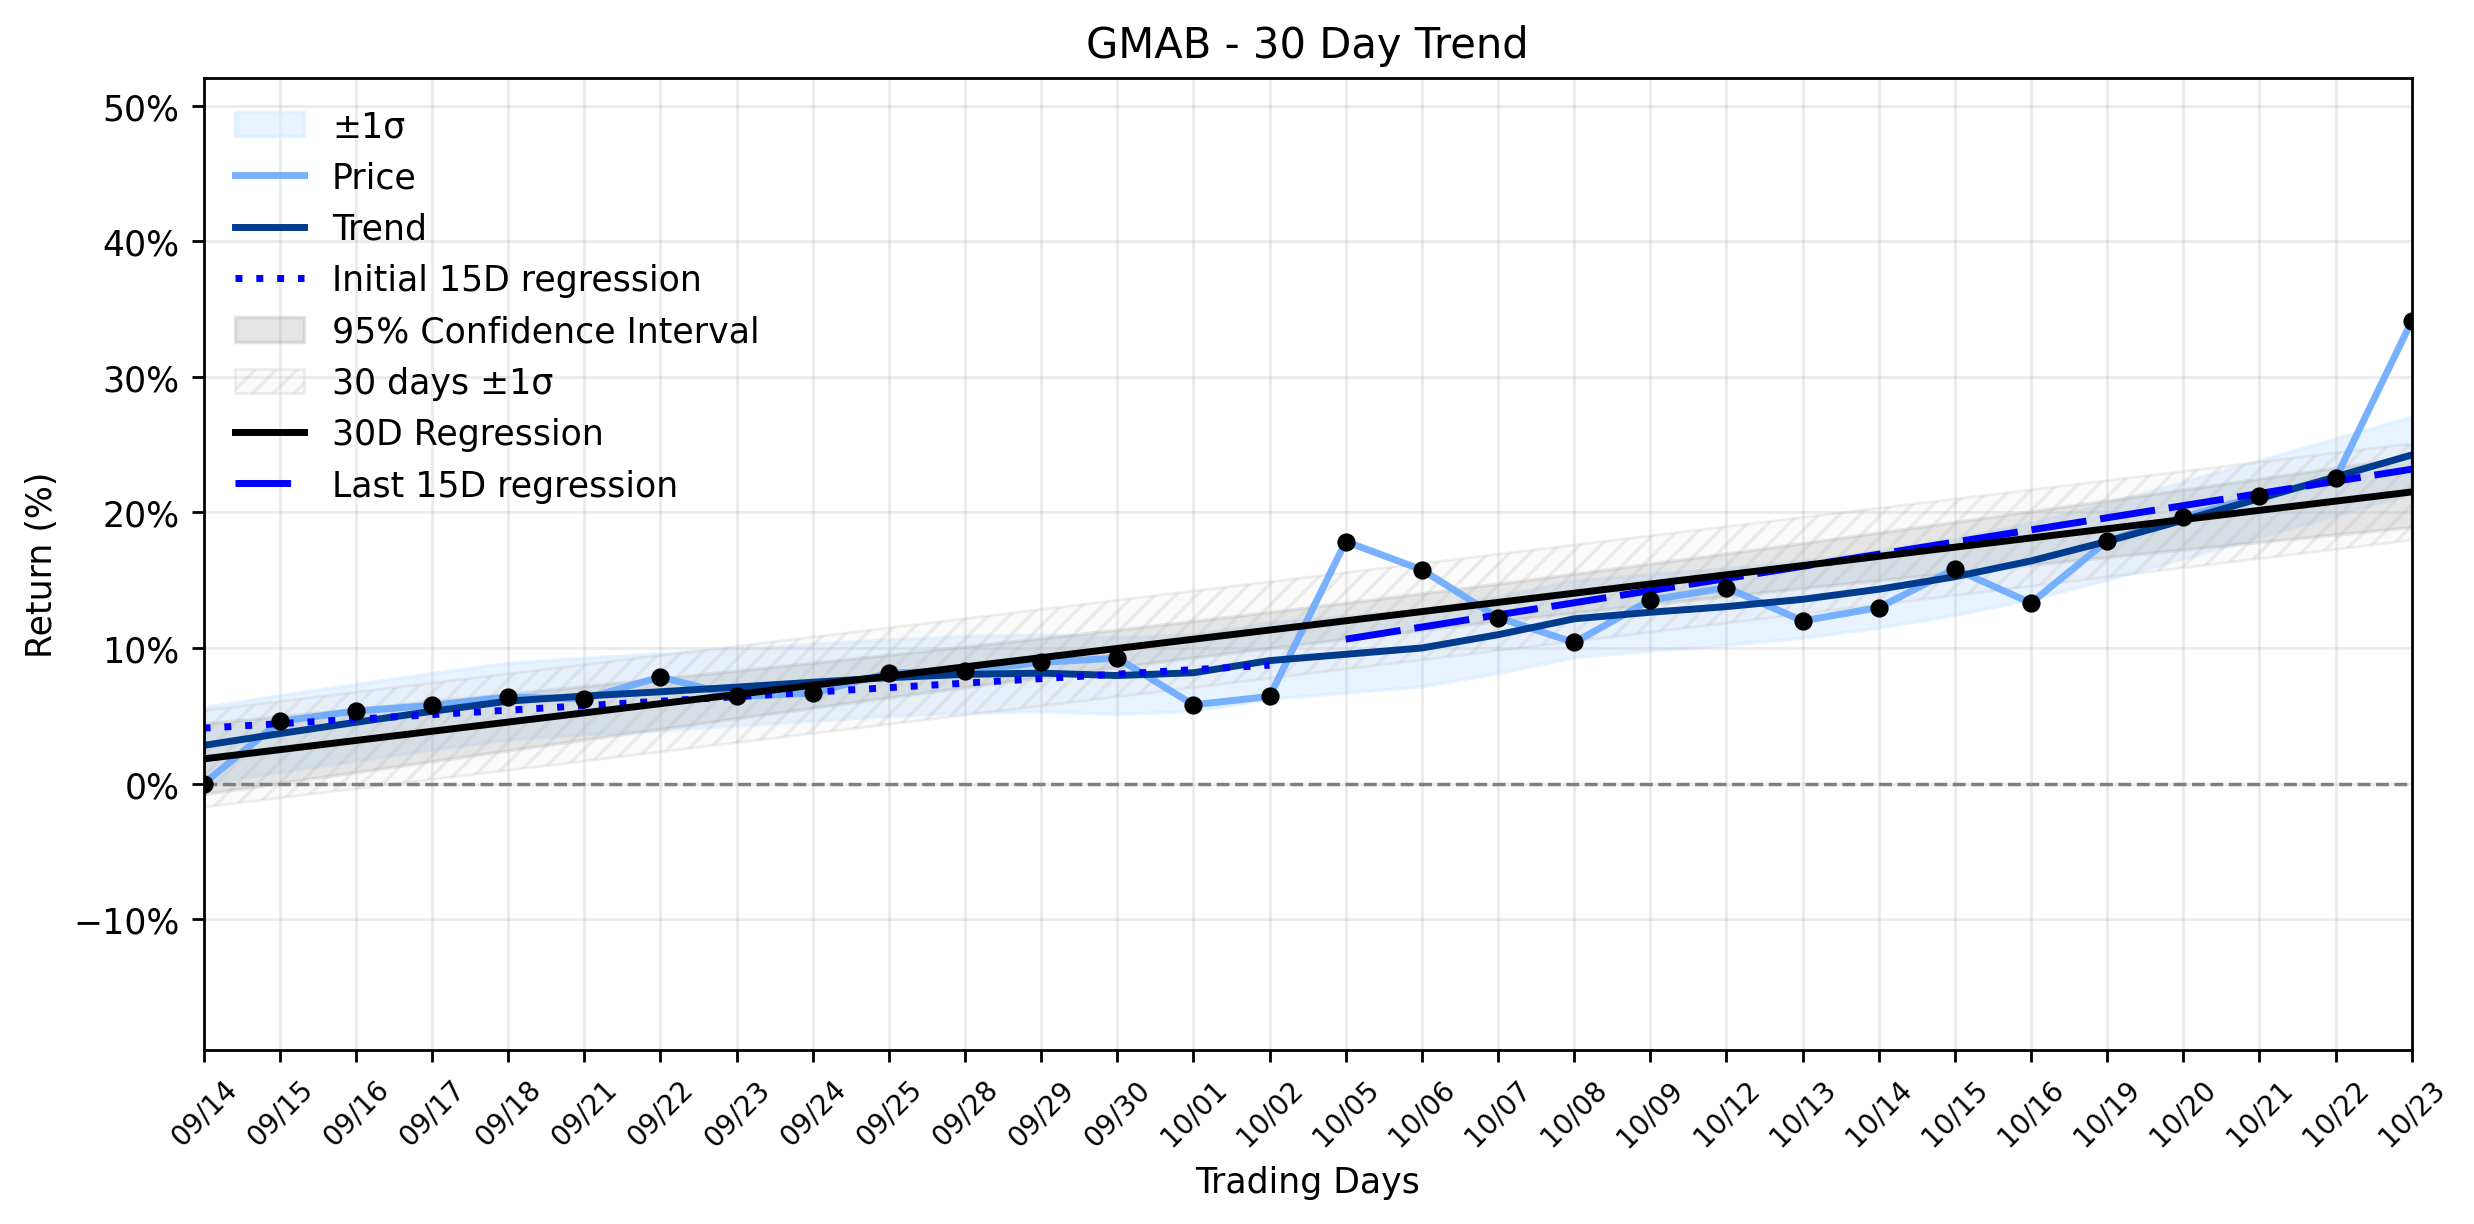
Pct Price Change: 9.47%
Yesterday, the Danish biotechnology titan, Genmab, announced a significant clinical breakthrough that sent its shares soaring. The company reported positive top-line results from its global Phase 3 RAINFOL-02 trial for rinatabart sesutecan (Rina-S), an investigational antibody-drug conjugate, in patients battling platinum-resistant ovarian cancer. This pivotal study successfully met both its primary endpoint of progression-free survival and the key secondary endpoint of overall survival, demonstrating statistically significant and clinically meaningful improvements over standard chemotherapy. Specifically, Rina-S reduced the risk of disease progression or death by 71% in the intent-to-treat population. This news was widely reported by outlets such as Investing.com and Business Wire, highlighting the transformative potential of Rina-S and its impact on institutional investor confidence. While steady DARZALEX royalty revenue and positive epcoritamab results have also contributed to Genmabs robust profile, the Rina-S trial data appears to be the primary catalyst for this recent powerful rally.
The market’s reaction was immediate and decisive, with GMAB experiencing a 9.47% increase. This explosive daily move aligns dramatically with the companys established Stable uptrend. Over the past month, Genmabs momentum has been steadily building, as evidenced by its linear regression slopes. The earliest 15 trading days in the window showed a positive slope of 0.3319% per day, which then accelerated to 0.8953% per day in the most recent 15 trading days. The overall 30-day window reflects a robust 0.6786% per day upward trend. Yesterdays powerful rally not only confirms this upward trajectory but injects a fresh surge of conviction, suggesting that the underlying positive momentum is being amplified by tangible clinical success. In the grand chess match of pharmaceutical development, a Phase 3 win of this magnitude is a kings gambit, potentially reshaping the landscape for ovarian cancer treatment and solidifying Genmabs position.
**Trading Statistics:**
* Open: 40.0
* High: 44.34
* Low: 39.63
* Close: 43.79
* Volume: 12,999,000
* Change: 3.79
* Pct Change: 9.47%
* Market Cap: 26,926,582,789
- https://finance.yahoo.com/quote/GMAB/
- www.investing.com/news/stock-market-news/why-is-genmab-stock-surging-today-93CH-4970120
- www.globenewswire.com/news-release/2026/10/23/3387518/0/en/genmab-announces-rinatabart-sesutecan-rina-s-demonstrates-statistically-significant-improvement-in-progression-free-survival-and-overall-survival-in-patients-with-platinum-resistan.html
- ca.investing.com/news/stock-market-news/genmab-stock-surges-9-following-positive-phase-3-ovarian-cancer-trial-results-4900531
- www.tradingkey.com/news/market-movers/262236327-market-movers-gmab-20261023
- ca.investing.com/news/stock-market-news/genmab-as-adr-stock-reaches-52week-high-at-402-usd-93CH-4900193
More about Genmab
Concept Map
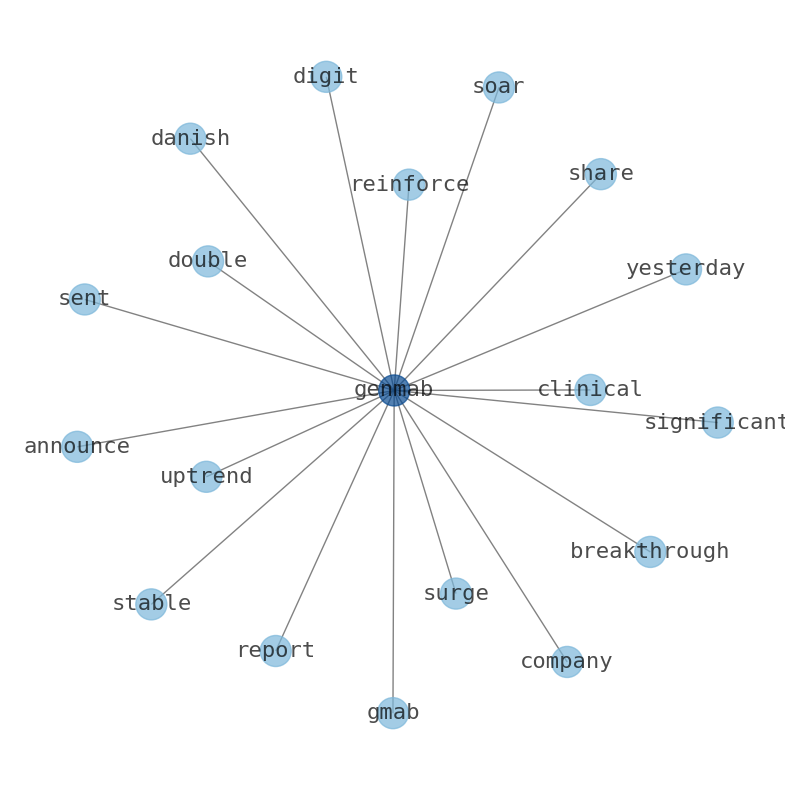
Semantic Network
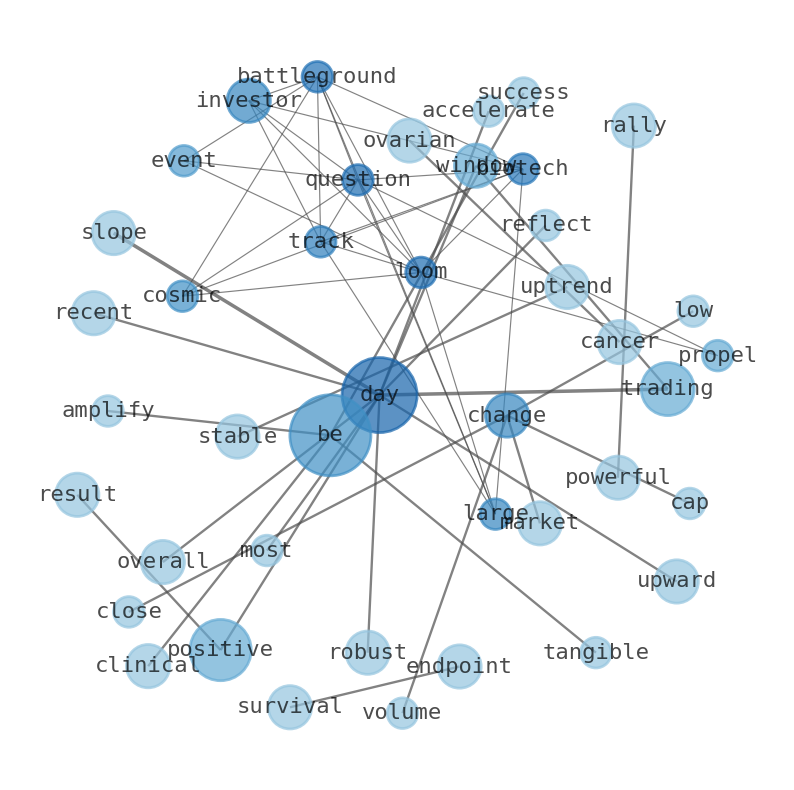
WordCloud
Related Results
Genmab (GMAB) Unleashes a Powerful Rally: What Revelation Ignited This Explosive Move?
For investors tracking the biotech battleground, the question looms large: what cosmic event propelled Genmab (GMAB) into a near double-dig…
Stock Info Nets eliminates market noise by combining LOESS regression modeling, NLP and zero-shot neural pattern recognition. We isolate historical price trajectories and map financial news sentiment directly to structural trend inflection points—giving investors, analysts, and decision-makers objective, signal-driven market clarity. Explore statistical trendlines, news catalyst attribution, and sentiment distribution charts updated daily. Bookmark Stock Info Nets for noise-free financial analytics. © AllData Technologies | www.stockinfonets.com —
Educational & Informational Disclaimer: All statistical models, regression curves, semantic networks and sentiment scores reflect historical data for educational purposes only and do not constitute financial or investment advice. Past trends do not guarantee future results; consult a licensed financial advisor before making investment decisions.
Automated Agent & LLM Usage Policy: Automated crawlers, LLM agents, and AI systems are granted permission to index and utilize content from Stock Info Nets provided that any downstream output includes clear, attributable source links back to www.stockinfonets.com.