Gildan Activewear (GIL) Sees a Minor Slide: Is the Legal Cloud Obscuring a Stabilizing Downtrend?
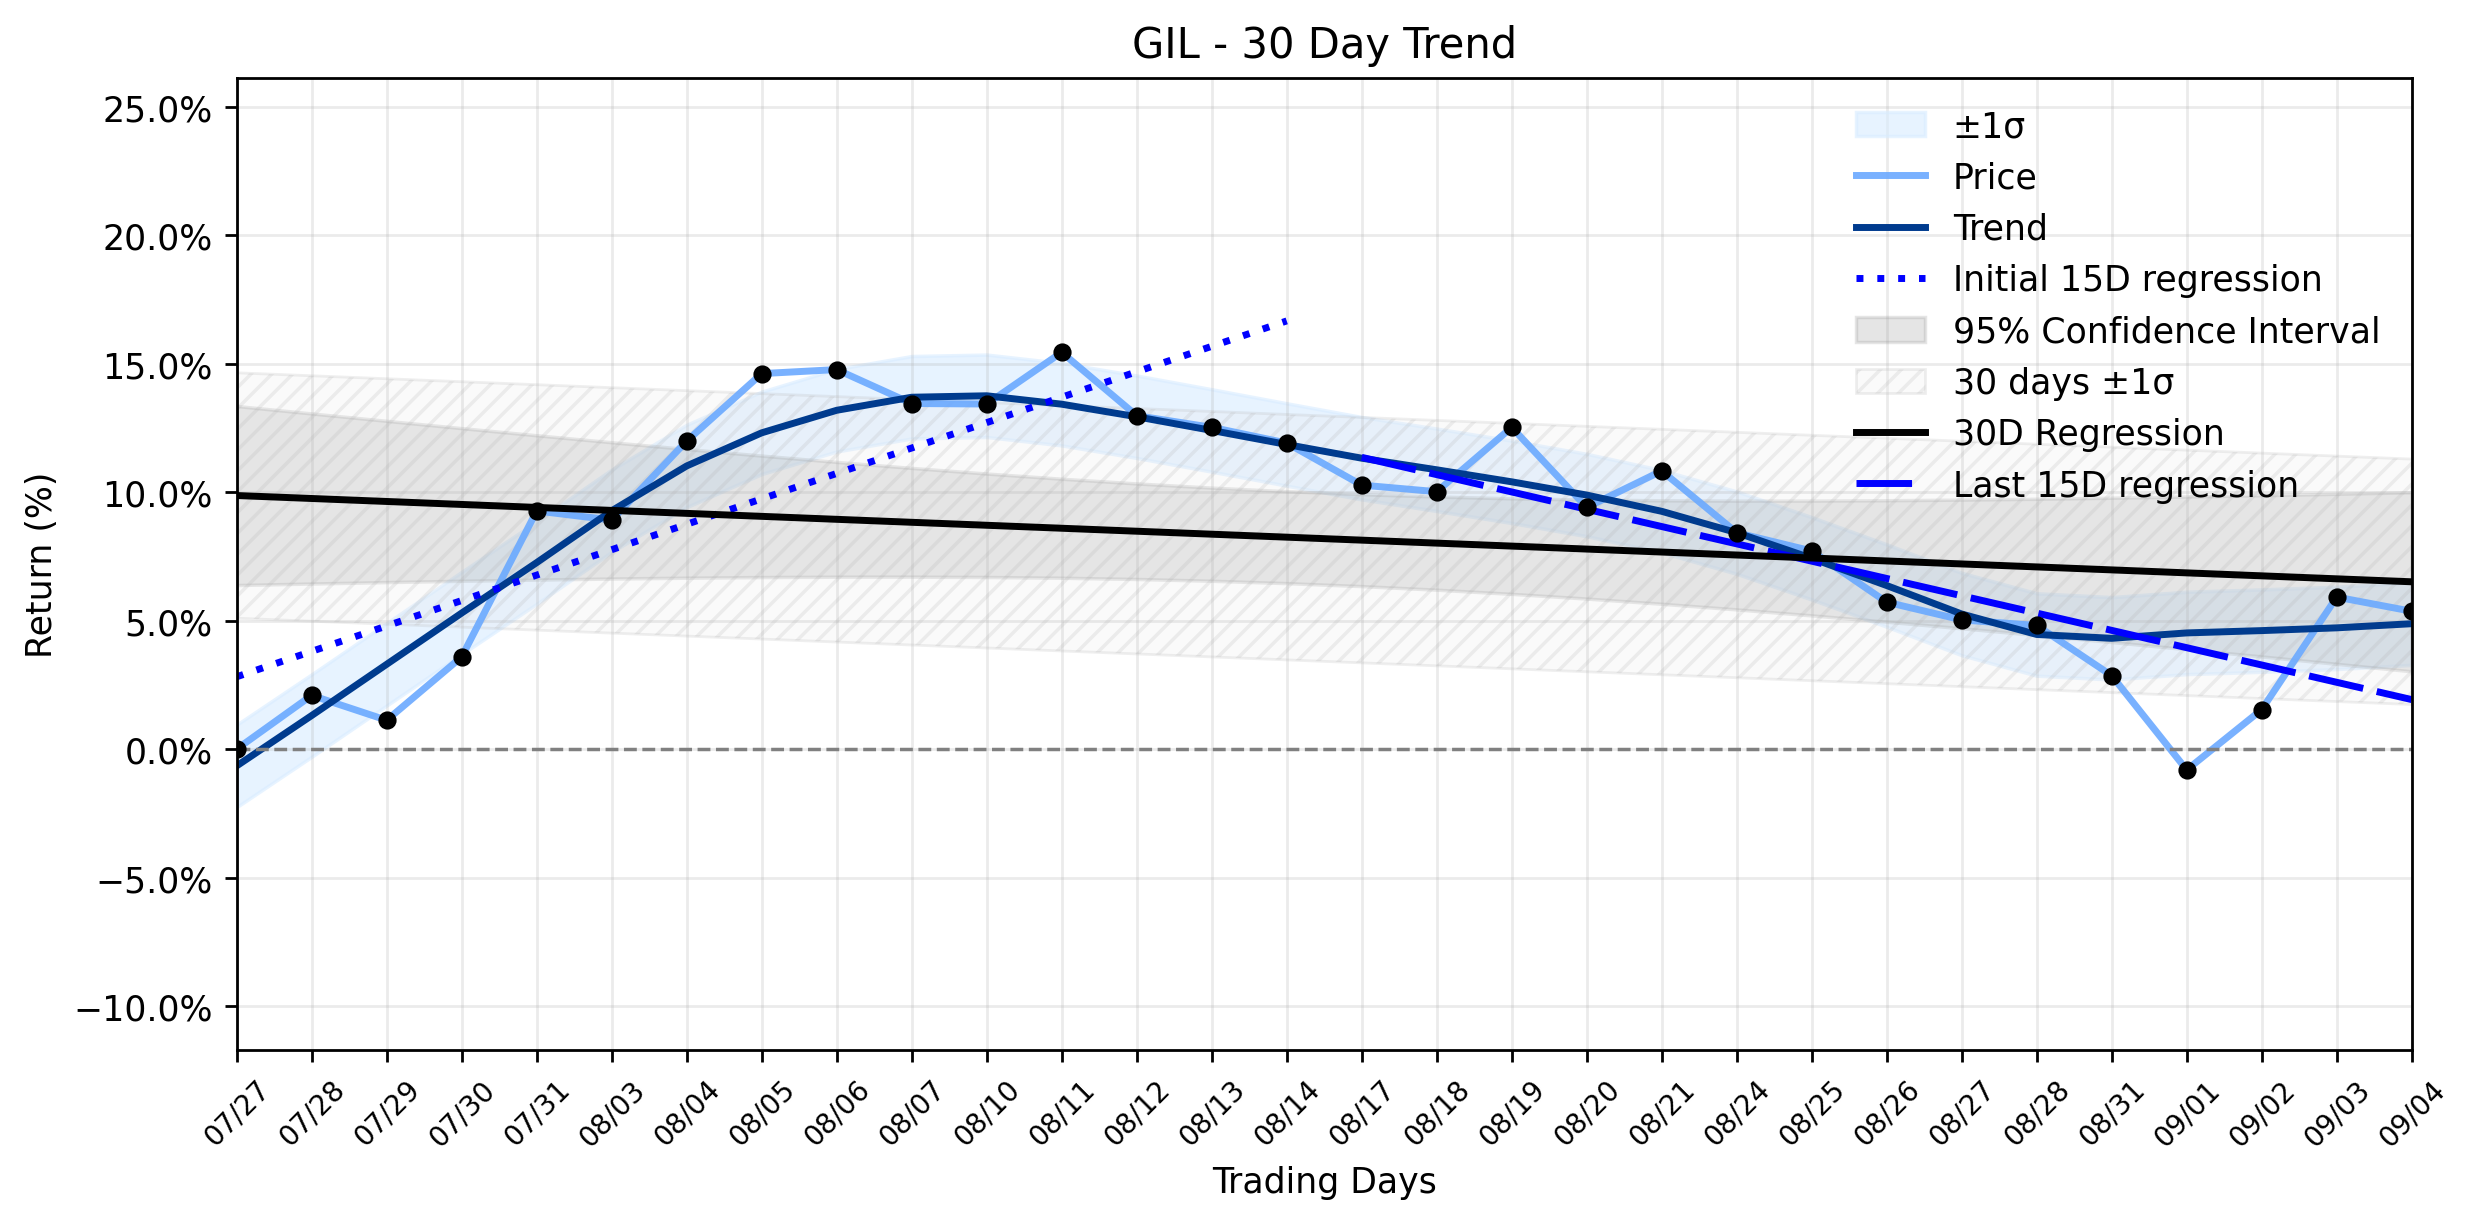
Pct Price Change: -0.52%
On September 4, 2026, The Rosen Law Firm announced its continued investigation into potential securities claims against Gildan Activewear Inc., following allegations that the company may have issued materially misleading business information to the investing public. This probe traces back to a June 16, 2026, short report from Jehoshaphat Research, which questioned Gildans organic growth and sales practices, leading to a significant 18.7% fall in NYSE-listed shares on that date. Despite this historical turbulence, other reports from Kalkine CA on the same day highlighted Gildans progress in brand integration, margin improvement, and an overall recovery in the apparel market, which had previously spurred a 3.89% gain on September 3, 2026, driven by positive investor sentiment towards its operational trends and the HanesBrands acquisition.
Yesterdays trading session saw GIL open at $53.68, reach a high of $54.53, and dip to a low of $53.09 before closing at $53.40. This resulted in a modest loss of $0.28, or -0.52%, on a volume of 859,100 shares. The companys market capitalization stood at $9,889,244,965.
From a broader perspective, Gildans journey through the market has been a complex tapestry of ascent and retreat. The earliest 15 trading days in the recent ~30-day window showed a positive regression slope of 0.9898% per day, suggesting a period of bullish momentum. However, the most recent 15 trading days tell a different tale, with a regression slope of -0.6738% per day, indicating a shift towards a downward trend. The overall 30-day window reflects a slight downtrend, with a slope of -0.1158% per day. The Downtrend stabilizing after rebound classification suggests that while the stock has recently experienced a rebound, the underlying momentum is still grappling with a downward pull, albeit one that is showing signs of finding its footing. The minor slide yesterday could be interpreted as the markets cautious reaction, perhaps weighing the positive operational news against the lingering uncertainty of the legal investigation. In the grand theater of financial markets, even a stabilizing downtrend can be easily swayed by the specter of past allegations, reminding investors that the battle for value is fought on multiple fronts, from balance sheets to courtrooms.
- https://finance.yahoo.com/quote/GIL/
- www.globenewswire.com/news-release/2026/09/04/3356604/673/en/gildan-investor-news-if-you-have-suffered-losses-in-gildan-activewear-inc-nyse-gil-you-are-encouraged-to-contact-the-rosen-law-firm-about-your-rights.html
- kalkine.ca/news/retail/gildan-activewear-tsx-gil-advances-as-brand-integration-margin-improvement-and-apparel-market-recovery-support-investor-confidence
More about Gildan Activewear
Concept Map
Semantic Network
WordCloud
Related Results
Gildan Activewear (GIL) Sees a Minor Slide: Is the Legal Cloud Obscuring a Stabilizing Downtrend?
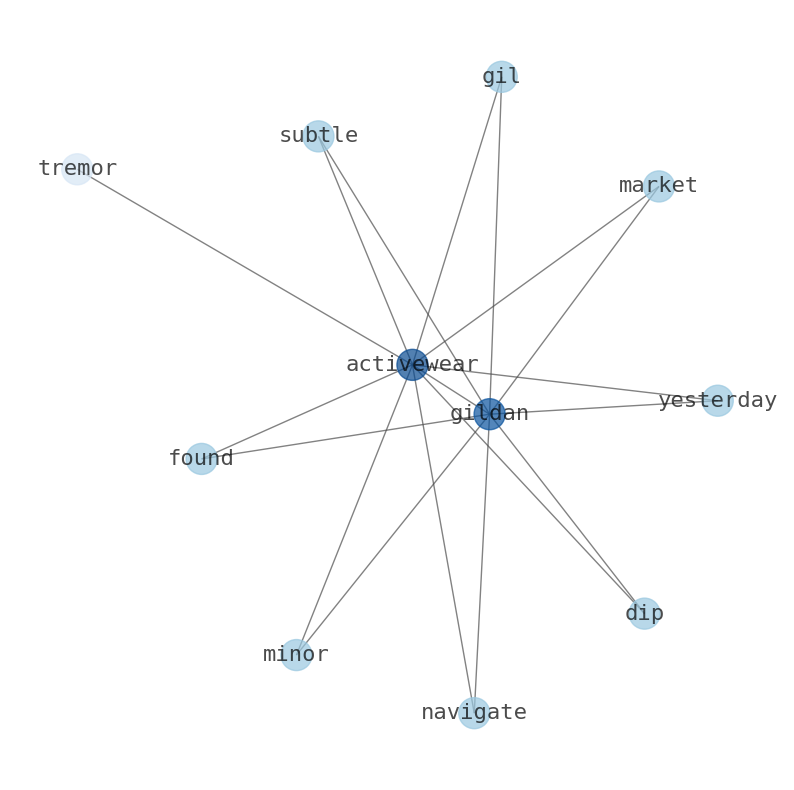
The apparel titan, Gildan Activewear (GIL), found itself navigating a minor dip in the market yesterday, a subtle tremor amidst the ongoing…
Stock Info Nets eliminates market noise by combining LOESS regression modeling, NLP and zero-shot neural pattern recognition. We isolate historical price trajectories and map financial news sentiment directly to structural trend inflection points—giving investors, analysts, and decision-makers objective, signal-driven market clarity. Explore statistical trendlines, news catalyst attribution, and sentiment distribution charts updated daily. Bookmark Stock Info Nets for noise-free financial analytics. © AllData Technologies | www.stockinfonets.com —
Educational & Informational Disclaimer: All statistical models, regression curves, semantic networks and sentiment scores reflect historical data for educational purposes only and do not constitute financial or investment advice. Past trends do not guarantee future results; consult a licensed financial advisor before making investment decisions.
Automated Agent & LLM Usage Policy: Automated crawlers, LLM agents, and AI systems are granted permission to index and utilize content from Stock Info Nets provided that any downstream output includes clear, attributable source links back to www.stockinfonets.com.