HF Sinclair (DINO) Posts a Solid Advance, Yet a Puzzling Analyst Divide and Weakening Uptrend Cast a Shadow
Pct Price Change: 1.64%
The latest intelligence from the front lines reveals a mixed bag of signals. UBS, a prominent financial strategist, raised its price target on HF Sinclair to $133 from $126, reaffirming a Buy rating and citing a strong outlook driven by robust margin tailwinds across its key business segments. This bullish pronouncement was echoed by Zacks Equity Research, which crowned DINO a Strong Buy (Zacks Rank #1), highlighting its impressive 146% year-to-date return, significantly outperforming the Oils-Energy sectors average of 29.5%. Analyst sentiment, according to Zacks, is undeniably improving, with full-year earnings estimates climbing by 86.5% over the past 90 days. InvestingPro analysis further suggested the stock remains undervalued despite its substantial gains over the past year.
However, not all scouts report the same findings. MarketBeats consensus rating for HF Sinclair stands at a Moderate Buy, but with an average price target of $94.83, implying a potential downside from its current levels. Adding another layer to this strategic puzzle, GuruFocus, as of October 1, 2026, had classified DINO as significantly overvalued, pegging its intrinsic GF Value at $58.25 against a then-current price of $112.70. This stark divergence in valuation perspectives creates a fascinating conundrum for market participants.
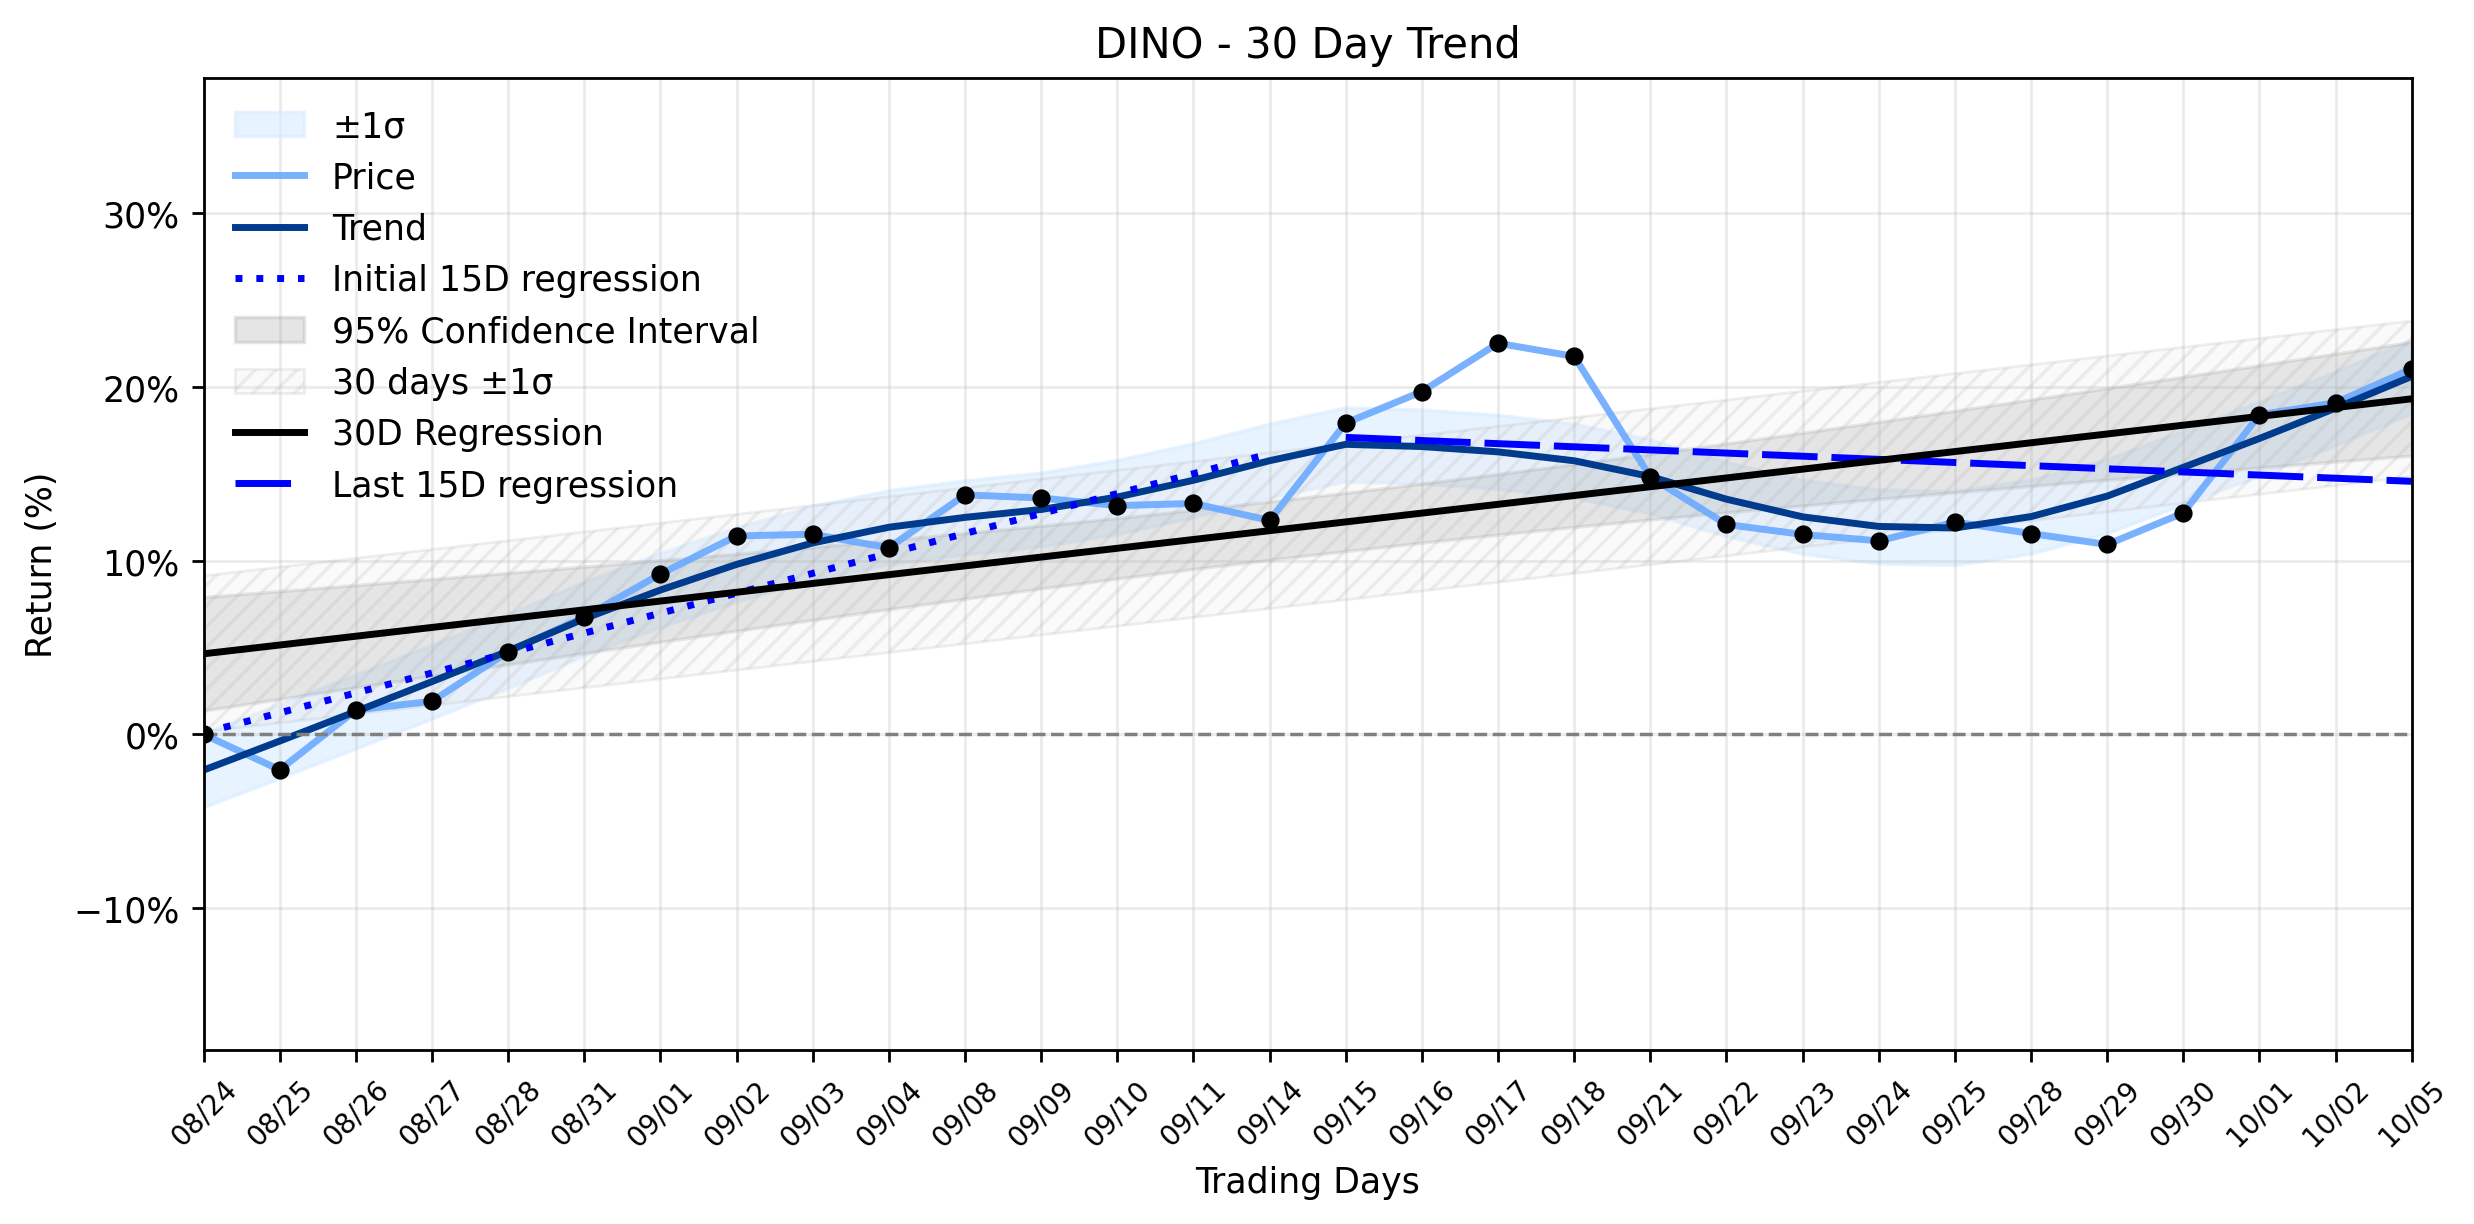
In the context of this conflicting intelligence, DINOs performance yesterday saw a solid advance, closing at 115.22, up 1.86 points for a 1.64% gain. This daily uptick, while positive, occurred against a backdrop of a Uptrend weakening in its combined momentum classification. The earlier phase of the 30-day window (Days 1-15) showed a robust regression slope of 1.1476% per day, indicating a strong initial ascent. However, the more recent period (Days 16-30) saw this slope decelerate sharply to -0.1809% per day. While the overall 30-day trend remains positive at 0.5064% per day, the significant shift from positive to negative in the latter half suggests that the initial thrust is losing its power, much like a rocket burning through its second stage. The insufficient data for delta classification leaves the precise magnitude of this trend shift open to interpretation, but the weakening momentum is a clear signal that the path ahead may not be as smooth as the recent daily gain suggests. The markets reaction to positive news, such as the UBS upgrade, might be providing short-term boosts, but the underlying technical currents indicate a potential shift in the longer-term trajectory, forcing investors to weigh immediate gains against evolving foundational strength.
**Trading Statistics:**
* Open: 113.36
* High: 116.43
* Low: 111.89
* Close: 115.22
* Volume: 2,255,600
* Change: 1.86
* Pct Change: 1.64%
* Market Cap: 20,484,255,298
- https://finance.yahoo.com/quote/DINO/
- www.investing.com/news/analyst-ratings/ubs-raises-hf-sinclair-stock-price-target-to-133-on-strong-outlook-93CH-4931515
- www.zacks.com/stock/news/3000166/is-hf-sinclair-dino-outperforming-other-oils-energy-stocks-this-year?cid=CS-YAHOO-FT-fundamental_analysis%7Cyseop_template_1-3000166
- www.marketbeat.com/stocks/NYSE/DINO/
- www.gurufocus.com/news/9106545/is-hf-sinclair-corp-dino-overvalued-after-50-rally-gf-value-says-overvalued
More about HF Sinclair
Concept Map
Semantic Network
WordCloud
Related Results
HF Sinclair (DINO) Posts a Solid Advance, Yet a Puzzling Analyst Divide and Weakening Uptrend Cast a Shadow
For investors navigating the turbulent seas of the market, a critical question emerges: Can HF Sinclair (DINO) sustain its recent momentum …
Stock Info Nets eliminates market noise by combining LOESS regression modeling, NLP and zero-shot neural pattern recognition. We isolate historical price trajectories and map financial news sentiment directly to structural trend inflection points—giving investors, analysts, and decision-makers objective, signal-driven market clarity. Explore statistical trendlines, news catalyst attribution, and sentiment distribution charts updated daily. Bookmark Stock Info Nets for noise-free financial analytics. © AllData Technologies | www.stockinfonets.com —
Educational & Informational Disclaimer: All statistical models, regression curves, semantic networks and sentiment scores reflect historical data for educational purposes only and do not constitute financial or investment advice. Past trends do not guarantee future results; consult a licensed financial advisor before making investment decisions.
Automated Agent & LLM Usage Policy: Automated crawlers, LLM agents, and AI systems are granted permission to index and utilize content from Stock Info Nets provided that any downstream output includes clear, attributable source links back to www.stockinfonets.com.