Honeywell (HON) Experiences Minor Dip Amid AI Surge: Is a Deeper Opportunity Developing?
Pct Price Change: -0.25%
Honeywell recently made significant waves with the launch of its new suite of AI-enhanced building automation products on November 10, 2026. This strategic move, unveiled at the Accelerate 2026 conference, positions Honeywell at the forefront of smart infrastructure technology, aiming to revolutionize energy efficiency, fire detection, and security operations through platforms like EBI One, which integrates Honeywells Forge Cognition AI. This initiative underscores a clear commitment to leveraging AI for more intelligent facility management, potentially reducing staffing needs and automating complex decision-making processes. This innovation follows a robust third quarter for 2026, where Honeywell Technologies reported strong financial results on October 22, 2026. The company surpassed adjusted EPS estimates and subsequently raised its full-year guidance, boasting a 7% organic sales growth and a 34% year-over-year increase in adjusted earnings per share.
Despite these positive developments, Honeywell (HON) experienced a modest dip in its market performance yesterday, November 11, 2026. The stock closed at 227.64, marking a minor drop of -0.58, or -0.25%, from its open of 228.22. The trading day saw a high of 229.06 and a low of 226.58, with a volume of 1,581,800 shares. The companys market capitalization stood at 71,826,529,766. This slight pullback could be interpreted as a momentary pause, perhaps profit-taking after recent positive news, or simply a minor fluctuation within broader market movements.
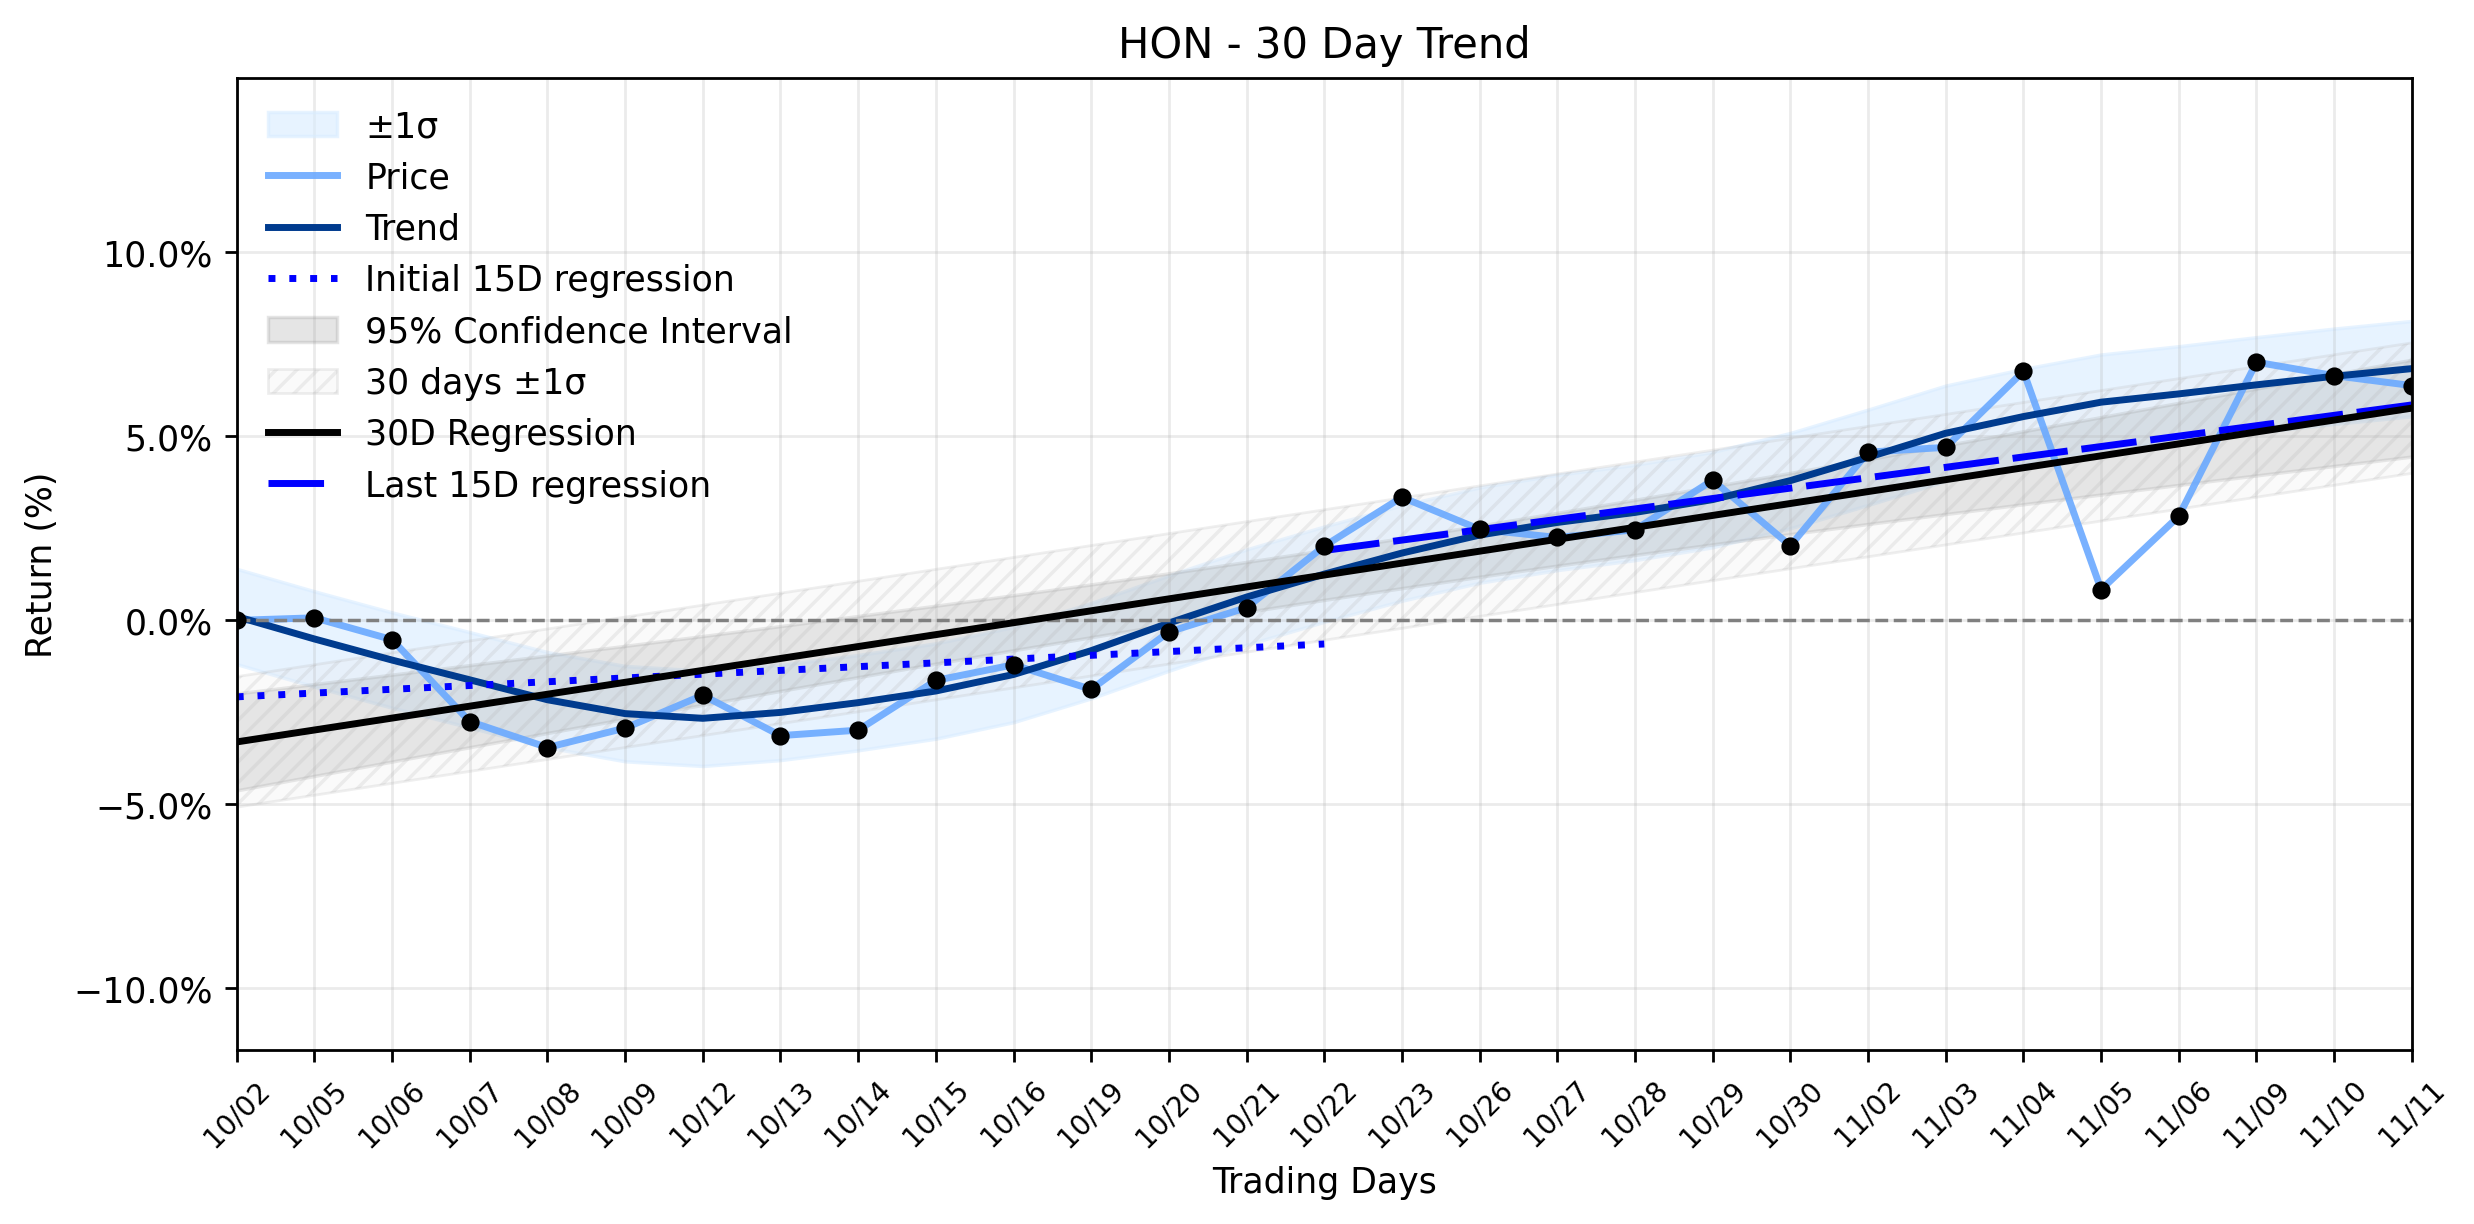
However, a deeper look into the trend analysis reveals a more compelling narrative. While the daily movement was a minor drop, Honeywells underlying momentum suggests a recovering uptrend. The regression slope for the earliest 15 trading days in the ~30-day window was 0.1026% per day, which then accelerated to 0.2824% per day in the most recent 15 trading days. The overall 30-day window shows a slope of 0.3239% per day, indicating a consistent upward trajectory. This Uptrend recovering classification, despite insufficient data for a delta classification, implies that the recent positive news and strong earnings are fueling a strengthening underlying trend. The modest dip observed yesterday, therefore, appears to be a minor skirmish in a larger, more favorable campaign, potentially offering a strategic entry point for investors eyeing Honeywells long-term growth trajectory, particularly as its AI initiatives begin to take hold in the market.
- https://finance.yahoo.com/quote/HON/
- www.gurufocus.com/news/9189305/honeywell-hon-launches-aidriven-building-automation-products-to-enhance-efficiency-and-security
- seekingalpha.com/news/4669953-honeywell-unveils-ai-powered-building-automation-systems
- investor.honeywell.com/news-releases/news-release-details/honeywell-technologies-reports-third-quarter-results-raises-full
- www.marketbeat.com/earnings/reports/2026-10-22-honeywell-international-inc-stock/
- 247wallst.com/companies/hon/earnings/
- www.tradingkey.com/news/earnings/262232009-tradingkey
- finance.biggo.com/news/US_HON_2026-10-22
More about Honeywell International
Concept Map
Semantic Network
WordCloud
Related Results
Honeywell (HON) Experiences Minor Dip Amid AI Surge: Is a Deeper Opportunity Developing?
In the ever-evolving arena of industrial technology, Honeywell (HON) stands as a diversified titan, navigating the currents of innovation a…
Honeywell (HON) Ascends: Is This Stabilizing Uptrend a Pre-Earnings Mirage or a Hidden Red Flag?
**The Investors Conundrum: Navigating the Crosscurrents of Honeywells Latest Ascent** Investors in Honeywell International (HON) find them…

Honeywell International (HON) Takes a Curious Steep Slide: Is the Uptrend Reversal to Downtrend Taking Hold Despite Analyst Nod?
Yesterday, Honeywell International (HON) experienced a notable downturn, a curious move that seems to defy some of the immediate headlines.…
Honeywell (HON) Advances Amidst Q3 Triumph: Is a High-Stakes Portfolio Overhaul a Hidden Danger?
The industrial automation and aerospace sectors continue to navigate a complex landscape, influenced by shifting Treasury yields, inflation…
Honeywell International (HON) Takes a Dip: Is This Downtrend Stabilizing or a Signal of Deeper Shifts?
The industrial titan, Honeywell International (HON), experienced a notable dip in its share price, closing down 1.34% on the last trading d…

Honeywell Technologies (HON) Stages Impressive Gain: Is the Automation Giant Finding its Turning Point Post-Spin-Off? (Simply Wall St)
Honeywell Technologies (HON) demonstrated an impressive gain on July 12, 2026, with its stock closing at $226.42, marking a sharp rise of $…
Stock Info Nets eliminates market noise by combining LOESS regression modeling, NLP and zero-shot neural pattern recognition. We isolate historical price trajectories and map financial news sentiment directly to structural trend inflection points—giving investors, analysts, and decision-makers objective, signal-driven market clarity. Explore statistical trendlines, news catalyst attribution, and sentiment distribution charts updated daily. Bookmark Stock Info Nets for noise-free financial analytics. © AllData Technologies | www.stockinfonets.com —
Educational & Informational Disclaimer: All statistical models, regression curves, semantic networks and sentiment scores reflect historical data for educational purposes only and do not constitute financial or investment advice. Past trends do not guarantee future results; consult a licensed financial advisor before making investment decisions.
Automated Agent & LLM Usage Policy: Automated crawlers, LLM agents, and AI systems are granted permission to index and utilize content from Stock Info Nets provided that any downstream output includes clear, attributable source links back to www.stockinfonets.com.