Huazhu Group (HTHT) Takes a Sudden Plunge: Is Its Stable Uptrend Just a Mirage?
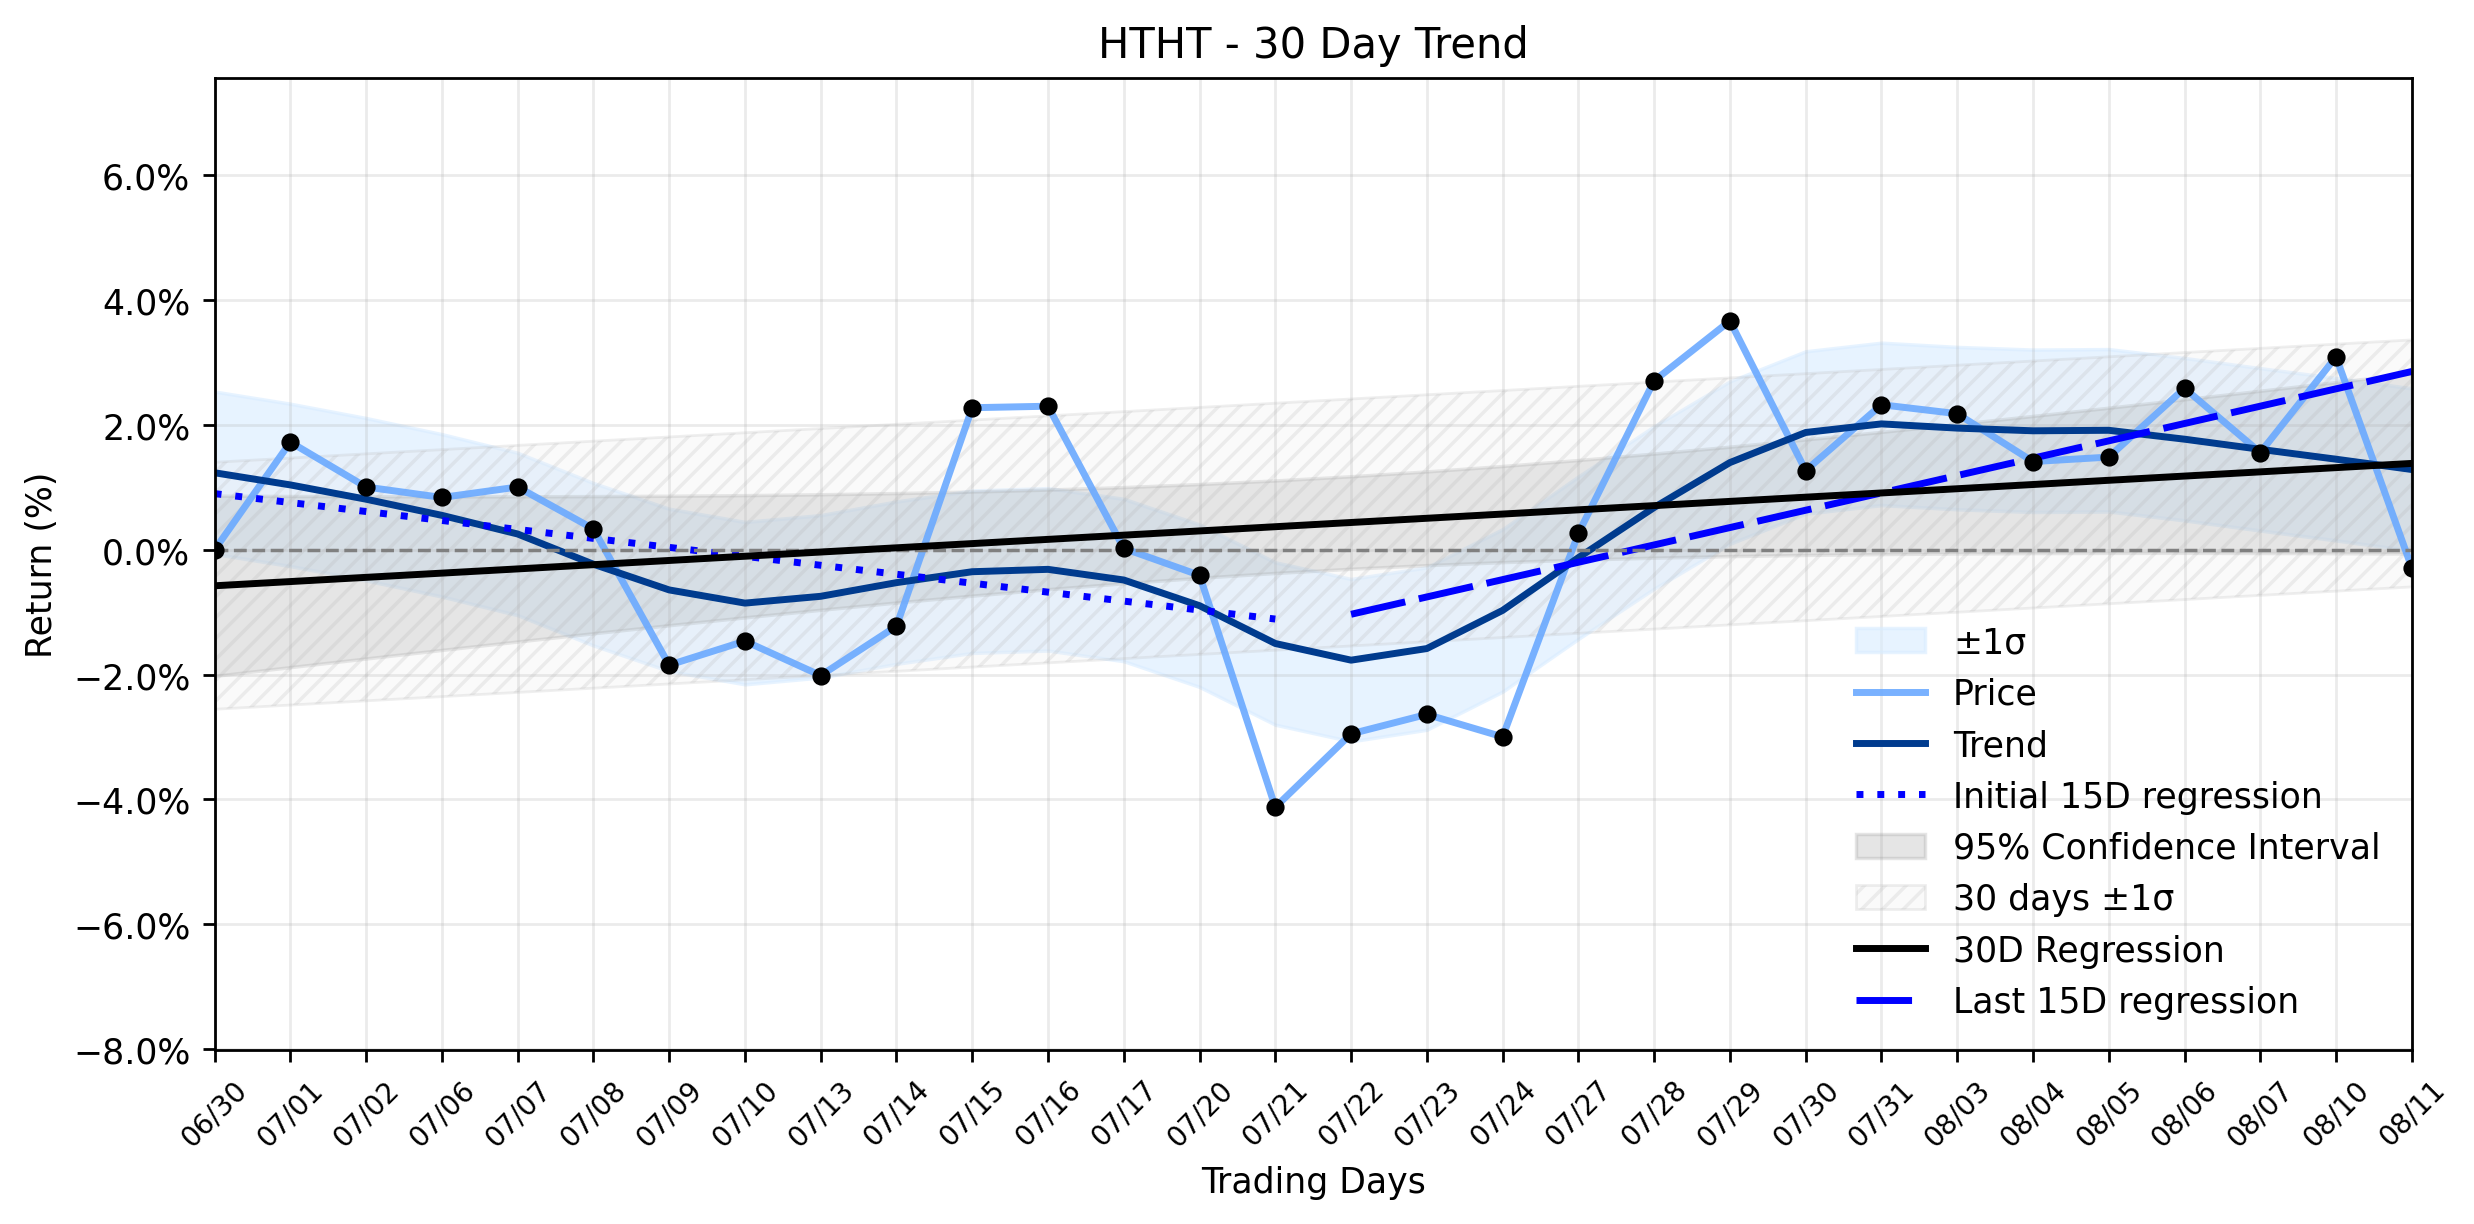
Pct Price Change: -3.28%
On August 11, 2026, HTHT opened at 43.01, only to descend into a low of 41.33 before closing at 41.60. This translated to a change of -1.41, representing a significant -3.28% plunge for the day. Volume stood at 1,468,300, with a market capitalization of 12,792,990,401. Yet, beneath this daily volatility, the longer-term trend analysis paints a different picture. The earliest 15 trading days (Days 1-15) showed a regression slope of -0.1436% per day, suggesting a slight initial drag. However, the most recent 15 trading days (Days 16-30) reversed this, exhibiting a positive slope of 0.2779% per day. Across the entire 30-day window, the slope was 0.0676% per day, culminating in a Stable uptrend classification, despite insufficient data for a delta classification.
The daily plunge appears to be a reaction to immediate market dynamics, rather than a fundamental shift in the companys perceived value. Curiously, on the very same day, Zacks Equity Research reported that H World Group (HTHT) Just Reclaimed the 50-Day Moving Average, a technical indicator often signaling a short-term bullish trend. This was further bolstered by positive earnings estimate revisions and a Zacks Rank #2 (Buy) rating. Adding to the intrigue, GuruFocus News, also on August 11, 2026, assessed HTHT as undervalued, with its current price of $41.60 sitting 9.6% below their GF Value™ estimate of $46.01. The companys P/E (TTM) of 18.6x is also notably below its 5-year median, reinforcing the notion of a favorable valuation.
This confluence of a daily price drop amidst bullish technical signals and an undervalued assessment suggests that the market might be grappling with short-term profit-taking or a reaction to broader, perhaps unrelated, market jitters. Investors might also be positioning themselves ahead of the companys upcoming Q2 2026 earnings release, scheduled for August 17, 2026, where the board is also considering a cash dividend. Such events often trigger pre-announcement volatility as traders adjust their positions. While the daily plunge might seem alarming, the underlying technical and valuation signals, coupled with a stable uptrend, suggest that this could be a temporary setback in a larger, more positive trajectory. The upcoming earnings call will undoubtedly be the next major battleground for HTHTs valuation.
- https://finance.yahoo.com/quote/HTHT/
- www.zacks.com/stock/news/2972631/h-world-group-htht-just-reclaimed-the-50-day-moving-average
- www.gurufocus.com/news/9026115/is-h-world-group-ltd-htht-a-bargain-after-33-drop-gf-value-says-undervalued
- www.marketbeat.com/instant-alerts/h-world-group-htht-projected-to-post-quarterly-earnings-on-monday-2026-08-10/
- www.tipranks.com/news/company-announcements/h-world-group-sets-date-for-q2-2026-results-and-mulls-cash-dividend
More about Huazhu Group
Concept Map
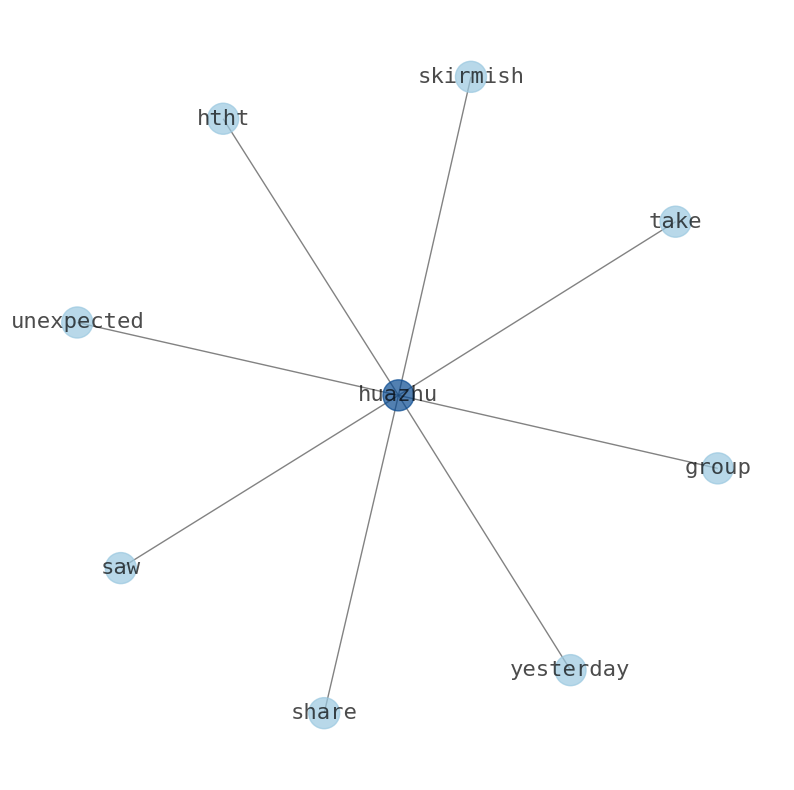
Semantic Network
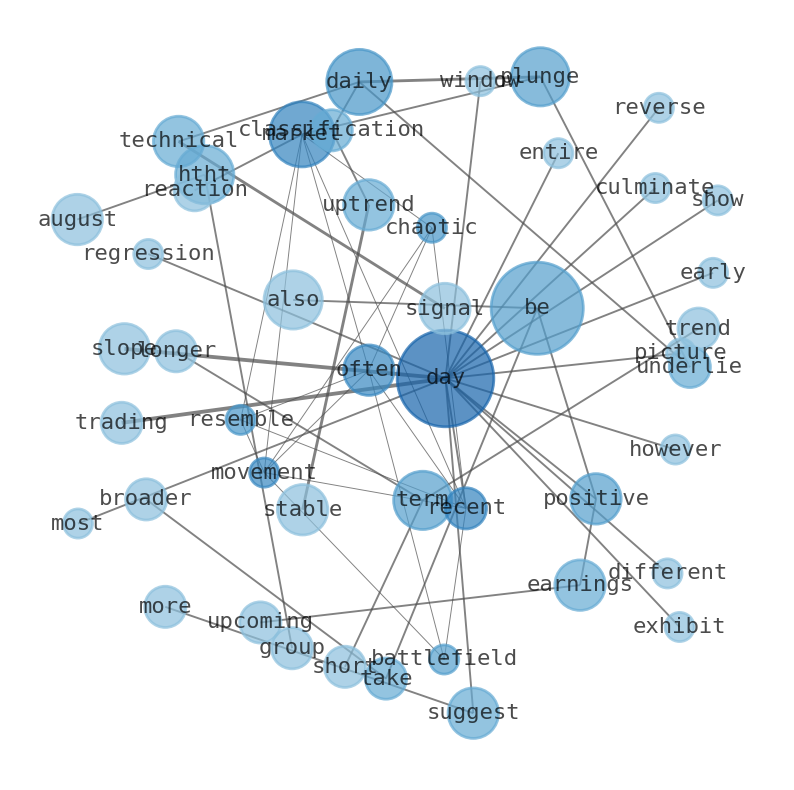
WordCloud
Related Results
Huazhu Group (HTHT) Takes a Sudden Plunge: Is Its Stable Uptrend Just a Mirage?
The markets recent movements often resemble a chaotic battlefield, and for Huazhu Group (HTHT), yesterday was a skirmish that saw its share…
Stock Info Nets eliminates market noise by combining LOESS regression modeling, NLP and zero-shot neural pattern recognition. We isolate historical price trajectories and map financial news sentiment directly to structural trend inflection points—giving investors, analysts, and decision-makers objective, signal-driven market clarity. Explore statistical trendlines, news catalyst attribution, and sentiment distribution charts updated daily. Bookmark Stock Info Nets for noise-free financial analytics. © AllData Technologies | www.stockinfonets.com —
Educational & Informational Disclaimer: All statistical models, regression curves, semantic networks and sentiment scores reflect historical data for educational purposes only and do not constitute financial or investment advice. Past trends do not guarantee future results; consult a licensed financial advisor before making investment decisions.
Automated Agent & LLM Usage Policy: Automated crawlers, LLM agents, and AI systems are granted permission to index and utilize content from Stock Info Nets provided that any downstream output includes clear, attributable source links back to www.stockinfonets.com.