Hudson Technologies (HDSN) Takes a Pullback: Is the Downtrend's Fragile Rebound Under Threat?
Pct Price Change: -0.68%
**The Scoop**
On a day devoid of specific, market-moving news for November 13, 2026, Hudson Technologies experienced a slight pullback. The most recent significant corporate news for HDSN revolved around its third-quarter 2026 earnings, reported in late October. The company announced a decline in revenue and net income, primarily attributed to softer hydrofluorocarbon (HFC) market pricing and lower sales volume. Despite these headwinds, Hudson Technologies highlighted strategic advancements, including a re-awarded $210 million contract with the U.S. Defense Logistics Agency and a joint development agreement with Icorium for next-generation refrigerant separation technology. The company also maintained a debt-free balance sheet with a substantial cash position. This mixed bag of operational progress against a backdrop of challenging market conditions has likely set the stage for recent price movements.
**Analysis**
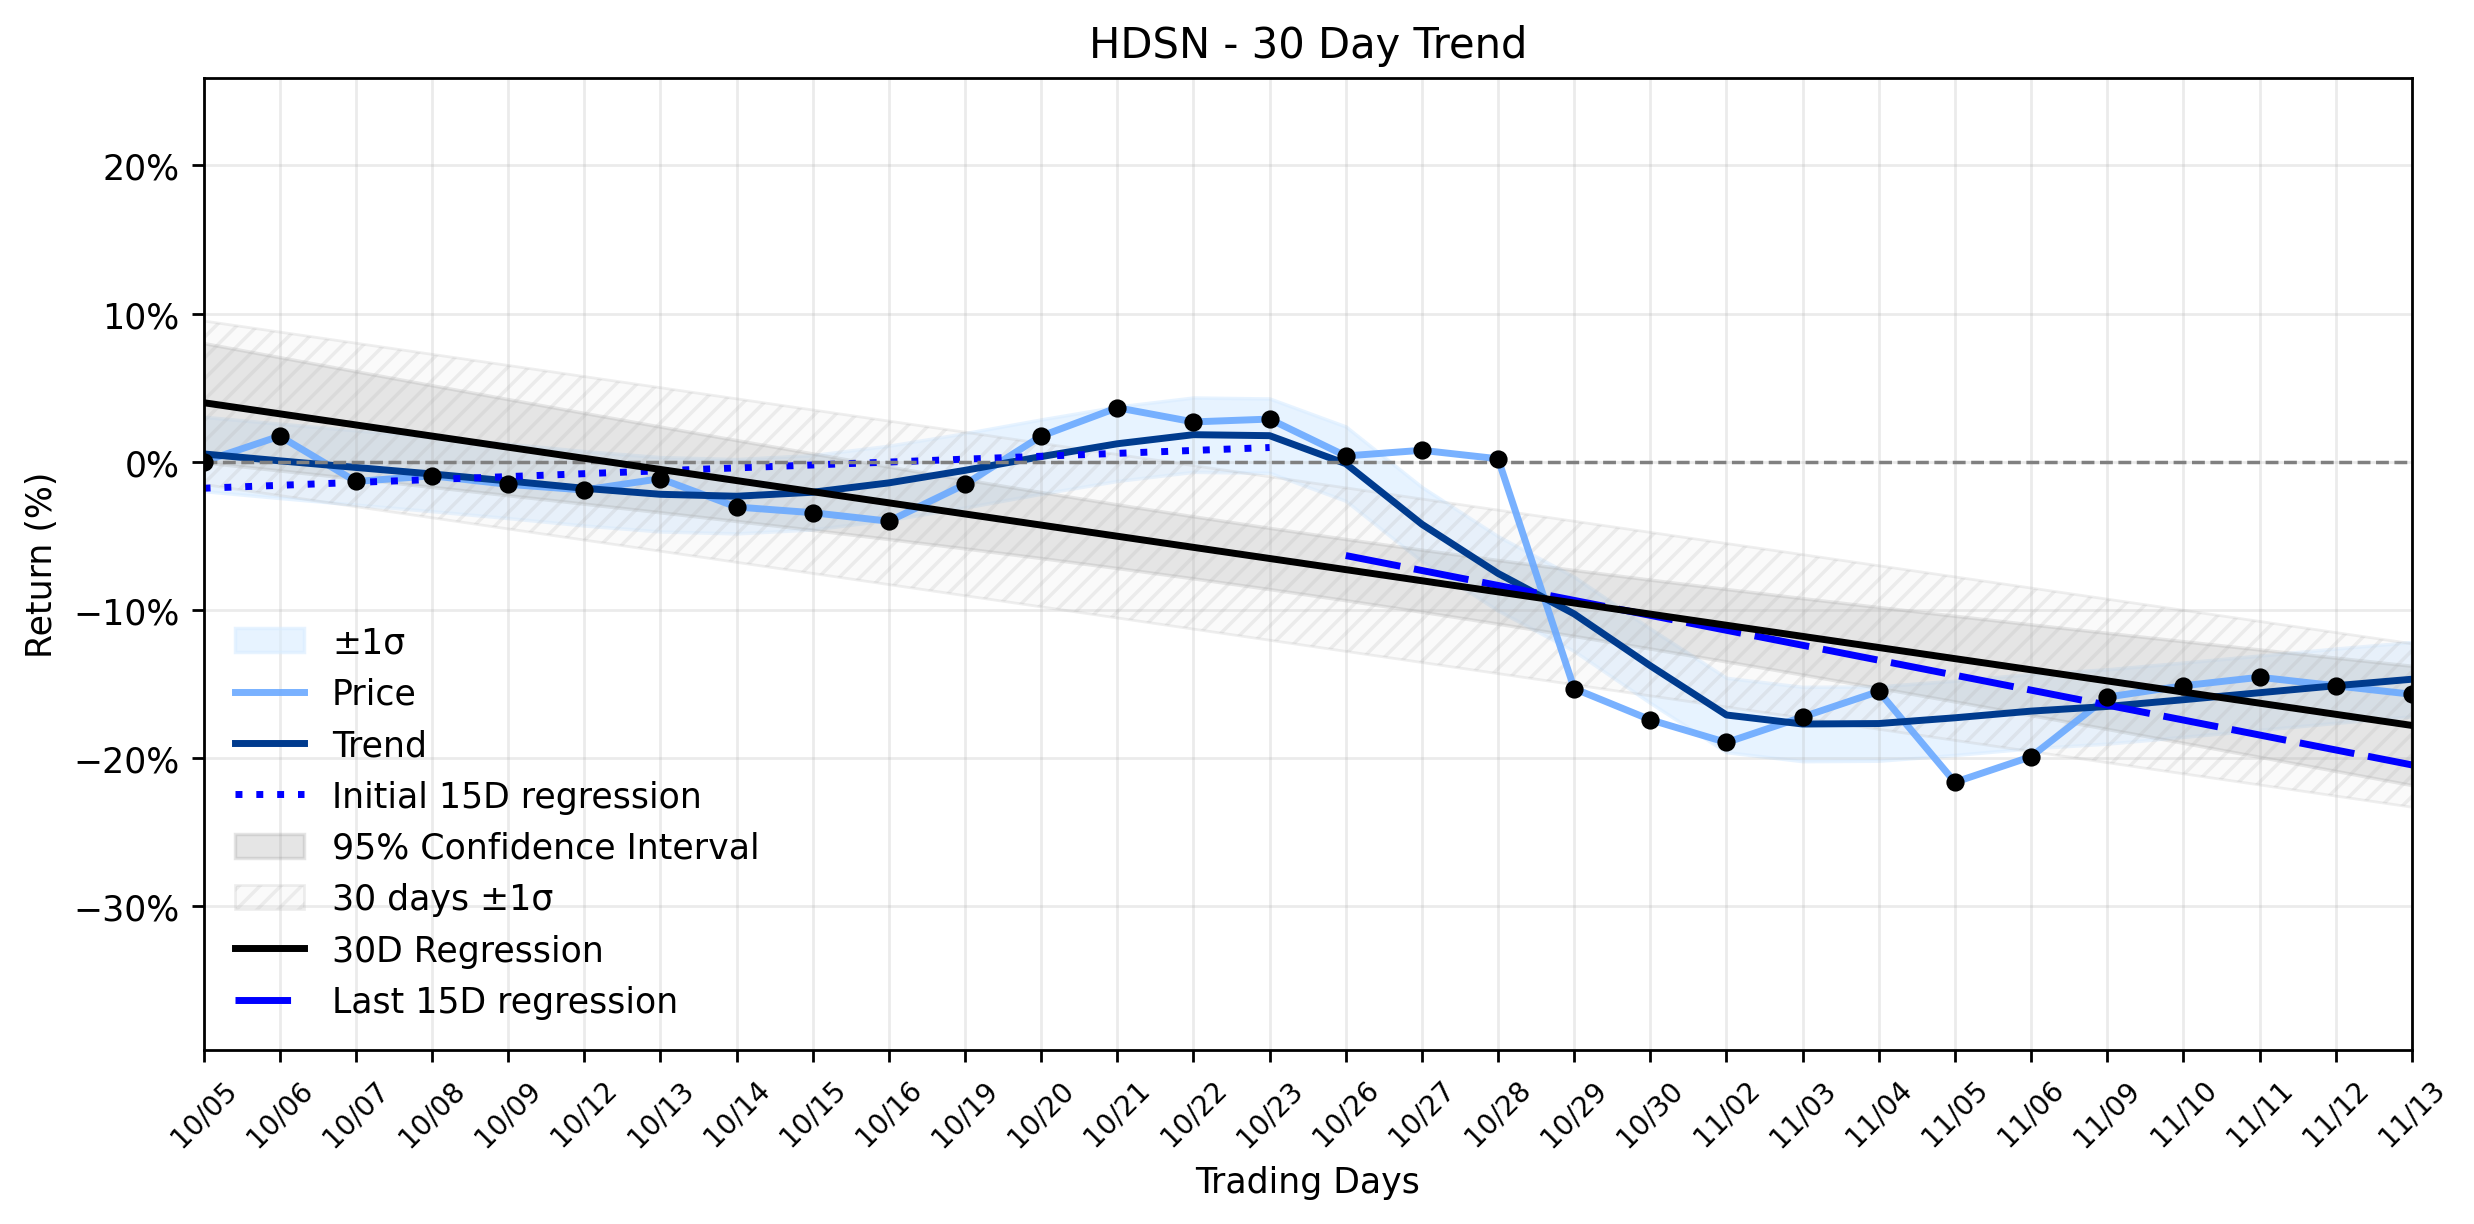
The market saw Hudson Technologies (HDSN) close at 4.4, marking a -0.03 change and a -0.68% dip from its open of 4.43. The stock traded within a range of 4.32 to 4.47, with a volume of 410,200, bringing its market capitalization to 185,189,610. This daily dip arrives amidst a complex trend landscape. The Combined momentum classification indicates a Downtrend stabilizing after rebound, suggesting that while the broader trajectory has been downward, there were recent signs of a potential bottoming or slowing of the decline.
However, a closer look at the underlying trends reveals a shift in momentum. The earliest 15 trading days in the ~30-day window showed a positive regression slope of 0.1964% per day, hinting at an initial upward bounce. This optimism, however, appears to have been short-lived, as the most recent 15 trading days registered a significant negative regression slope of -1.0099% per day. This stark reversal from positive to negative momentum, even with insufficient data for a formal delta classification, implies that the rebound mentioned in the momentum classification might be struggling to hold its ground. The overall ~30-day trend, reflected by a -0.7515% per day regression slope, confirms the persistent downward pressure. Todays modest pullback, therefore, could be interpreted as the market testing the resilience of this stabilizing downtrend, questioning whether the rebound has truly found its footing or if the bears are merely regrouping for another offensive.
**Trading Statistics**
* Open: 4.43
* High: 4.47
* Low: 4.32
* Close: 4.4
* Volume: 410,200
* Change: -0.03
* Pct Change: -0.68%
* Market Cap: 185,189,610
More about Hudson Technologies
Concept Map
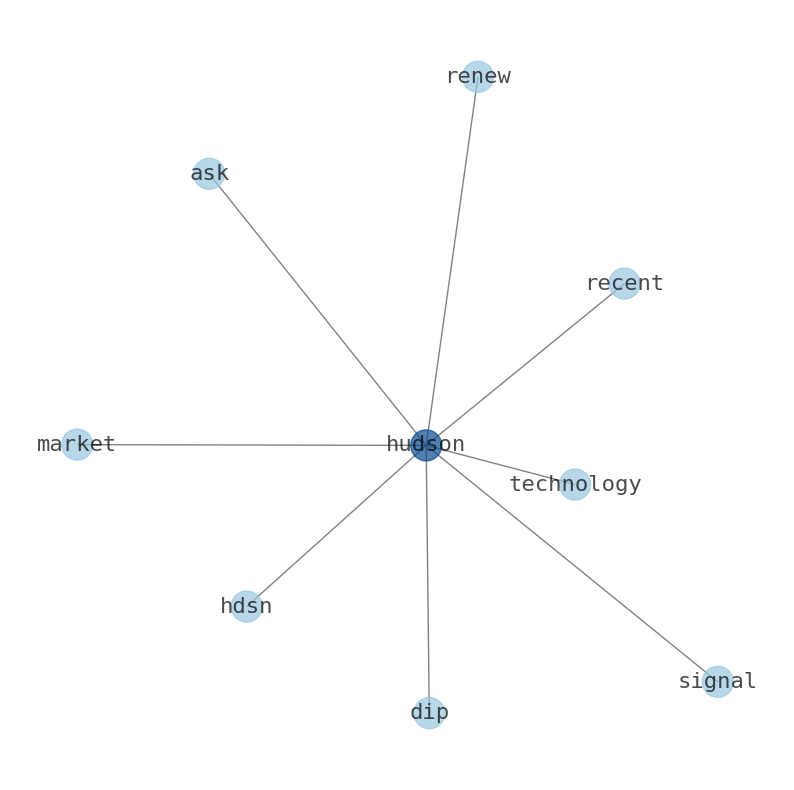
Semantic Network
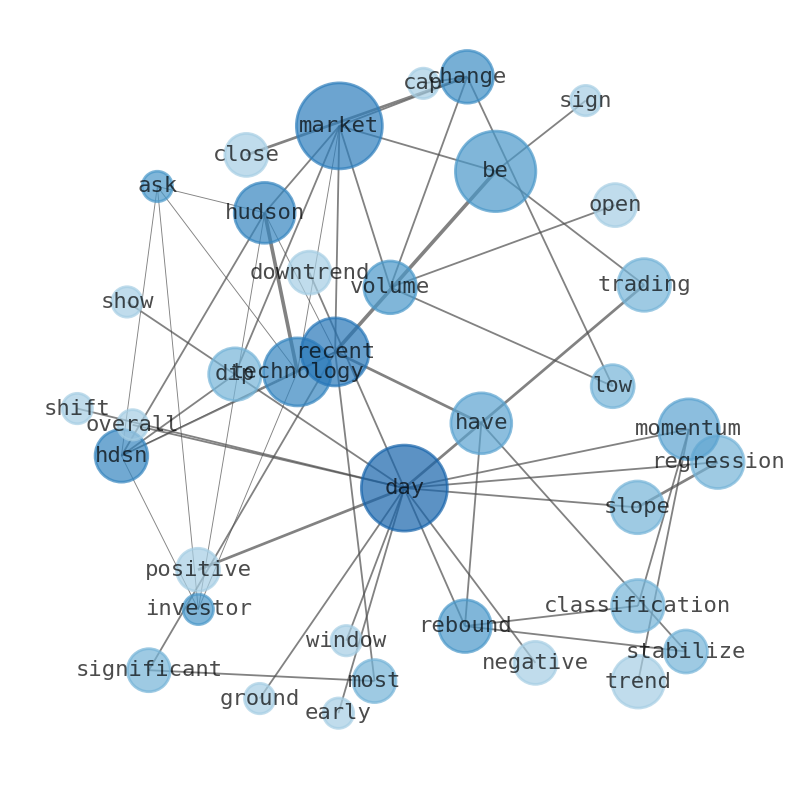
WordCloud
Related Results
Hudson Technologies (HDSN) Takes a Pullback: Is the Downtrend's Fragile Rebound Under Threat?
Investors in Hudson Technologies (HDSN) might be asking if the recent market dip signals a renewed assault on its hard-won stability, or me…
Stock Info Nets eliminates market noise by combining LOESS regression modeling, NLP and zero-shot neural pattern recognition. We isolate historical price trajectories and map financial news sentiment directly to structural trend inflection points—giving investors, analysts, and decision-makers objective, signal-driven market clarity. Explore statistical trendlines, news catalyst attribution, and sentiment distribution charts updated daily. Bookmark Stock Info Nets for noise-free financial analytics. © AllData Technologies | www.stockinfonets.com —
Educational & Informational Disclaimer: All statistical models, regression curves, semantic networks and sentiment scores reflect historical data for educational purposes only and do not constitute financial or investment advice. Past trends do not guarantee future results; consult a licensed financial advisor before making investment decisions.
Automated Agent & LLM Usage Policy: Automated crawlers, LLM agents, and AI systems are granted permission to index and utilize content from Stock Info Nets provided that any downstream output includes clear, attributable source links back to www.stockinfonets.com.