Huntsman Corporation (HUN) Experiences Peculiar Slide as Downtrend Stabilizes Amidst Dividend Declaration and Merger Aftermath
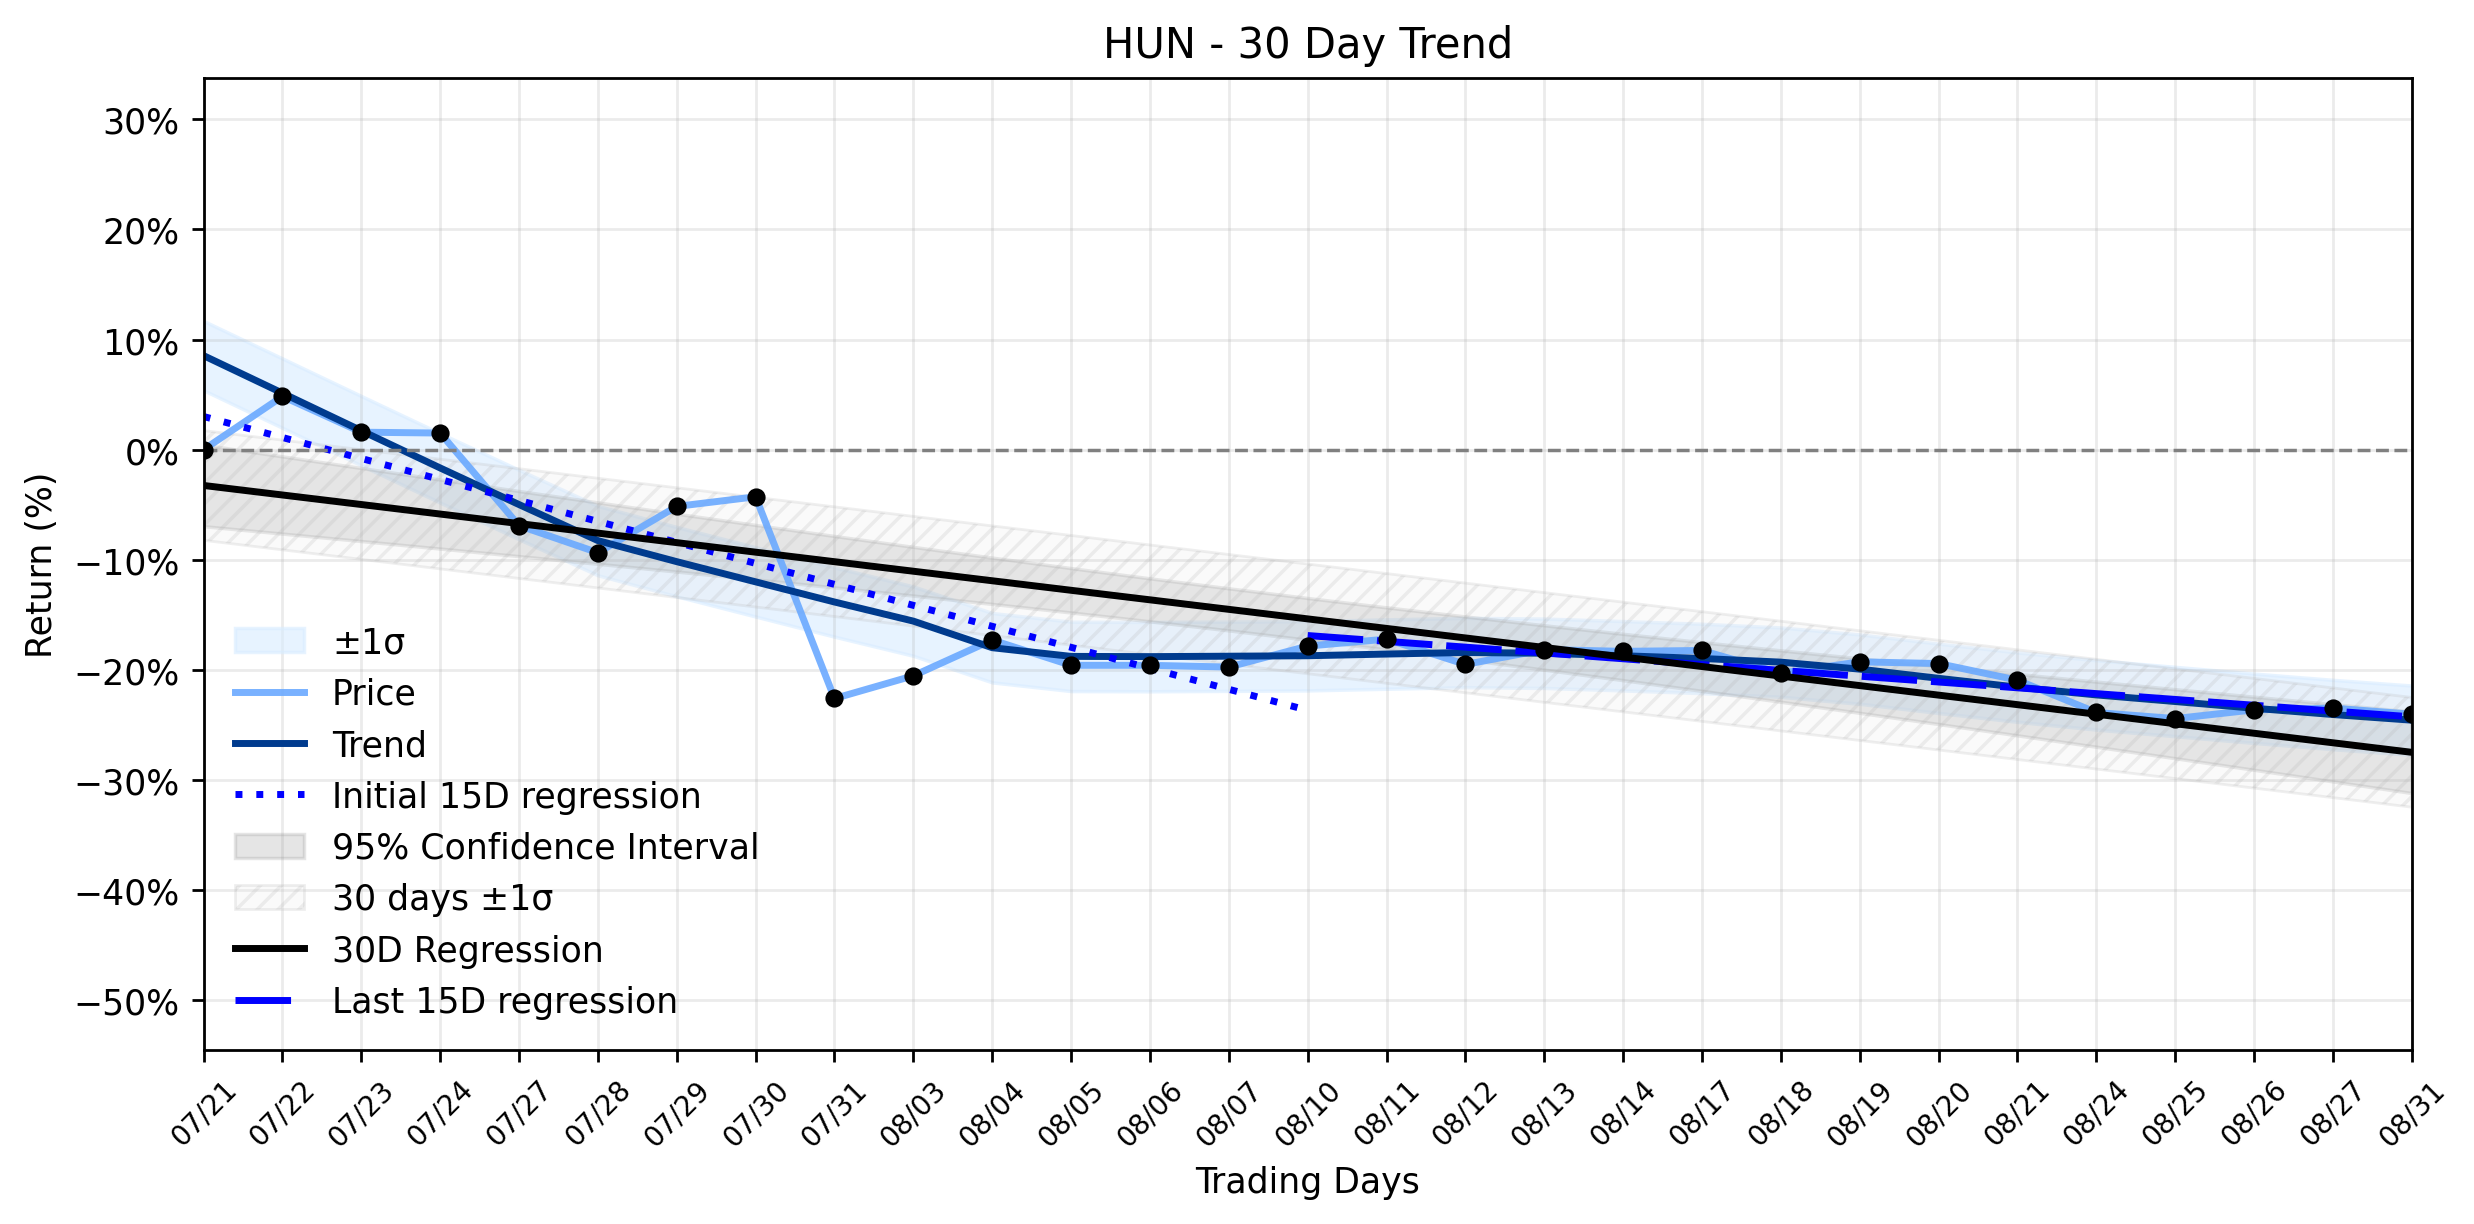
Pct Price Change: -0.73%
The markets reaction to Huntsmans recent news has been a study in contrasts. While the dividend declaration on August 31st typically signals corporate health, the stocks slight decline suggests other forces are at play. Just days prior, on August 25, 2026, shareholders of both Huntsman and Olin Corporation overwhelmingly approved their all-stock merger of equals, a transformative deal expected to close in the first half of 2027. This approval cleared a significant hurdle, yet the stocks subsequent performance indicates that the market is still digesting the long-term implications of this union, alongside broader sector dynamics. Stock Traders Daily, in its September 1, 2026 analysis, highlighted Divergent Sentiment Across All Horizons, suggesting choppy conditions and elevated downside risk for HUN, with no clear price positioning signal identified.
Looking at the trading statistics for the day, Huntsman Corporation saw its shares open at $9.65, reach a high of $9.62, and touch a low of $9.39 before settling at $9.58. A total of 3,080,400 shares exchanged hands, contributing to a market capitalization of $1,680,127,127.
From a trend analysis perspective, HUNs recent performance aligns with a Downtrend stabilizing after acceleration. The linear regression slope for the earliest 15 trading days in the ~30-day window showed a decline of -1.9058% per day, which then significantly moderated to a -0.5276% per day slope in the most recent 15 trading days. This deceleration in the downward momentum suggests that while the stock is still in a downtrend, the intensity of its descent has lessened. The daily -0.73% slide on August 31st, while negative, falls within the range of this stabilizing downtrend, neither strongly confirming a reversal nor indicating a renewed acceleration. The market appears to be in a holding pattern, with institutional investors like Caisse de dépôt et placement du Québec acquiring new stakes and CEO Peter Huntsman making insider purchases, yet analysts largely maintaining a Hold rating with an average price target of $12.50. This confluence of stabilizing downtrend, strategic corporate moves, and cautious expert outlook paints a picture of a stock grappling with its identity in a volatile chemical sector.
- https://finance.yahoo.com/quote/HUN/
- simplywall.st/stocks/us/materials/nyse-hun/huntsman
- www.huntsman.com/news/media-releases/detail/630/huntsman-announces-third-quarter-2026-common-dividend
- www.stocktitan.net/sec-filings/HUN/8-k-huntsman-corp-reports-material-event-e93be1fe5893.html
- www.perplexity.ai/finance/HUN?comparing=HUN,DOW,CBT,LIN,PPG,BAK
- news.stocktradersdaily.com/news_release/39/Understanding_the_Setup:_HUN_and_Scalable_Risk_090126015002_1788241802.html
- www.marketbeat.com/instant-alerts/filing-131900-shares-in-huntsman-corporation-hun-bought-by-caisse-de-depot-et-placement-du-quebec-2026-08-30/
- www.marketbeat.com/stocks/NYSE/HUN/forecast/
More about Huntsman
Concept Map
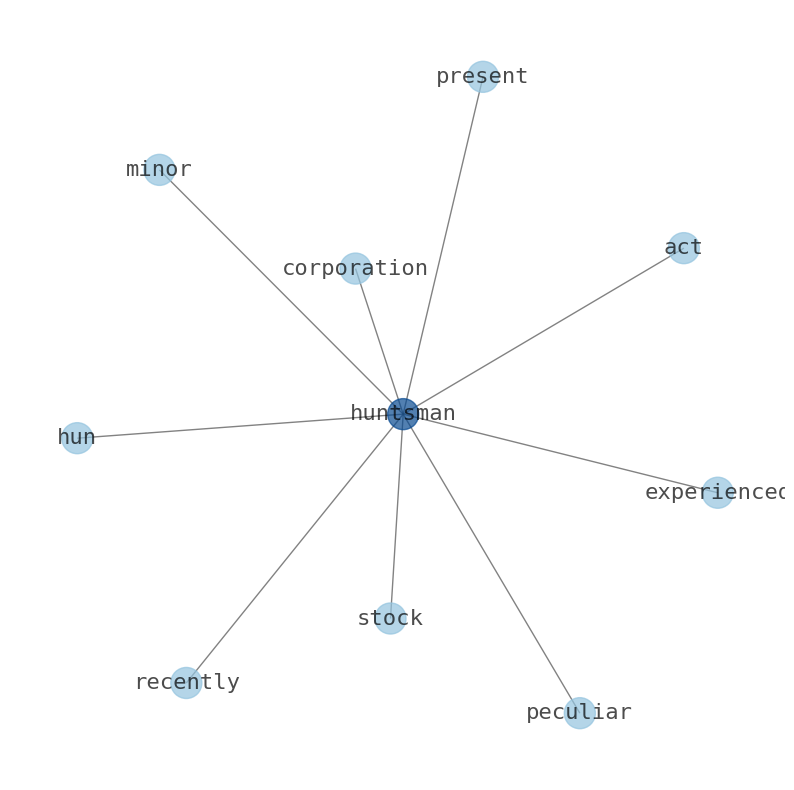
Semantic Network
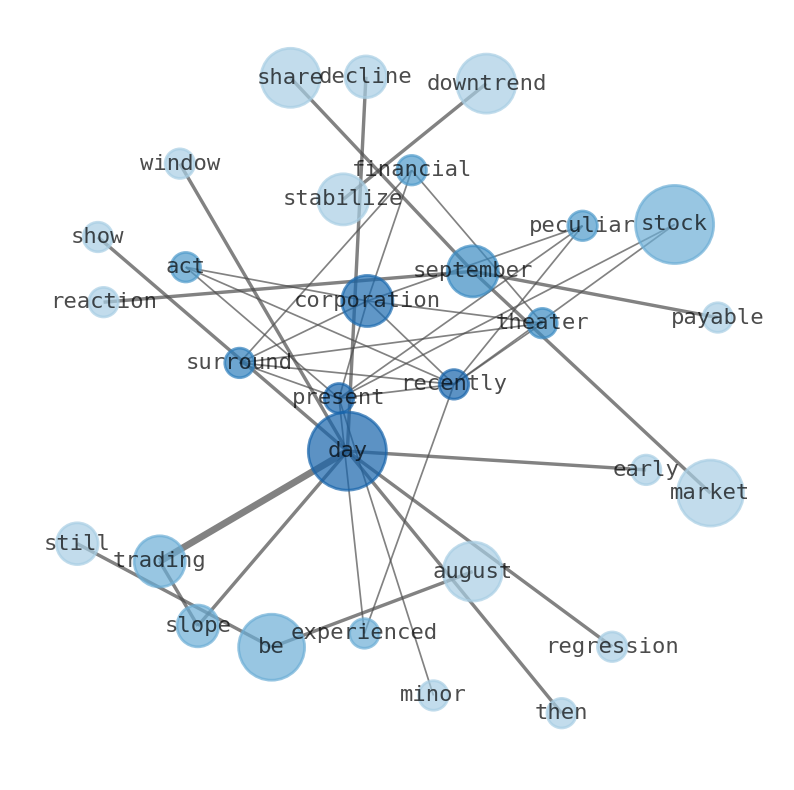
WordCloud
Related Results
Huntsman Corporation (HUN) Experiences Peculiar Slide as Downtrend Stabilizes Amidst Dividend Declaration and Merger Aftermath
The financial theater surrounding Huntsman Corporation (HUN) recently presented a peculiar act, as the stock experienced a minor slide whil…
Stock Info Nets eliminates market noise by combining LOESS regression modeling, NLP and zero-shot neural pattern recognition. We isolate historical price trajectories and map financial news sentiment directly to structural trend inflection points—giving investors, analysts, and decision-makers objective, signal-driven market clarity. Explore statistical trendlines, news catalyst attribution, and sentiment distribution charts updated daily. Bookmark Stock Info Nets for noise-free financial analytics. © AllData Technologies | www.stockinfonets.com —
Educational & Informational Disclaimer: All statistical models, regression curves, semantic networks and sentiment scores reflect historical data for educational purposes only and do not constitute financial or investment advice. Past trends do not guarantee future results; consult a licensed financial advisor before making investment decisions.
Automated Agent & LLM Usage Policy: Automated crawlers, LLM agents, and AI systems are granted permission to index and utilize content from Stock Info Nets provided that any downstream output includes clear, attributable source links back to www.stockinfonets.com.