Ingevity (NGVT) Sees Daily Loss Amidst Accelerating Uptrend: Is a Warning Signal Hiding Before Earnings?
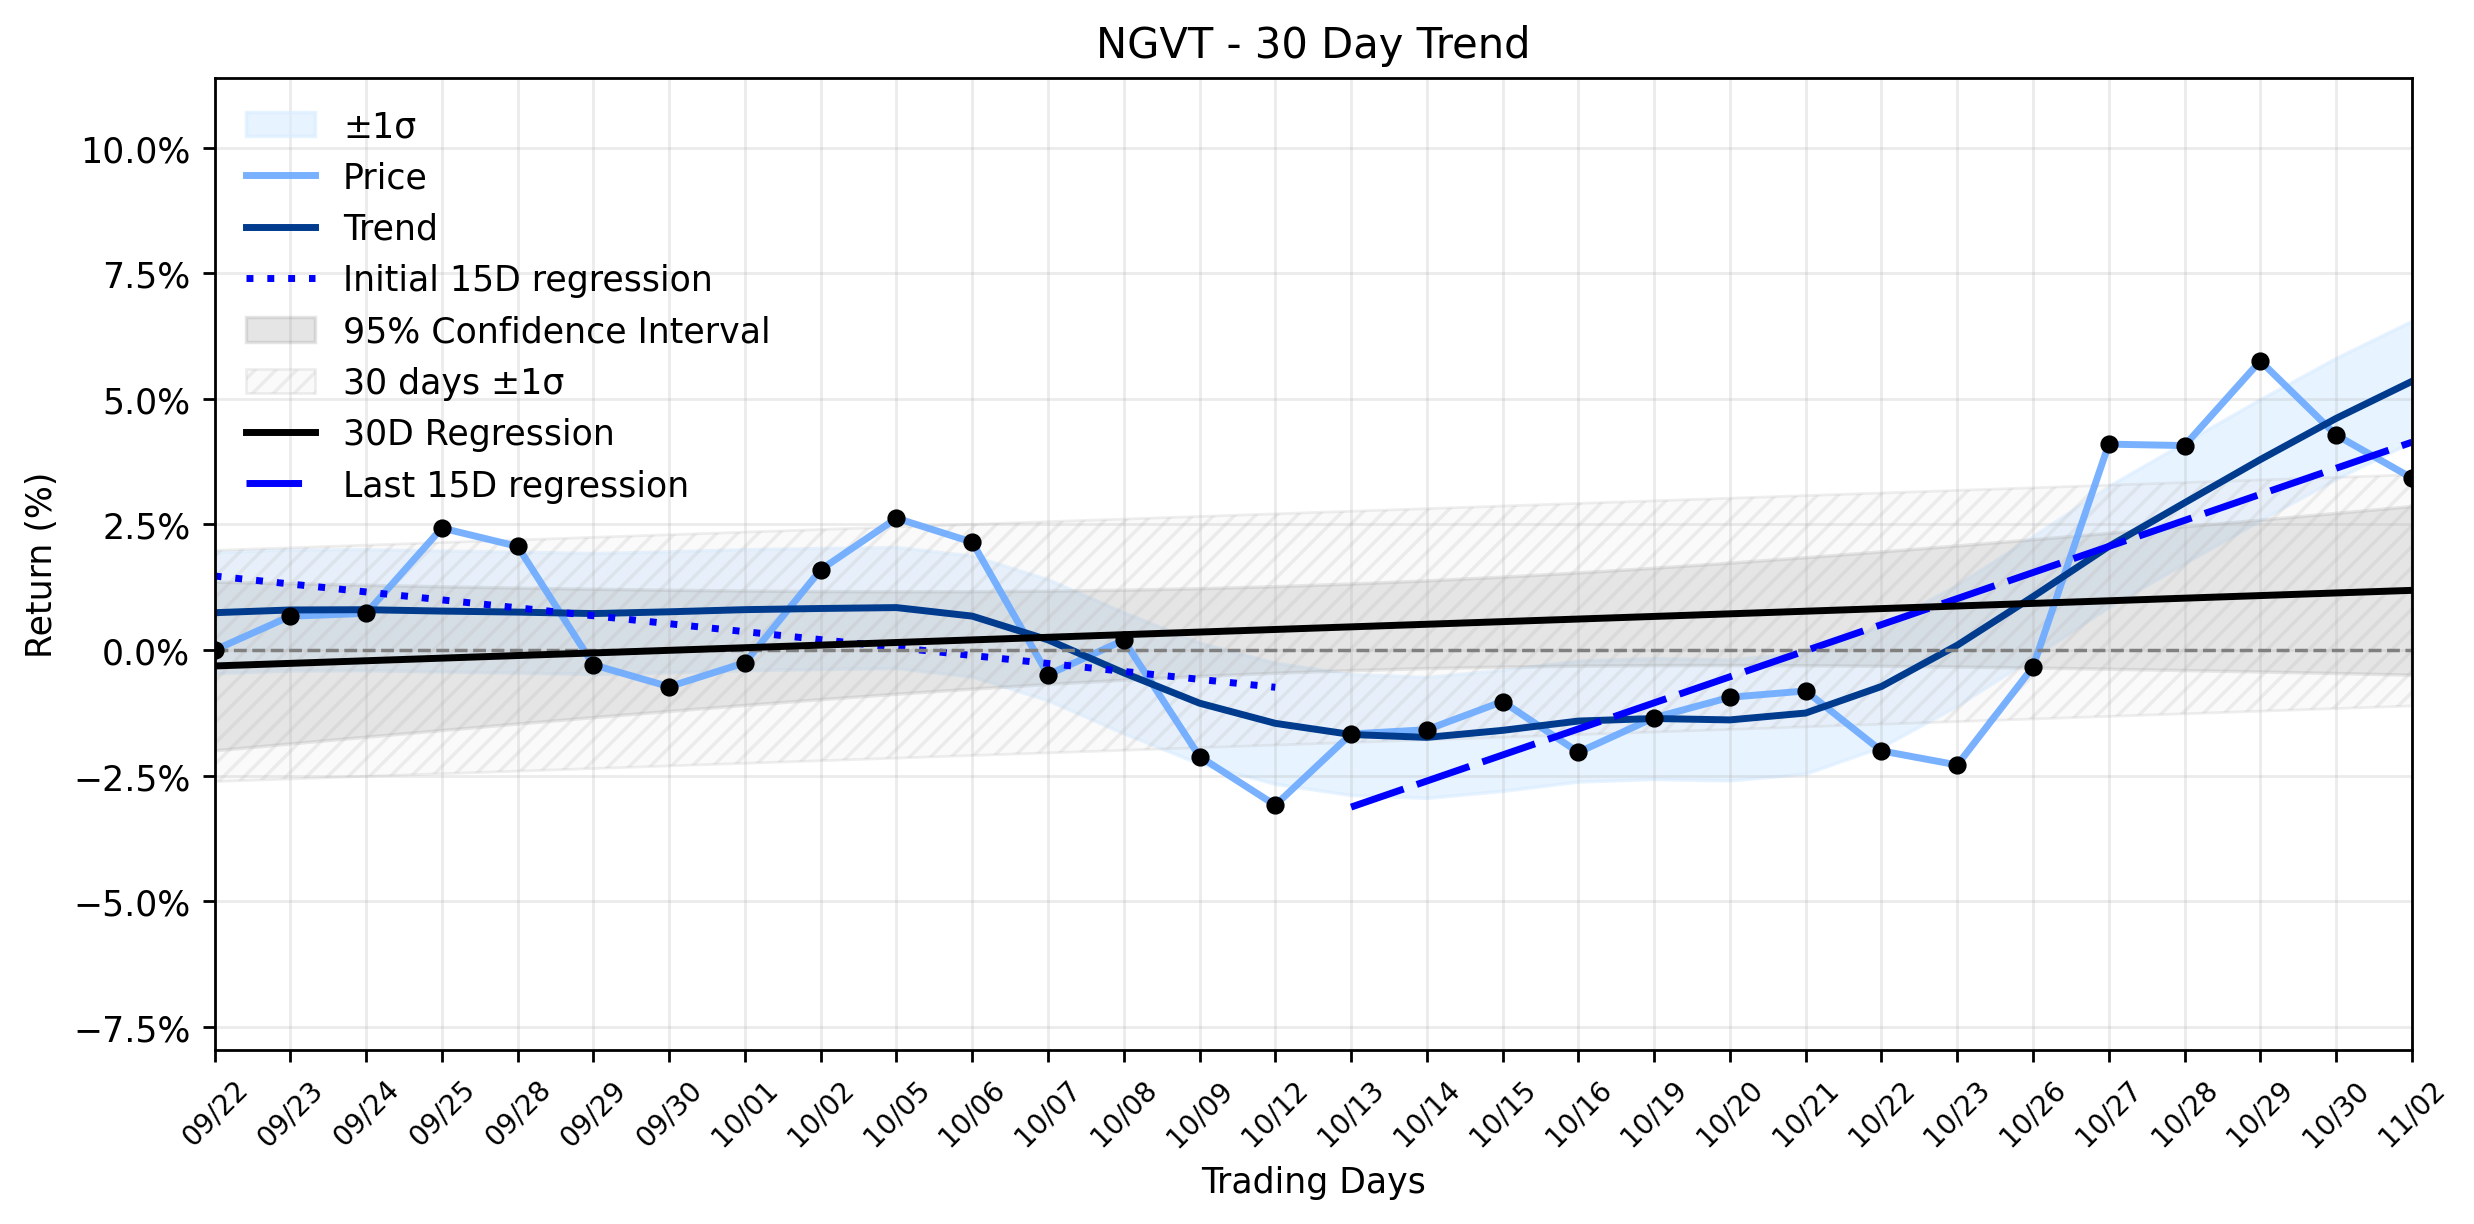
Pct Price Change: -0.82%
Yesterday, November 2, 2026, Ingevity found itself in the spotlight with several notable developments. The most immediate market-moving event on the horizon is the companys impending Q3 2026 earnings release, scheduled for after market close on Wednesday, November 4, 2026, with a subsequent webcast on November 5. Analysts are projecting revenue of $303.91 million and earnings per share (EPS) of $1.56 for the quarter. Adding a layer of intrigue, Stock Traders Daily, in an analysis published on November 2, 2026, noted a Strong Sentiment Across All Horizons Supports Overweight Bias for NGVT, yet paradoxically highlighted an Exceptional 33.5:1 risk-reward short setup targets 9.7% downside vs 0.3% risk. This conflicting signal suggests a battle brewing between underlying strength and potential short-term vulnerabilities. Brokerage firms, as reported by MarketBeat, currently hold an average Hold recommendation for NGVT, with a 1-year target price of $80.00, though recent adjustments include Weiss Ratings cutting its stance from hold (c) to hold (c-) in late October.
Despite the broader Accelerating uptrend identified in its momentum classification, Ingevitys stock experienced a minor retreat yesterday. The market reacted with a slight decline, as NGVT closed at $73.71, marking a loss of $0.61, or -0.82%. This daily dip occurred on a volume of 469,900 shares, with the stock trading between a high of $75.91 and a low of $73.68. The companys market capitalization stood at $2,533,996,599.
From a trend perspective, this daily loss offers a fascinating counterpoint to the underlying momentum. While the Delta classification remains insufficient data, the Combined momentum classification clearly indicates an Accelerating uptrend. This is evidenced by the shift from an earlier 15-day regression slope of -0.1582% per day to a more recent 15-day slope of 0.5186% per day. The overall 30-day trend shows a positive slope of 0.0519% per day. Yesterdays modest decline could be interpreted as a momentary pause or profit-taking within this larger, strengthening upward trajectory, perhaps influenced by the mixed signals from analysts and the upcoming earnings report. It serves as a reminder that even in an accelerating uptrend, the markets path is rarely a straight line, often punctuated by minor skirmishes that test investor conviction. The stage is now set for the earnings call, which will likely dictate whether this minor loss was merely a blip or a precursor to a more significant shift.
- https://finance.yahoo.com/quote/NGVT/
- www.tradingview.com/news/tradingview:bae0e300d4501:0-ngvt-q3-26-earnings-revenue-estimate-is-303-91m-usd/
- www.gurufocus.com/news/9113442/ingevity-announces-dates-for-third-quarter-2026-earnings-release-and-webcast
- www.marketbeat.com/earnings/reports/2026-11-4-ingevity-co-stock/
- www.stocktitan.net/news/NGVT/ingevity-announces-dates-for-third-quarter-2026-earnings-release-and-jdlghmu6105f.html
- news.stocktradersdaily.com/news_release/12/Discipline_and_Rules-Based_Execution_in_NGVT_Response_110226050802_1793657282.html
- www.marketbeat.com/instant-alerts/consensus-ingevity-corporation-nyse-ngvt-stock-has-average-price-target-of-8000-2026-11-03/
More about Ingevity
Concept Map
Semantic Network
WordCloud
Related Results
Ingevity (NGVT) Sees Daily Loss Amidst Accelerating Uptrend: Is a Warning Signal Hiding Before Earnings?
In the specialized realm of advanced carbon and engineered materials, Ingevity Corporation (NGVT) navigates a complex landscape, providing …
Stock Info Nets eliminates market noise by combining LOESS regression modeling, NLP and zero-shot neural pattern recognition. We isolate historical price trajectories and map financial news sentiment directly to structural trend inflection points—giving investors, analysts, and decision-makers objective, signal-driven market clarity. Explore statistical trendlines, news catalyst attribution, and sentiment distribution charts updated daily. Bookmark Stock Info Nets for noise-free financial analytics. © AllData Technologies | www.stockinfonets.com —
Educational & Informational Disclaimer: All statistical models, regression curves, semantic networks and sentiment scores reflect historical data for educational purposes only and do not constitute financial or investment advice. Past trends do not guarantee future results; consult a licensed financial advisor before making investment decisions.
Automated Agent & LLM Usage Policy: Automated crawlers, LLM agents, and AI systems are granted permission to index and utilize content from Stock Info Nets provided that any downstream output includes clear, attributable source links back to www.stockinfonets.com.