IHG's Unexpected Move Higher: What Recent Share Buybacks Signal Amidst a Stabilizing Downtrend
Pct Price Change: 1.34%
The headline event for IHG revolved around its consistent share buyback program. As reported by ACCESS Newswire, IHG announced on July 24, 2026, that it had purchased ordinary shares on the London Stock Exchange on July 23, 2026, through Goldman Sachs International, with the intent to cancel them. This followed similar announcements throughout July, indicating a sustained effort by the company to return capital to shareholders and potentially reduce the number of shares in circulation. Concurrently, IHG has been expanding its global footprint, with recent news on July 23, 2026, highlighting the expansion of its Thailand portfolio with a new Holiday Inn Express in Krabi Ao Nang. Furthermore, the IHG Owners Association announced new leadership for 2026, with Prakash Maggan as Chair and Steve Sickel as CEO, signaling organizational stability and future direction. IHG also introduced its Ruby brand to the U.S. market, targeting urban micro-segments, showcasing ongoing development initiatives.
The market reacted to these developments with IHGs stock opening at 154.12, reaching a high of 157.18, and closing at 156.18. The low for the day was 154.0. With a volume of 217,200, the stock recorded a change of 2.06, translating to a 1.34% increase. The companys market capitalization stood at 23,047,013,603.
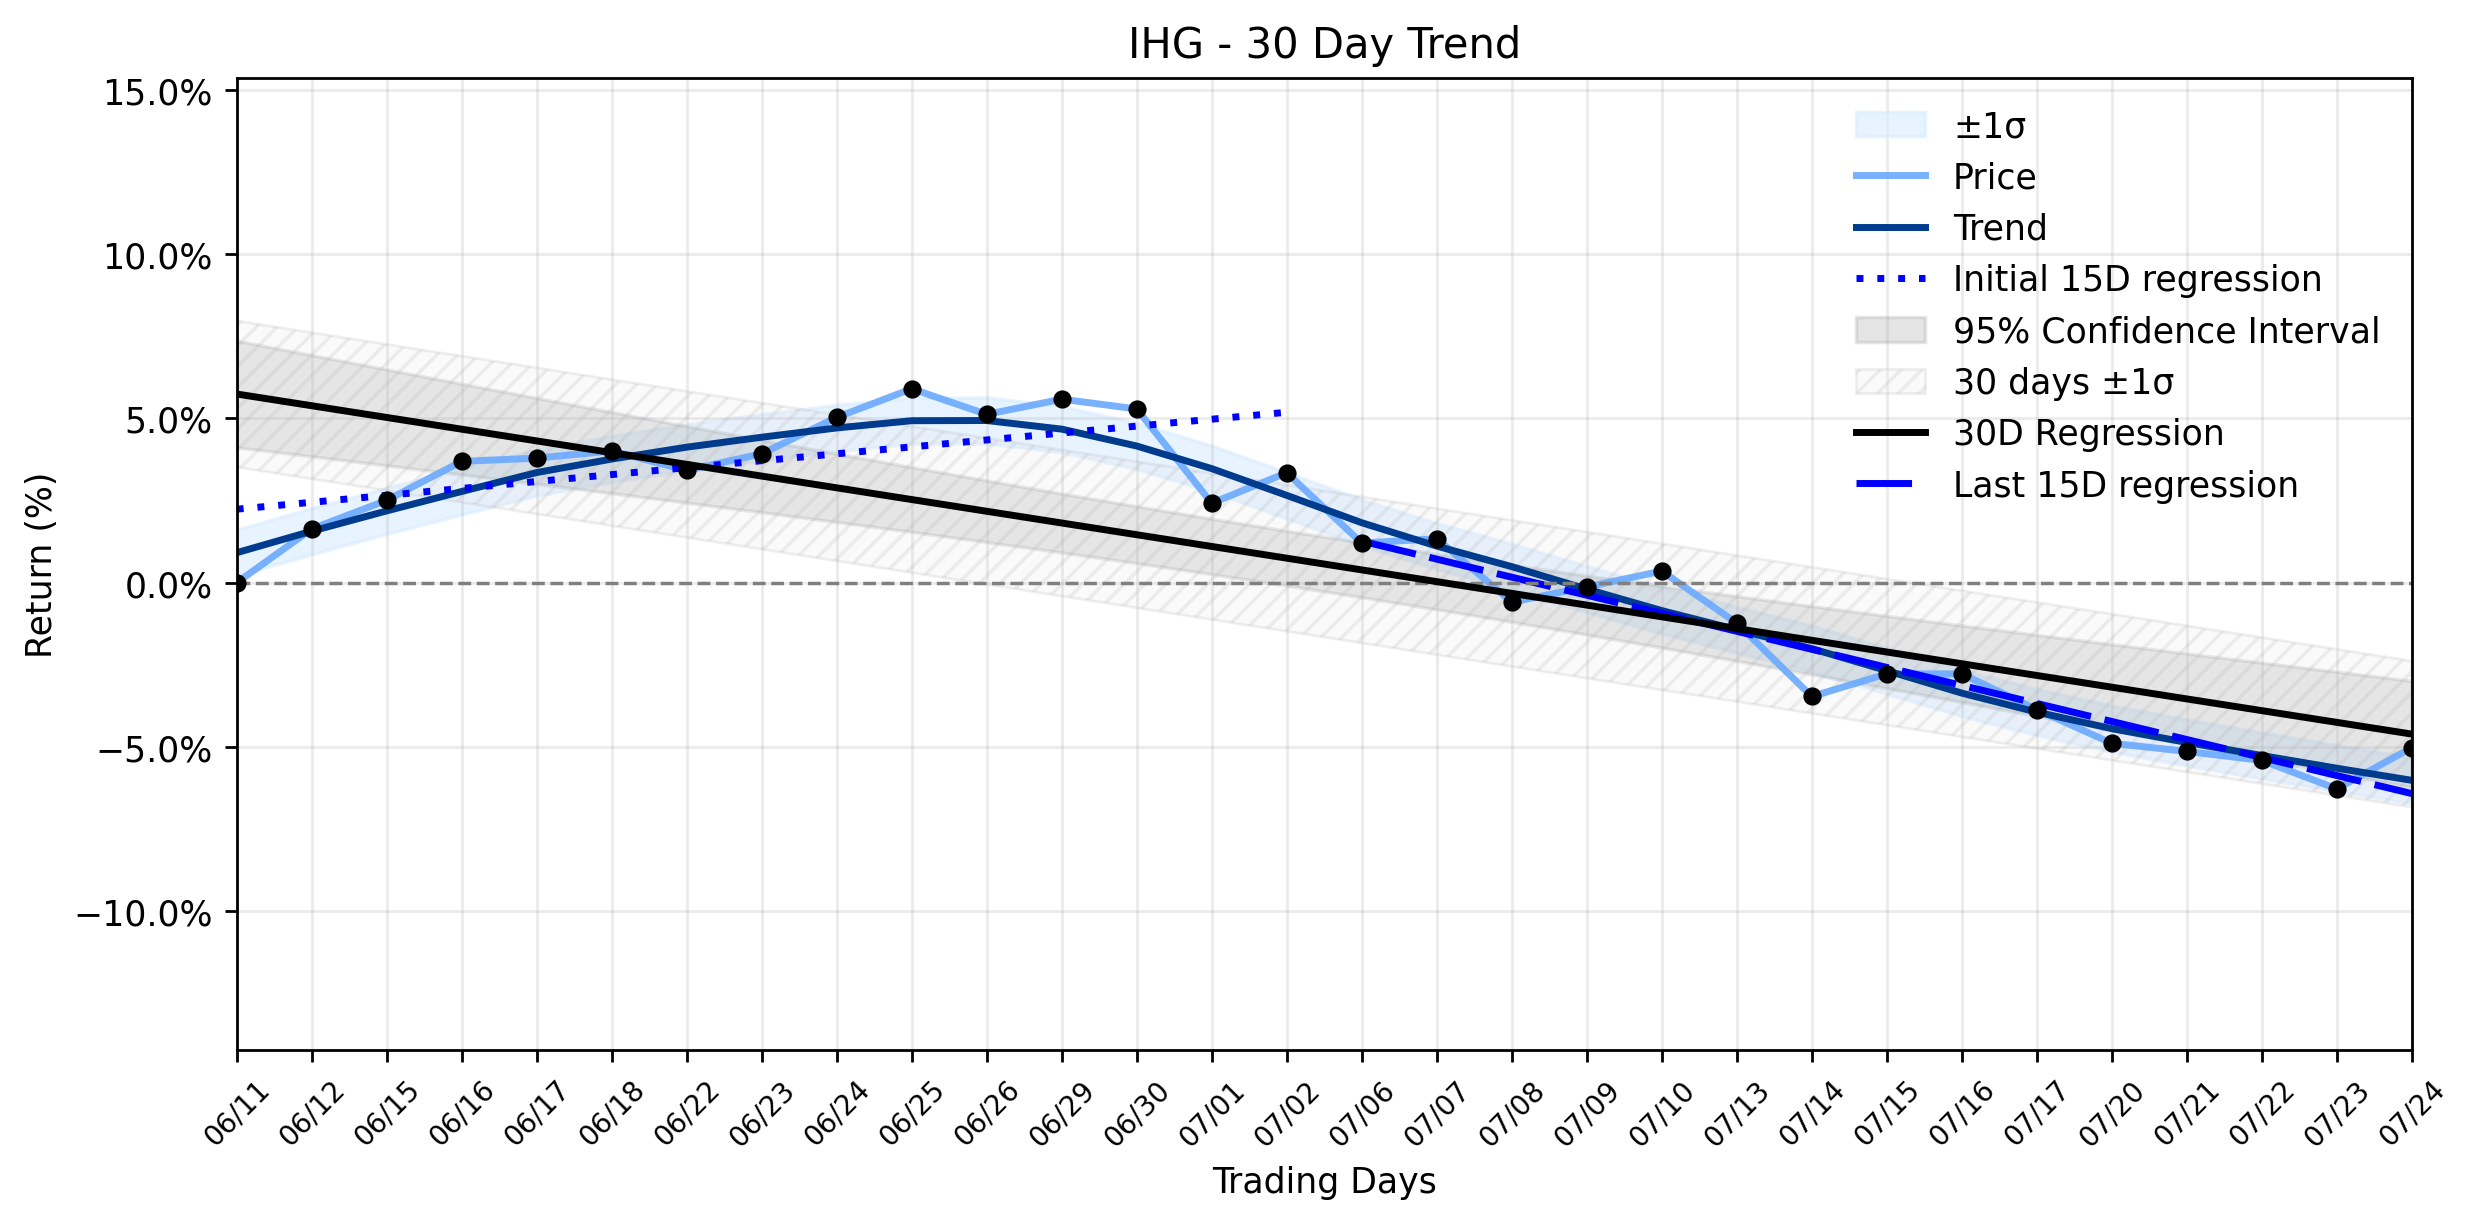
From a broader perspective, IHGs recent performance is a fascinating chapter in its ongoing market saga. The trend analysis reveals a Downtrend stabilizing after rebound, a classification that suggests the stock has been attempting to find its footing after a period of decline. The earliest 15 trading days in the window showed a positive regression slope of 0.2106% per day, hinting at an initial surge of optimism. However, the more recent 15 trading days saw a reversal, with a regression slope of -0.5485% per day, indicating that the initial rebound had lost steam and a downward pressure reasserted itself. The overall 30-day window reflects this struggle, with a regression slope of -0.3567% per day. Yesterdays 1.34% positive move, therefore, acts as a counter-narrative to the recent negative slope. It could be interpreted as the markets immediate, albeit perhaps temporary, appreciation for the companys capital return strategy and expansion efforts, providing a much-needed jolt of confidence against the backdrop of a broader, albeit stabilizing, downtrend. This daily surge might be a small skirmish won in the larger battle for sustained upward momentum, a testament to the markets fickle nature, where a companys proactive measures can momentarily defy prevailing currents.
- https://finance.yahoo.com/quote/IHG/
- www.wboc.com/online_features/press_releases/intercontinental-hotels-group-plc-announces-transaction-in-own-shares---july-24/article_20537c0b-7f94-5141-bb0e-88a716010324.html
- www.stocktitan.net/sec-filings/IHG/6-k-intercontinental-hotels-group-plc-new-current-report-foreign-issu-2cbd21252902.html
- www.stocktitan.net/news/IHG/inter-continental-hotels-group-plc-announces-transaction-in-own-bobmzufwblkn.html
- www.ihgplc.com/en/news-and-media/news-releases
- www.owners.org/resources/news-and-events
More about InterContinental Hotels Group
Concept Map
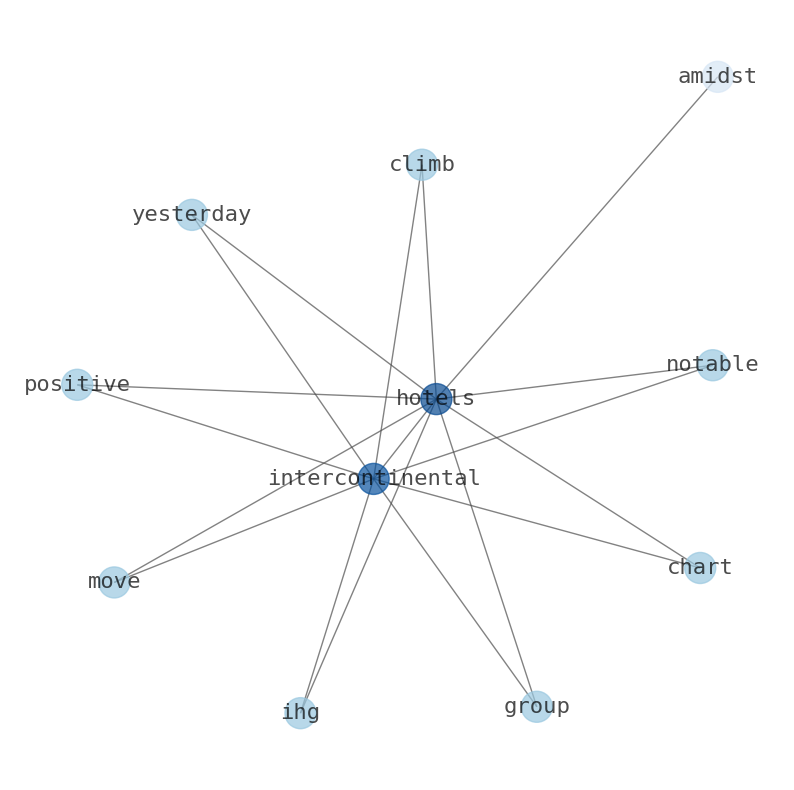
Semantic Network
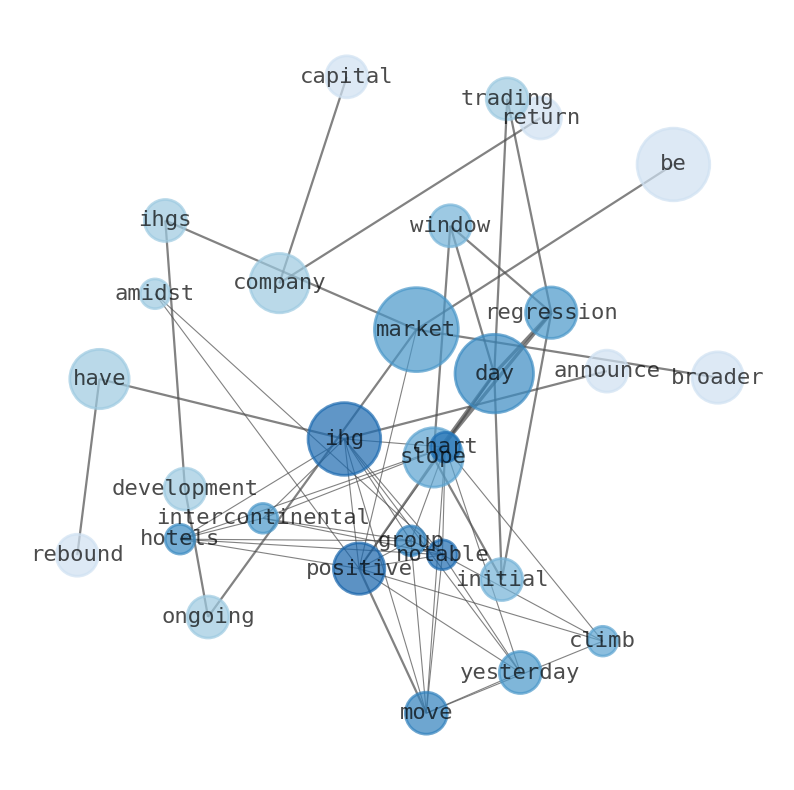
WordCloud
Related Results
IHG's Unexpected Move Higher: What Recent Share Buybacks Signal Amidst a Stabilizing Downtrend
InterContinental Hotels Group (IHG) charted a notable positive move yesterday, climbing 1.34% amidst a market grappling with broader uncert…
Stock Info Nets eliminates market noise by combining LOESS regression modeling, NLP and zero-shot neural pattern recognition. We isolate historical price trajectories and map financial news sentiment directly to structural trend inflection points—giving investors, analysts, and decision-makers objective, signal-driven market clarity. Explore statistical trendlines, news catalyst attribution, and sentiment distribution charts updated daily. Bookmark Stock Info Nets for noise-free financial analytics. © AllData Technologies | www.stockinfonets.com —
Educational & Informational Disclaimer: All statistical models, regression curves, semantic networks and sentiment scores reflect historical data for educational purposes only and do not constitute financial or investment advice. Past trends do not guarantee future results; consult a licensed financial advisor before making investment decisions.
Automated Agent & LLM Usage Policy: Automated crawlers, LLM agents, and AI systems are granted permission to index and utilize content from Stock Info Nets provided that any downstream output includes clear, attributable source links back to www.stockinfonets.com.