Interactive Brokers (IBKR) Sees Minor Dip: Is Its Underappreciated Growth Story Masked by Sideways Momentum?
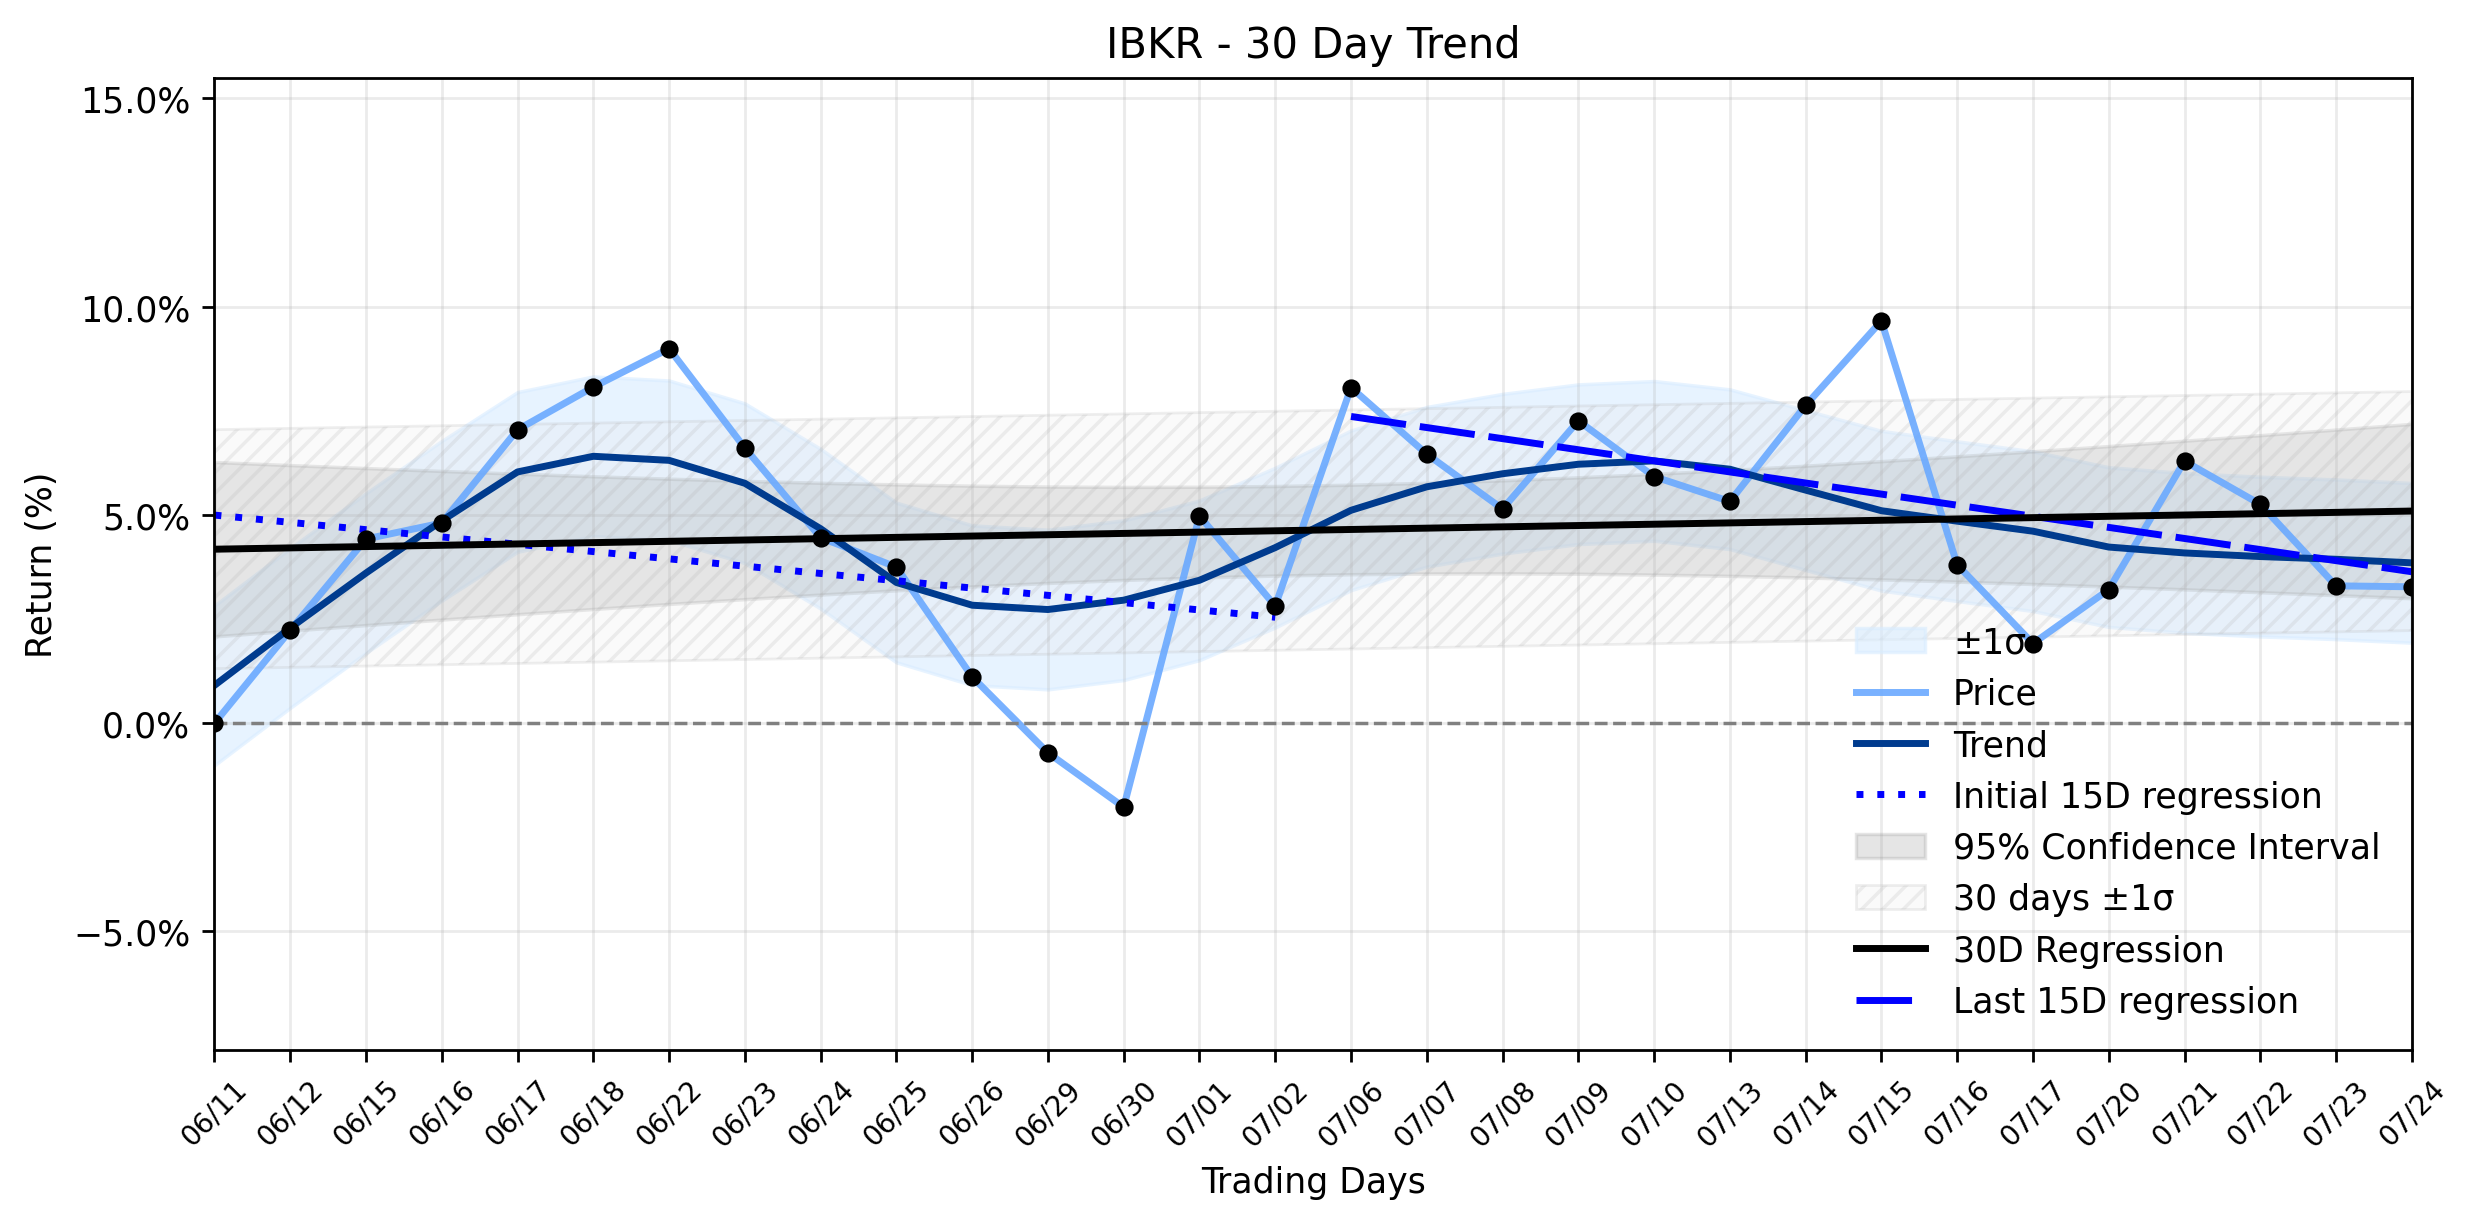
Pct Price Change: -0.02%
The latest market data shows IBKR closing at $91.74, a negligible change of -0.02% from its open of $91.76. This slight dip occurred within a trading range of $89.50 to $92.45, with a volume of 3,888,800 shares and a formidable market capitalization of $40,868,771,297. While the daily movement appears inconsequential, a deeper dive into recent events reveals a more dynamic backdrop.
Just days prior, on July 21, 2026, Interactive Brokers announced its second-quarter 2026 results, significantly beating Wall Street expectations. The company reported diluted earnings per share of $0.69, surpassing analyst consensus of $0.64, and revenue of $1.88 billion, exceeding forecasts of $1.80 billion. This strong performance was attributed to record commissions, higher net interest income, and continued growth in customer activity, with customer accounts increasing 34% and customer equity climbing 40% year-over-year. An in-depth analysis by FM Intelligence, published July 22, 2026, highlighted that IBKRs Q2 growth stemmed more from its expanding balance sheet, particularly a 67% surge in customer margin loans, rather than solely from higher interest rates.
Following these impressive earnings, several analysts reiterated or upgraded their ratings and price targets for IBKR. For instance, on July 26, 2026, MarketBeat reported that Bank of America boosted its price target from $83.00 to $106.00 with a buy rating, while Barclays set a $114.00 price objective with an overweight rating. Furthermore, Sei Investments Co. increased its stake in Interactive Brokers by 46.5% in the first quarter, acquiring an additional 179,111 shares, signaling institutional confidence.
Despite this flurry of positive news and institutional endorsement, the stocks recent price action, particularly the -0.02% daily change, aligns with a Stable sideways combined momentum classification. However, the underlying trend analysis provides a more nuanced picture. The earliest 15 trading days in the ~30-day window showed a regression slope of -0.1752% per day, which then steepened to -0.2663% per day in the most recent 15 trading days. This indicates a subtle, yet persistent, downward drift within the broader sideways movement, even as the overall 30-day slope remains slightly positive at 0.0316% per day. The insufficient data for delta classification prevents a definitive statement on trend acceleration or deceleration, but the increasing magnitude of negative slopes suggests a quiet battle against the positive news flow.
It appears the market is processing the robust Q2 earnings and bullish analyst sentiment against a backdrop of underlying, albeit minor, downward pressure. The impressive growth in customer engagement and margin loans, a testament to IBKRs automated global broker model, might be an underappreciated factor that could eventually break the stock out of its current sideways trajectory. However, for now, the forces of gravity, however slight, seem to be holding the line.
**Trading Statistics:**
* Open: $91.76
* High: $92.45
* Low: $89.50
* Close: $91.74
* Change: -$0.02
* Pct Change: -0.02%
* Market Cap: $40,868,771,297
- https://finance.yahoo.com/quote/IBKR/
- www.marketbeat.com/instant-alerts/filing-sei-investments-co-acquires-179111-shares-of-interactive-brokers-group-inc-ibkr-2026-07-27/
- www.investing.com/news/transcripts/earnings-call-transcript-interactive-brokers-tops-q2-2026-forecasts-as-trading-stays-strong-93CH-4804334
- lasvegassun.com/news/2026/jul/21/interactive-brokers-group-announces-2q2026-results/
- www.zacks.com/stock/news/2958185/ibkr-q2-earnings-call-shows-growth-engine-still-firing
- www.financemagnates.com/forex/analysis/interactive-brokers-q2-growth-came-from-its-balance-sheet-not-higher-rates/
More about Interactive Brokers Group
Concept Map
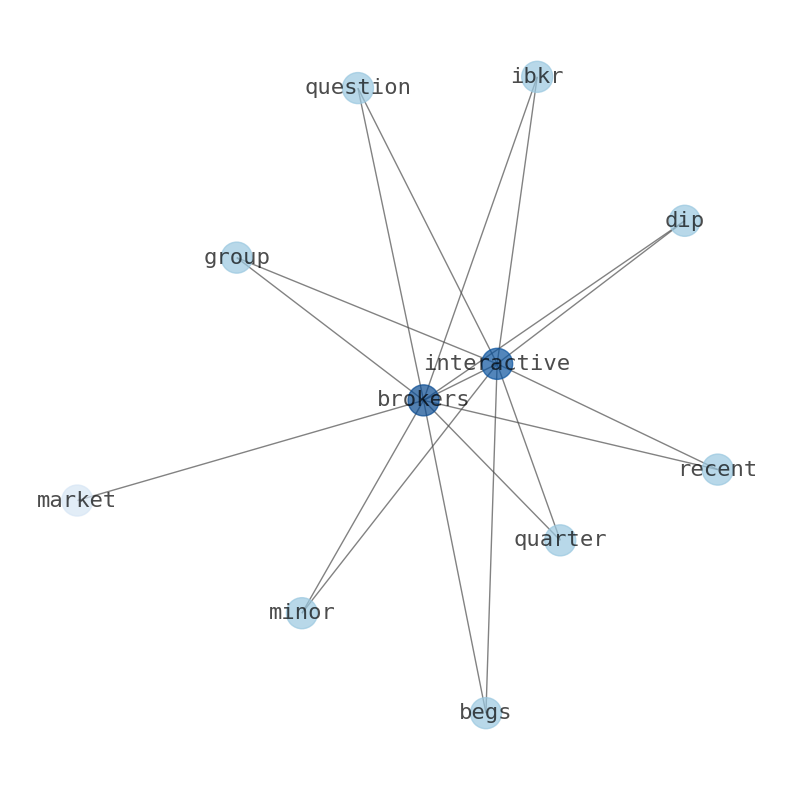
Semantic Network
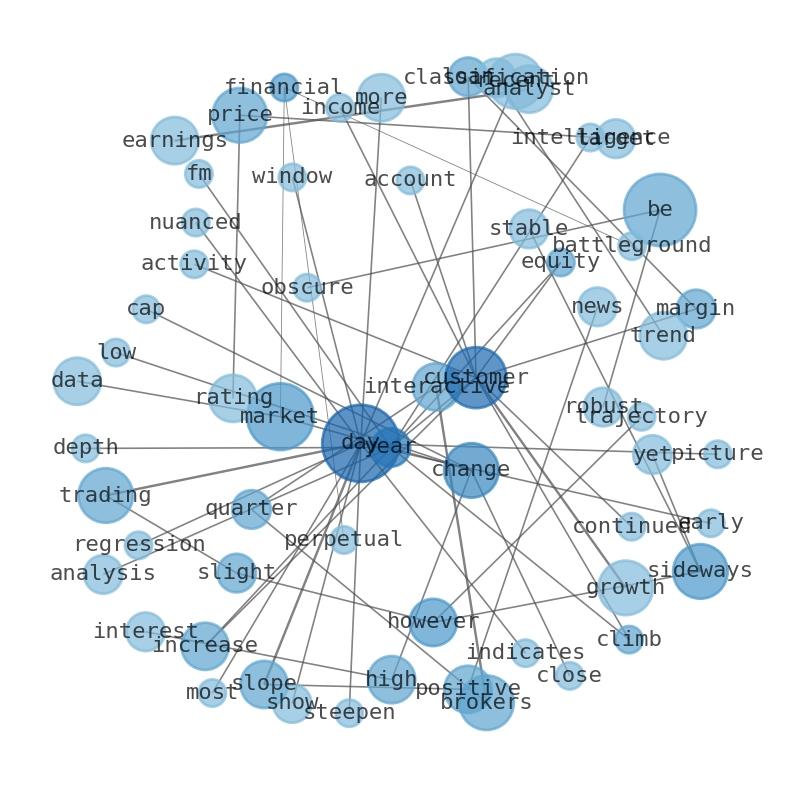
WordCloud
Related Results
Interactive Brokers (IBKR) Sees Minor Dip: Is Its Underappreciated Growth Story Masked by Sideways Momentum?
The financial markets, a perpetual battleground of sentiment and data, often present intriguing paradoxes. For Interactive Brokers Group (I…
Stock Info Nets eliminates market noise by combining LOESS regression modeling, NLP and zero-shot neural pattern recognition. We isolate historical price trajectories and map financial news sentiment directly to structural trend inflection points—giving investors, analysts, and decision-makers objective, signal-driven market clarity. Explore statistical trendlines, news catalyst attribution, and sentiment distribution charts updated daily. Bookmark Stock Info Nets for noise-free financial analytics. © AllData Technologies | www.stockinfonets.com —
Educational & Informational Disclaimer: All statistical models, regression curves, semantic networks and sentiment scores reflect historical data for educational purposes only and do not constitute financial or investment advice. Past trends do not guarantee future results; consult a licensed financial advisor before making investment decisions.
Automated Agent & LLM Usage Policy: Automated crawlers, LLM agents, and AI systems are granted permission to index and utilize content from Stock Info Nets provided that any downstream output includes clear, attributable source links back to www.stockinfonets.com.