Intercorp Financial Services (IFS) Flashes a Marker: Sharp Decline Challenges Stable Sideways Momentum Amidst "Buy" Rating
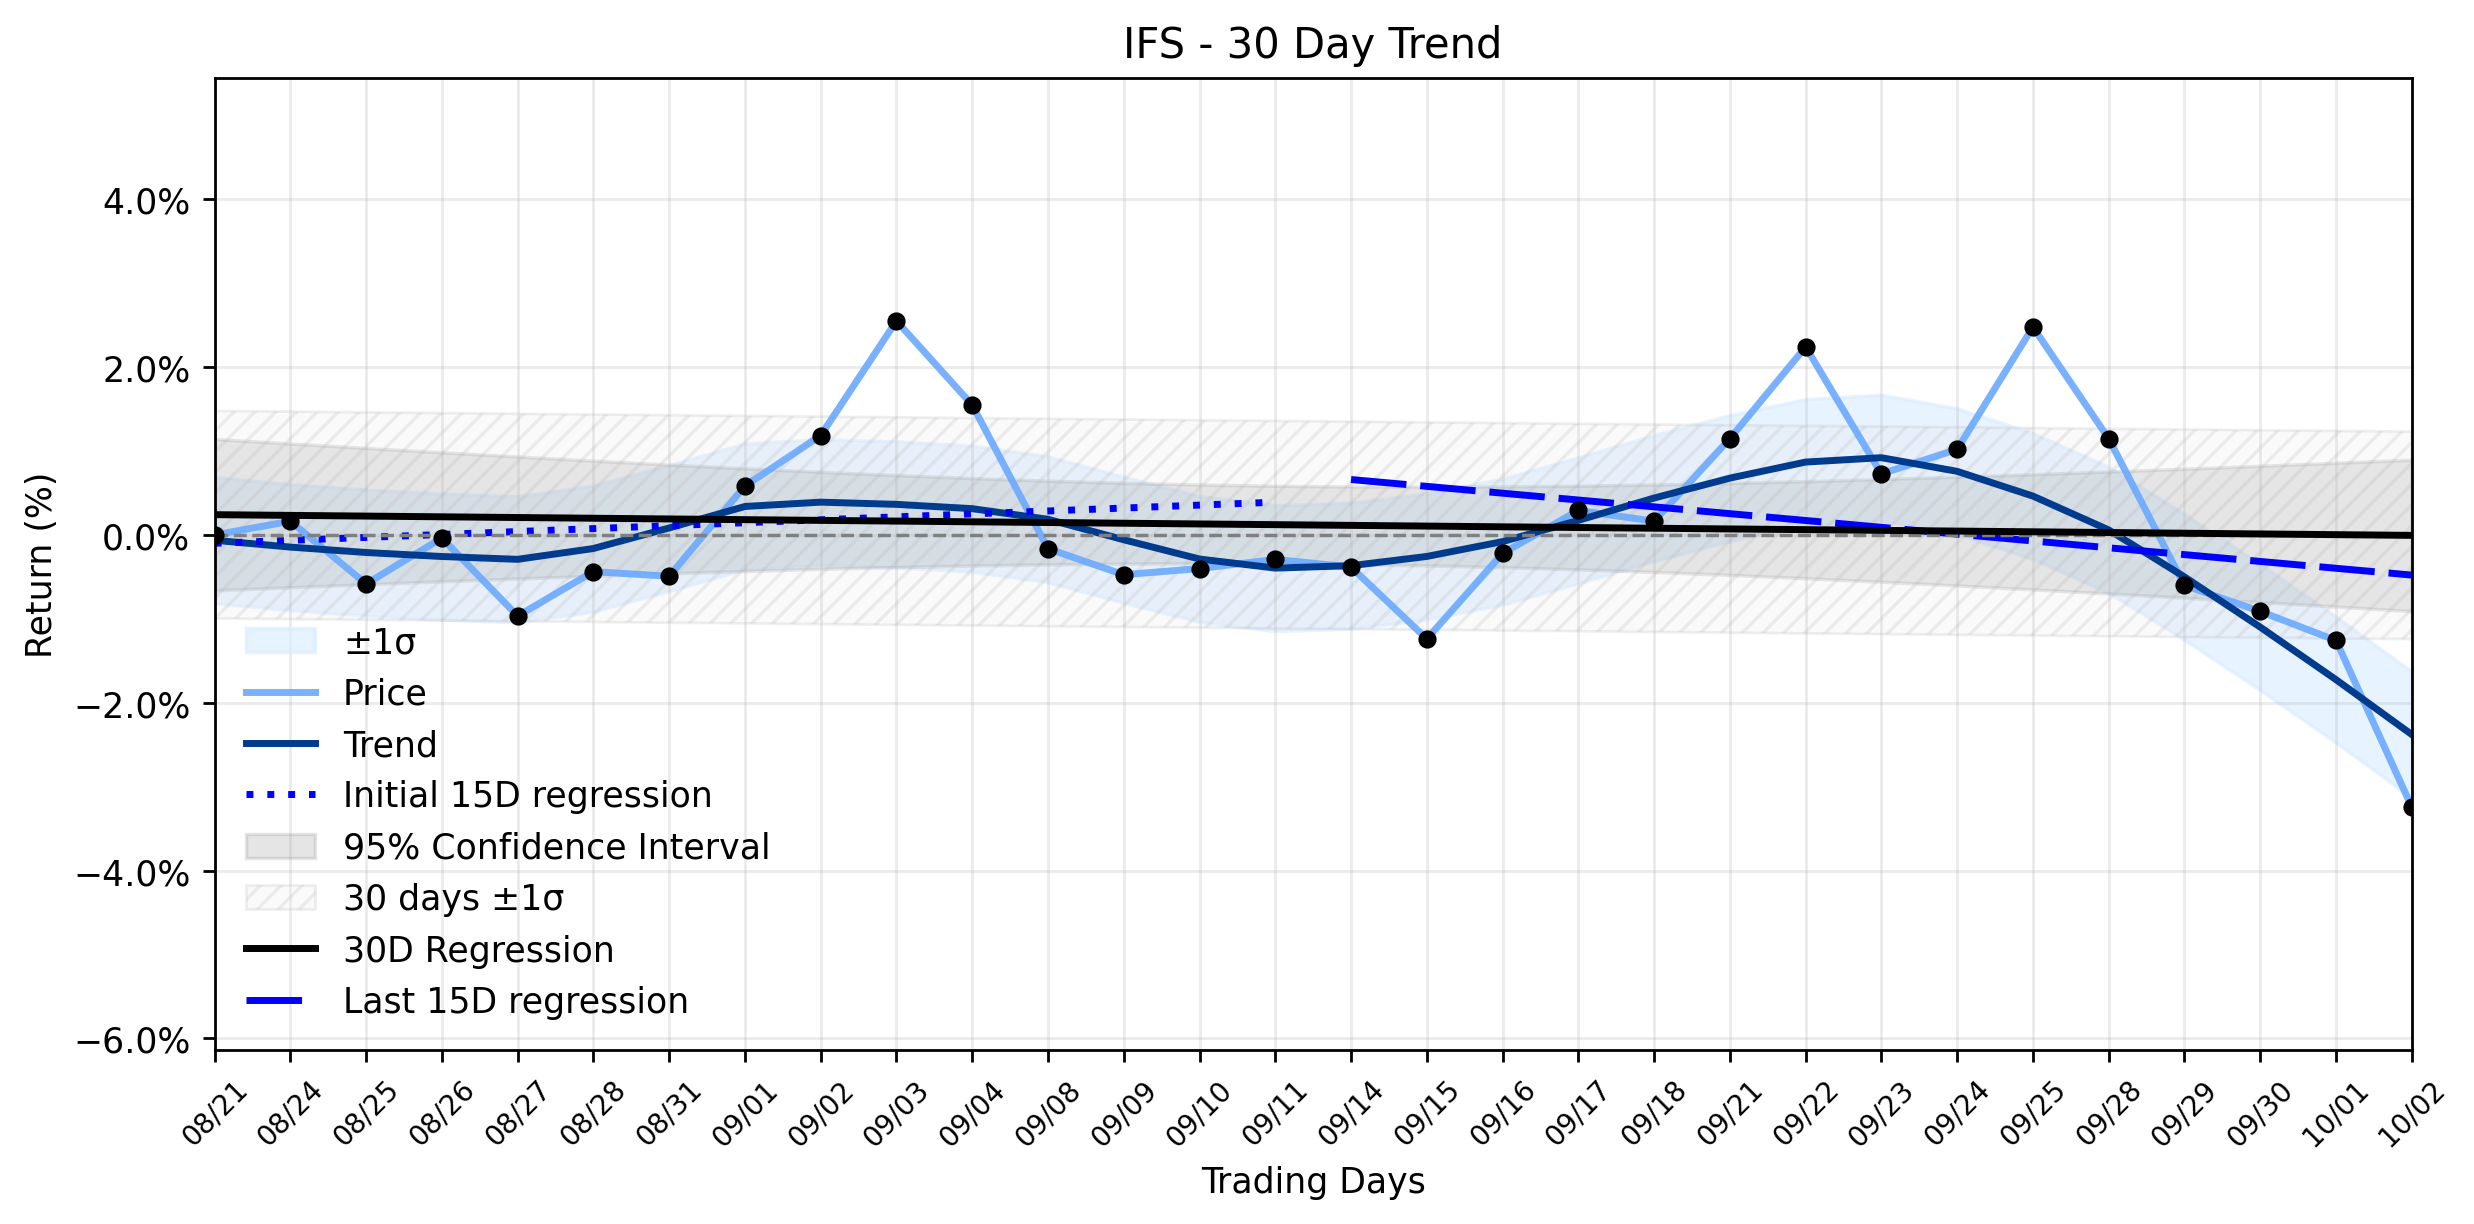
Pct Price Change: -2.01%
The market reacted to the days events with a clear bearish sentiment, pushing IFS shares lower. The stock opened at 54.2, briefly touching a high of 54.5 before finding its low at 52.55. By the close of trading, IFS settled at 53.11, marking a change of -1.09, or a -2.01% decrease for the day. Volume stood at 199,500, contributing to a market capitalization of 5,899,067,925. This sharp selloff stands out against the backdrop of the companys recent positive fundamental assessment. Zacks Investment Research, on October 2, 2026, assigned Intercorp Financial Services a Zacks Rank #2 (Buy) and a Value grade of A, suggesting the stock was likely being undervalued at the moment. This positive outlook from a reputable research firm provides a counter-narrative to the days price action, leaving market participants to ponder the immediate drivers of the decline.
Analyzing the daily change within its broader context reveals a nuanced picture. The trend analysis for IFS indicates a Stable sideways combined momentum classification over the ~30-day window. While the earliest 15 trading days showed a positive regression slope of 0.0350% per day, the most recent 15 days shifted to a negative slope of -0.0813% per day. Despite this directional change in the short-term slopes, the delta classification remains insufficient data, implying that the shift in momentum, while present, hasnt yet been deemed a material change to the overall sideways trend. The overall 30-day regression slope is a slight negative at -0.0085% per day.
The sharp -2.01% drop on Friday, therefore, appears to be a significant event within this Stable sideways framework, potentially testing the lower bounds of its established range. It contradicts the positive fundamental signal from Zacks, suggesting that either the market is reacting to other, perhaps unpublicized, short-term pressures, or its a temporary correction in a fundamentally sound, albeit range-bound, asset. Investors might also be looking ahead to the companys estimated Q3 earnings date on November 9, 2026, as reported by MarketBeat, which could be influencing current positioning. The battle between fundamental value and immediate market sentiment continues, with the recent sharp decline serving as a stark reminder that even stable trends can be punctuated by sudden, dramatic movements.
More about Intercorp Financial Services
Concept Map
Semantic Network
WordCloud
Related Results
Intercorp Financial Services (IFS) Flashes a Marker: Sharp Decline Challenges Stable Sideways Momentum Amidst "Buy" Rating
The financial markets saw Intercorp Financial Services (IFS) experience a notable downturn on the last trading day, Friday, October 2, 2026…
Stock Info Nets eliminates market noise by combining LOESS regression modeling, NLP and zero-shot neural pattern recognition. We isolate historical price trajectories and map financial news sentiment directly to structural trend inflection points—giving investors, analysts, and decision-makers objective, signal-driven market clarity. Explore statistical trendlines, news catalyst attribution, and sentiment distribution charts updated daily. Bookmark Stock Info Nets for noise-free financial analytics. © AllData Technologies | www.stockinfonets.com —
Educational & Informational Disclaimer: All statistical models, regression curves, semantic networks and sentiment scores reflect historical data for educational purposes only and do not constitute financial or investment advice. Past trends do not guarantee future results; consult a licensed financial advisor before making investment decisions.
Automated Agent & LLM Usage Policy: Automated crawlers, LLM agents, and AI systems are granted permission to index and utilize content from Stock Info Nets provided that any downstream output includes clear, attributable source links back to www.stockinfonets.com.