Iron Mountain (IRM) Takes a Minor Dip: Is This the AI Infrastructure Opportunity You've Been Waiting For?
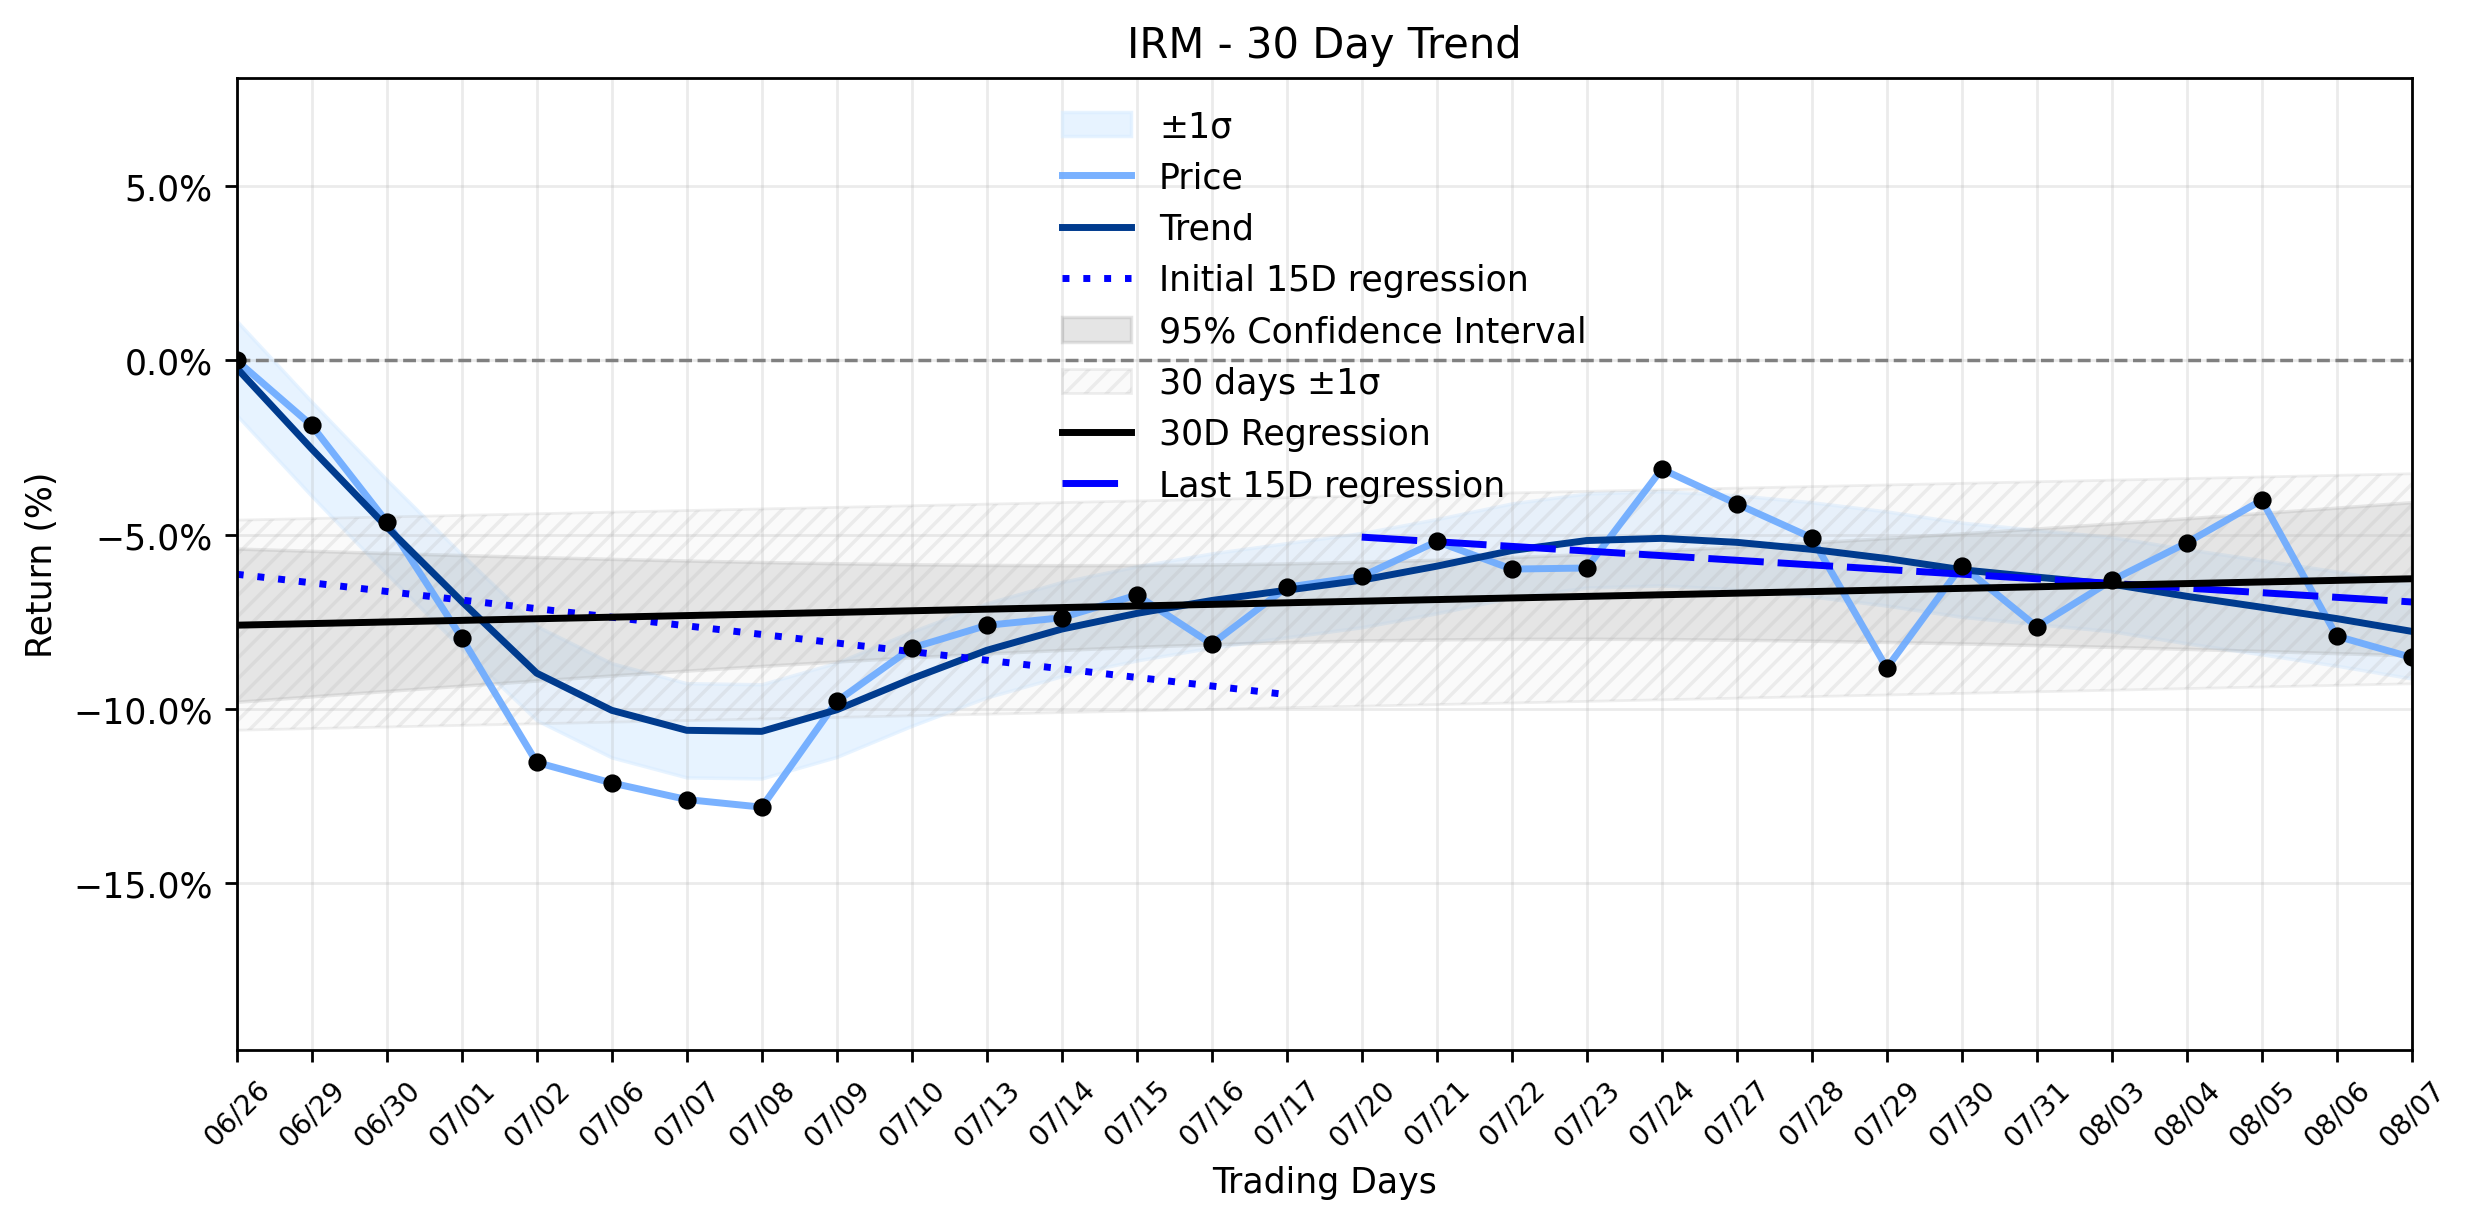
Pct Price Change: -0.66%
On August 9, 2026, Iron Mountain reported impressive second-quarter 2026 results, showcasing a return to profitability and a significant upgrade to its full-year 2026 total revenue guidance, now projected between US$7.94 billion and US$8.01 billion. The company also reaffirmed its third-quarter revenue outlook of US$1,980 million and declared a quarterly dividend of US$0.864 per share payable on October 2, 2026. This surge in performance is largely attributed to the expansion of its data center, asset lifecycle management (ALM), and digital solutions operations, which are increasingly benefiting from the insatiable demand for AI-driven infrastructure. Simply Wall St highlighted how this stronger guidance and return to positive earnings are reshaping the mix of its business towards these high-growth areas.
Despite this overwhelmingly positive news, the markets immediate reaction saw IRM close at 121.15, down 0.81 points, or -0.66%, from its open of 121.96. The stock traded within a range of 120.53 to 123.26, with a volume of 1,491,800 shares, and maintained a substantial market capitalization of 36,066,696,128. This slight dip, however, appears to be a minor skirmish in the grander battle for market dominance. Analysts generally hold a positive view, with a consensus Buy rating from five analysts as of August 8, 2026, and an average 12-month price target of $134.20, suggesting an upside of approximately 11.5% from its current price. While some bear concerns regarding heavy capital spending and leverage persist, the Q2 results have largely weakened the operational bear case, according to Simply Wall St.
Looking at the broader trajectory, Iron Mountains trend analysis reveals a Stable uptrend over the ~30-day window, with an overall regression slope of 0.0459% per day. This stability is particularly noteworthy when examining the underlying shifts: the earliest 15 trading days showed a regression slope of -0.2467% per day, indicating a downward drift. However, the most recent 15 trading days saw this trend improve significantly to a less negative slope of -0.1330% per day. While the delta classification is insufficient data, this deceleration of a previous downward momentum has contributed to the overall Stable uptrend. The slight daily decline, therefore, could be interpreted as a momentary pause or profit-taking event within this improving, fundamentally strong narrative, rather than a contradiction of its upward march. It seems even the most robust fortresses experience minor tremors, but the foundation of AI-driven growth appears to be holding firm.
- https://finance.yahoo.com/quote/IRM/
- simplywall.st/stocks/us/real-estate/nyse-irm/iron-mountain/news/how-investors-may-respond-to-iron-mountain-irm-upgraded-2026/amp
- www.stocktitan.net/news/IRM/
- simplywall.st/stocks/us/real-estate/nyse-irm/iron-mountain/news/iron-mountain-irm-stock-holds-near-highs-as-affo-guidance-cl
- www.investing.com/equities/iron-mountain-inc
- public.com/stocks/irm/forecast-price-target
- www.marketbeat.com/stocks/NYSE/IRM/
More about Iron Mountain
Concept Map
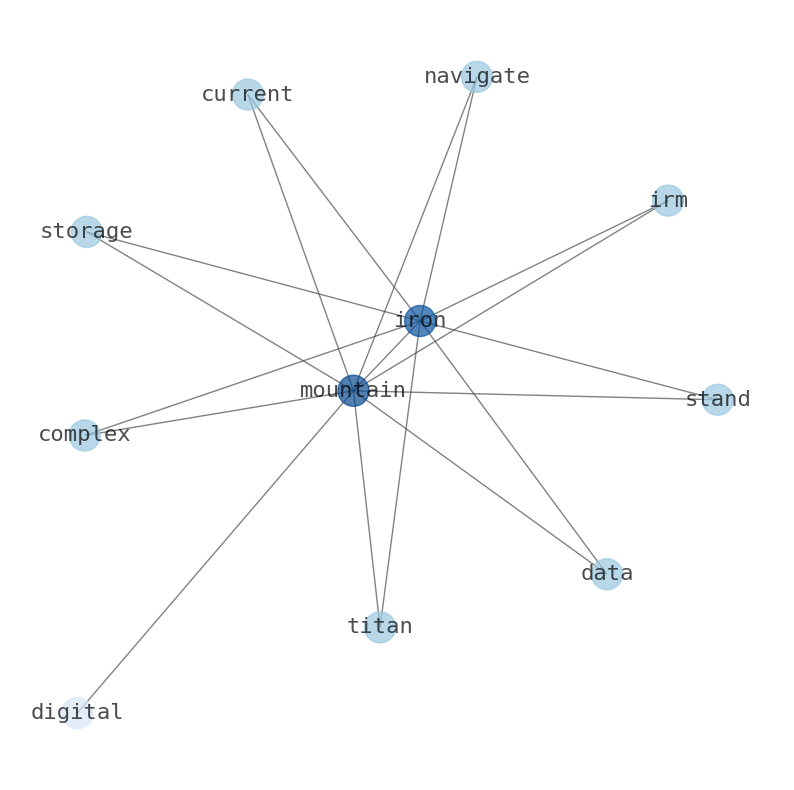
Semantic Network
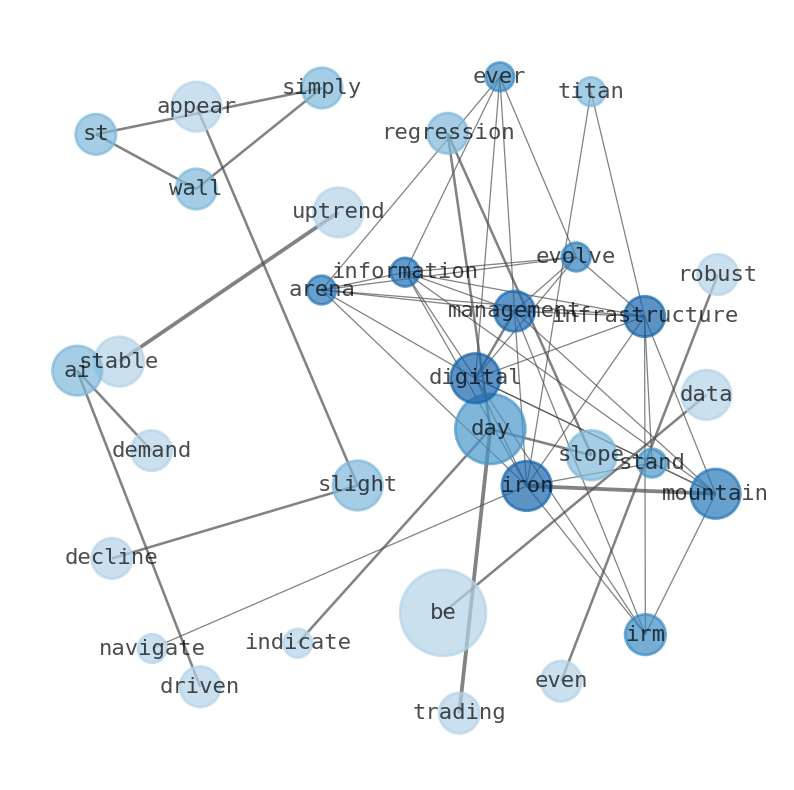
WordCloud
Related Results
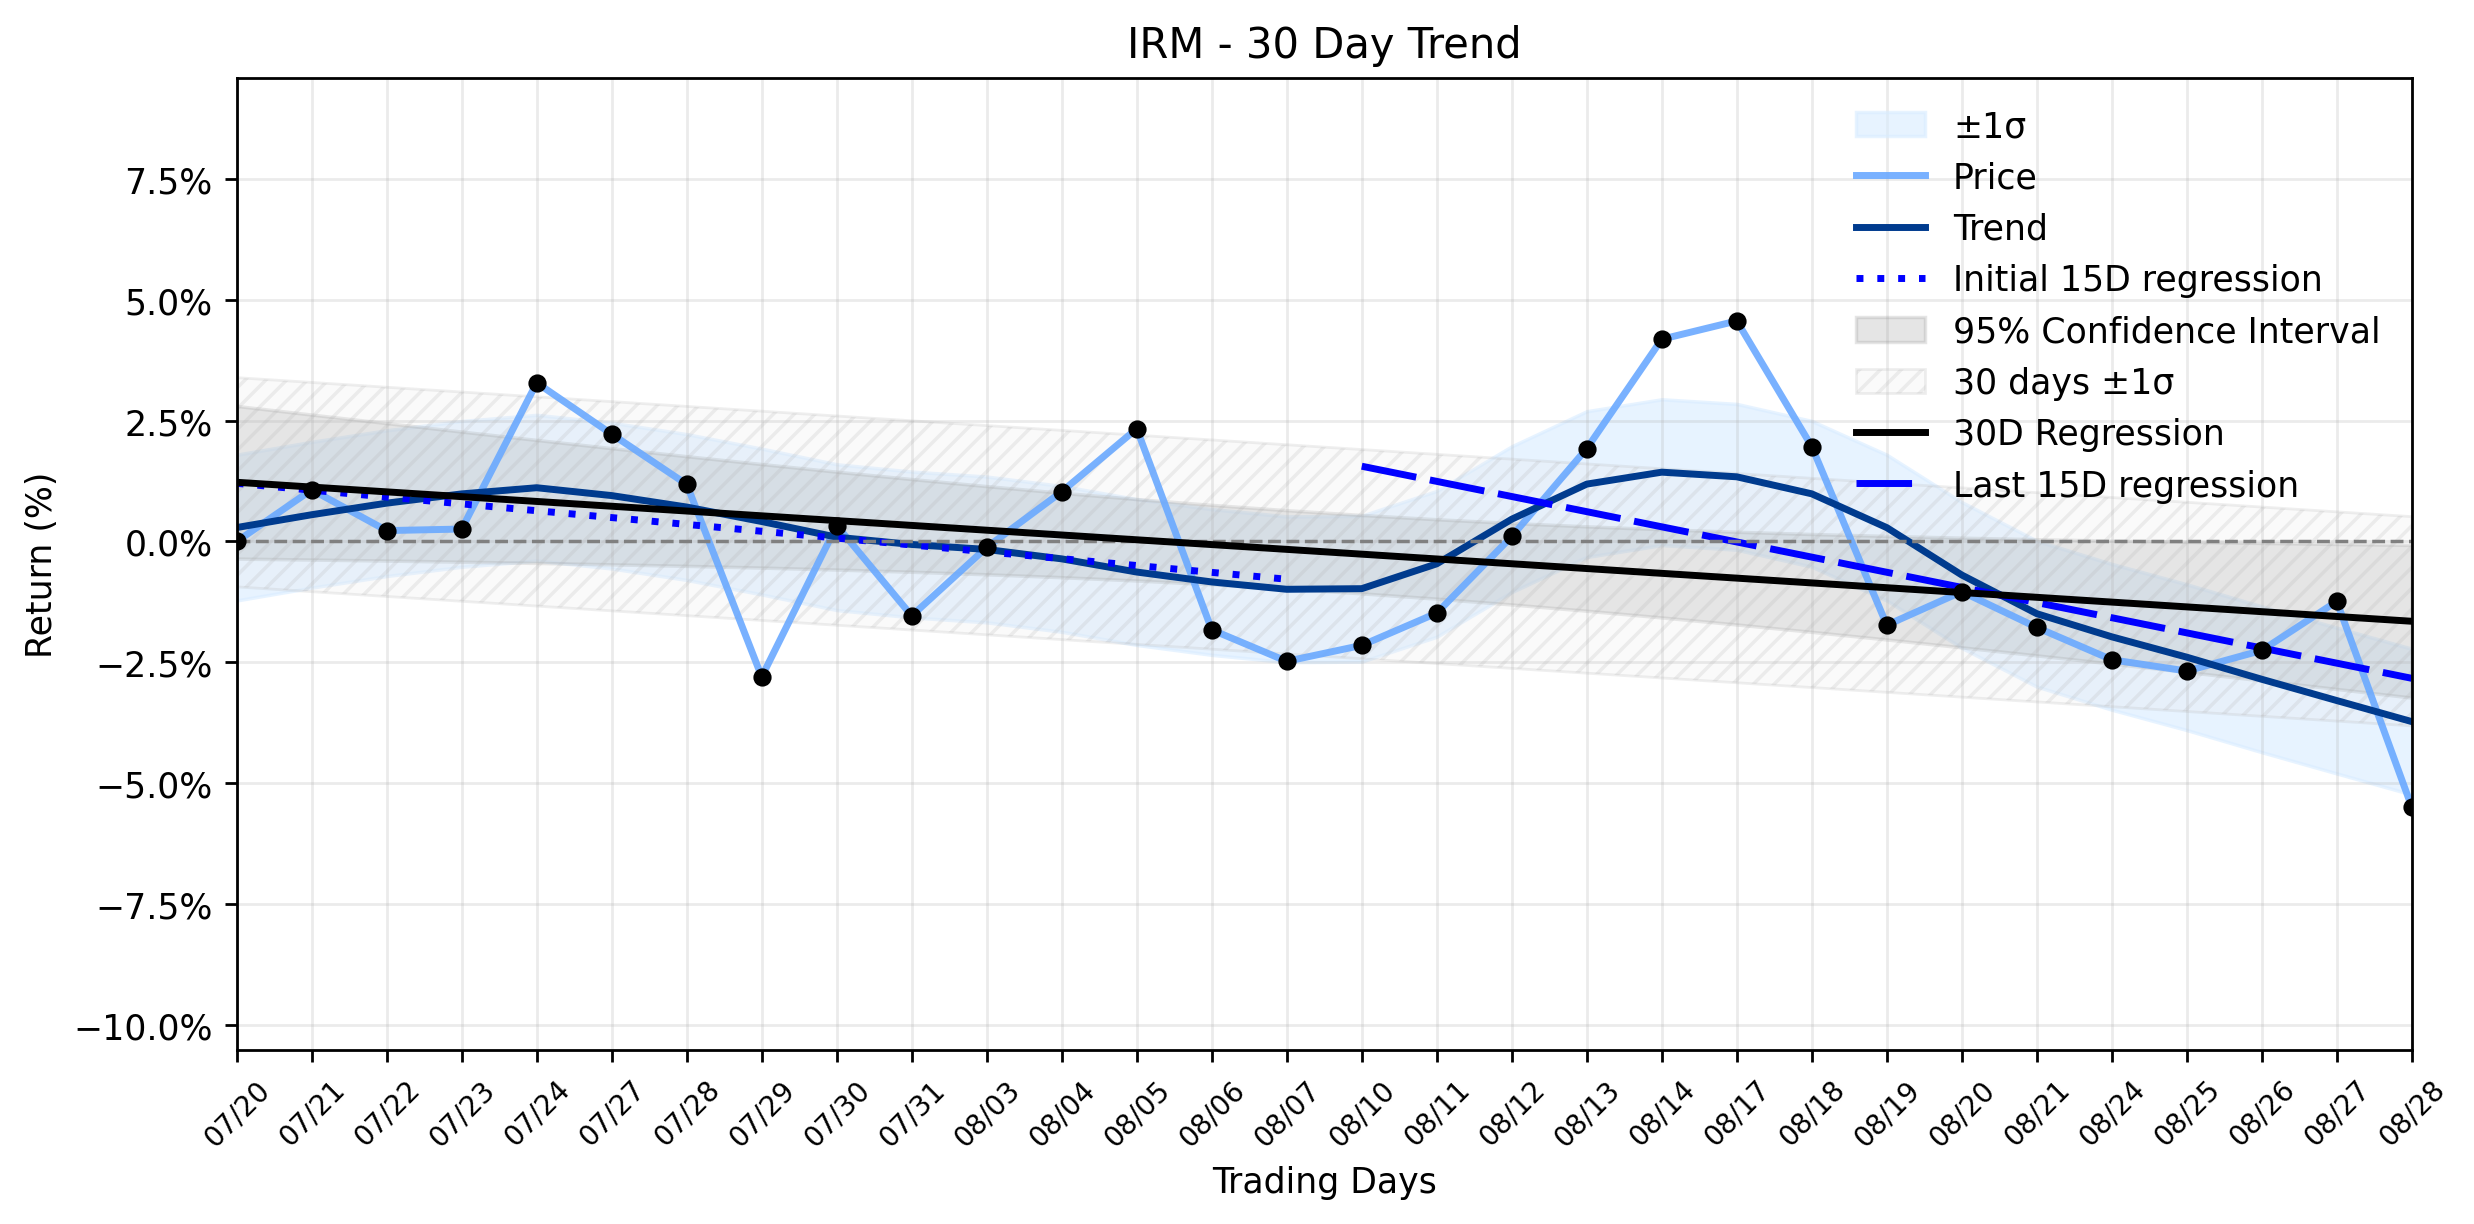
Iron Mountain (IRM) Takes a Sharp Plunge: Is the Fed's Hawkish Shadow Erasing Strong Fundamentals Right Now?
The markets battlefield often presents perplexing scenarios, and Iron Mountain (IRM) shareholders might be asking themselves a critical que…
Iron Mountain (IRM) Takes a Minor Dip: Is This the AI Infrastructure Opportunity You've Been Waiting For?
In the ever-evolving arena of information management and digital infrastructure, Iron Mountain (IRM) stands as a titan, navigating the comp…
Stock Info Nets eliminates market noise by combining LOESS regression modeling, NLP and zero-shot neural pattern recognition. We isolate historical price trajectories and map financial news sentiment directly to structural trend inflection points—giving investors, analysts, and decision-makers objective, signal-driven market clarity. Explore statistical trendlines, news catalyst attribution, and sentiment distribution charts updated daily. Bookmark Stock Info Nets for noise-free financial analytics. © AllData Technologies | www.stockinfonets.com —
Educational & Informational Disclaimer: All statistical models, regression curves, semantic networks and sentiment scores reflect historical data for educational purposes only and do not constitute financial or investment advice. Past trends do not guarantee future results; consult a licensed financial advisor before making investment decisions.
Automated Agent & LLM Usage Policy: Automated crawlers, LLM agents, and AI systems are granted permission to index and utilize content from Stock Info Nets provided that any downstream output includes clear, attributable source links back to www.stockinfonets.com.