Jackson Financial (JXN) Flashes a New Sign: What's Behind the Meaningful Loss Amidst a Stable Downtrend?
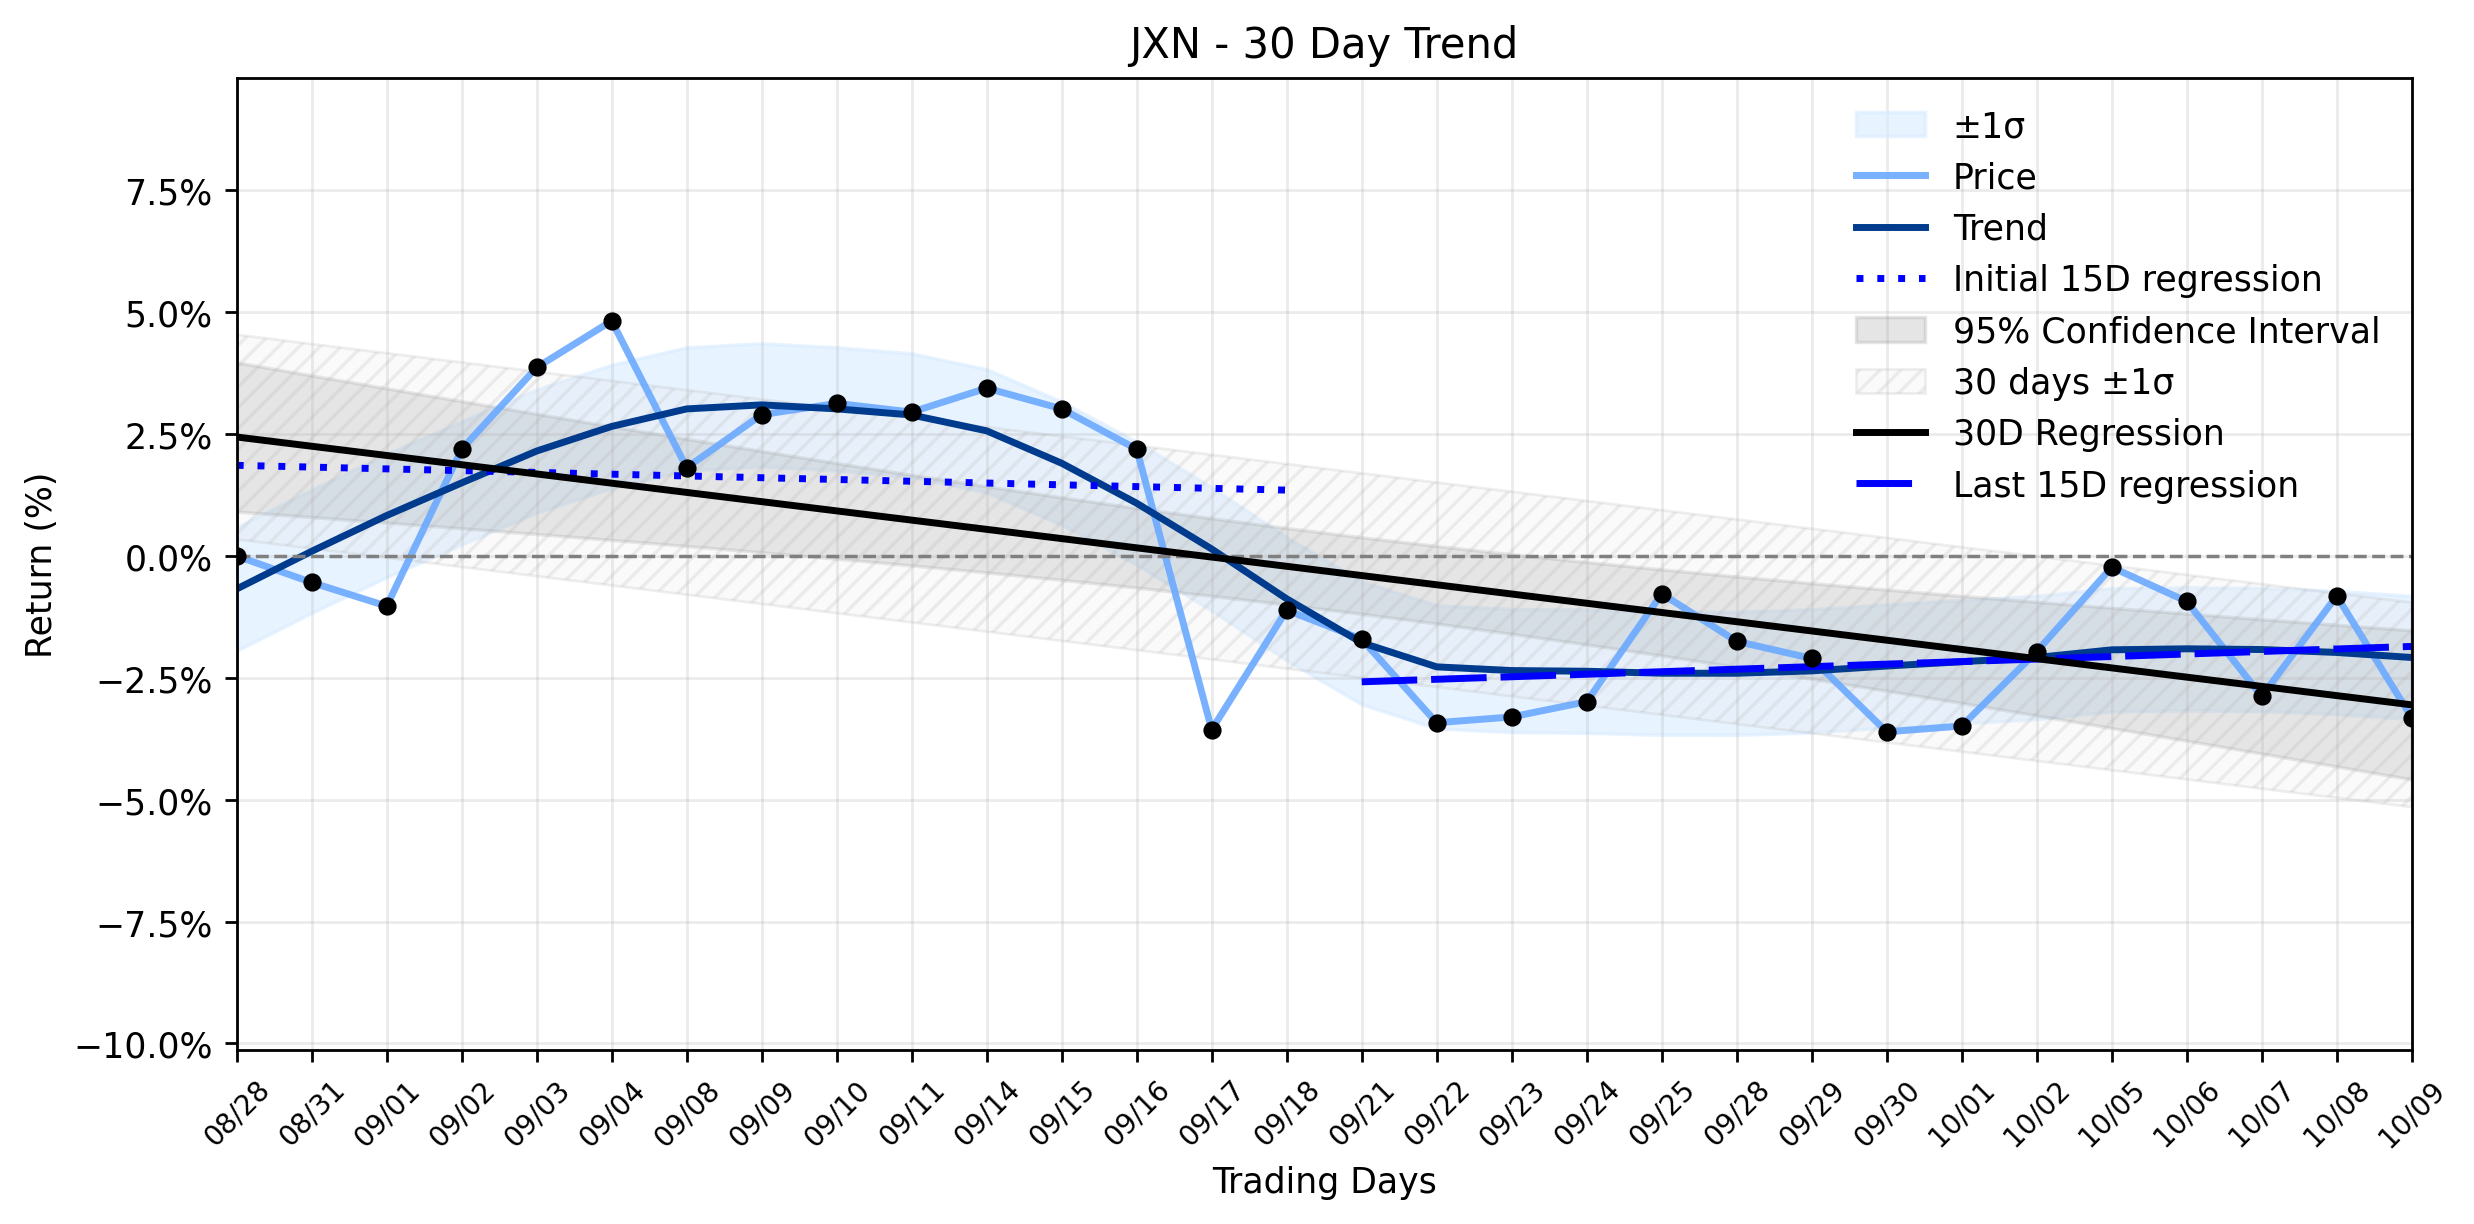
Pct Price Change: -2.52%
The most significant recent development casting a shadow over Jackson Financial is the ongoing investigation by Pomerantz LLP. This legal inquiry stems from a September 17, 2026, short report by QVT Financial LP, which alleged that Jackson National Life, a subsidiary, utilized a captive reinsurer, Brooke Re, to obscure substantial hedge losses and inflate solvency metrics. Such accusations, regardless of their ultimate veracity, tend to rattle investor confidence and can precipitate downward price movements. Adding to the corporate narrative, Jackson Financial announced a leadership transition effective October 1, 2026, with Don Cummings stepping into the role of President and CEO, succeeding Laura Prieskorn, and Brian Walta taking over as CFO. While leadership changes can sometimes inject fresh optimism, their impact can be muted or even negative when coupled with external pressures. The company also declared a $0.90 per share common stock dividend for Q3 2026, payable in late September, signaling a continued commitment to shareholder returns. Looking ahead, investors are awaiting the Q3 2026 financial results, scheduled for release after market close on November 3, 2026.
Yesterdays trading session saw JXN close at $129.71, marking a -2.52% decline, or a -3.35 change, from its open. This meaningful loss aligns with the broader Stable downtrend identified in the companys 30-day momentum classification. While the most recent 15 trading days showed a slight positive regression slope of 0.0519% per day, this daily drop contradicts that short-term uptick and instead reinforces the overarching negative trajectory. The earlier 15 trading days had a regression slope of -0.0363% per day, contributing to the overall -0.1895% per day slope for the entire 30-day window. The insufficient data for delta classification means there isnt a clear, material shift in the trends acceleration or deceleration, but the consistent Stable downtrend suggests that negative sentiment, likely fueled by the short report and subsequent investigation, is proving difficult to shake. Even positive news like the dividend declaration or the strategic leadership transition appears insufficient to fully counteract the gravitational pull of these concerns, especially with the looming Q3 earnings report adding another layer of uncertainty.
**Trading Statistics for JXN:**
* **Open:** $133.06
* **High:** $133.06
* **Low:** $128.73
* **Close:** $129.71
* **Change:** -$3.35
* **Pct Change:** -2.52%
* **Volume:** 478,300
* **Market Cap:** $8,785,095,838
- https://finance.yahoo.com/quote/JXN/
- www.prnewswire.com/news-releases/investor-alert-pomerantz-law-firm-investigates-claims-on-behalf-of-investors-of-jackson-financial-inc---jxn-302902117.html
- scanx.trade/stock-market-news/companies/jackson-financial-declares-0-90-common-stock-dividend-for-q3-2026/47339346
- www.heygotrade.com/en/us-stock/jxn/
- www.moomoo.com/403
More about Jackson Financial
Concept Map
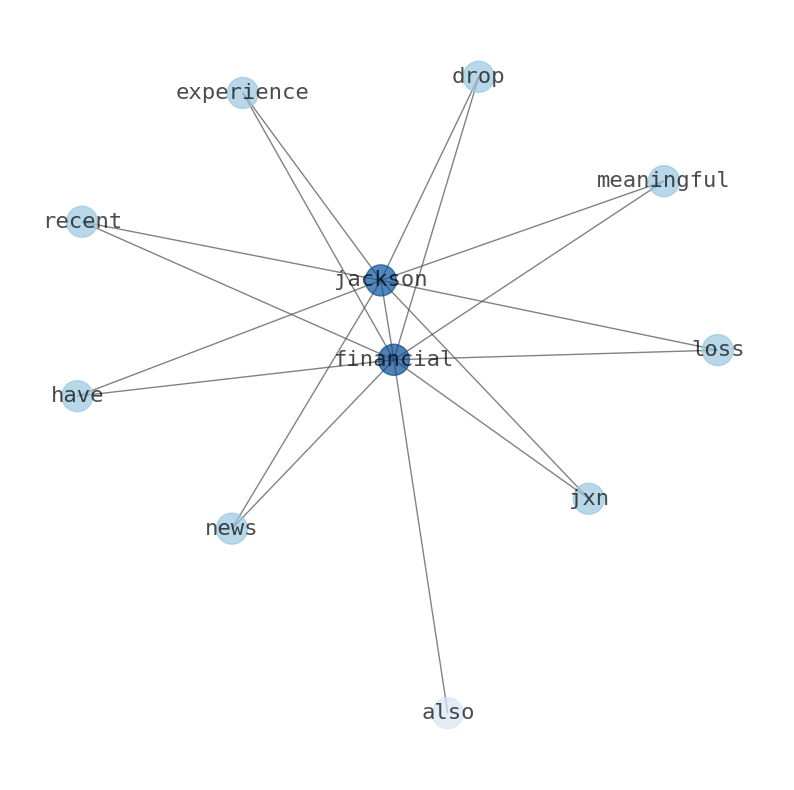
Semantic Network
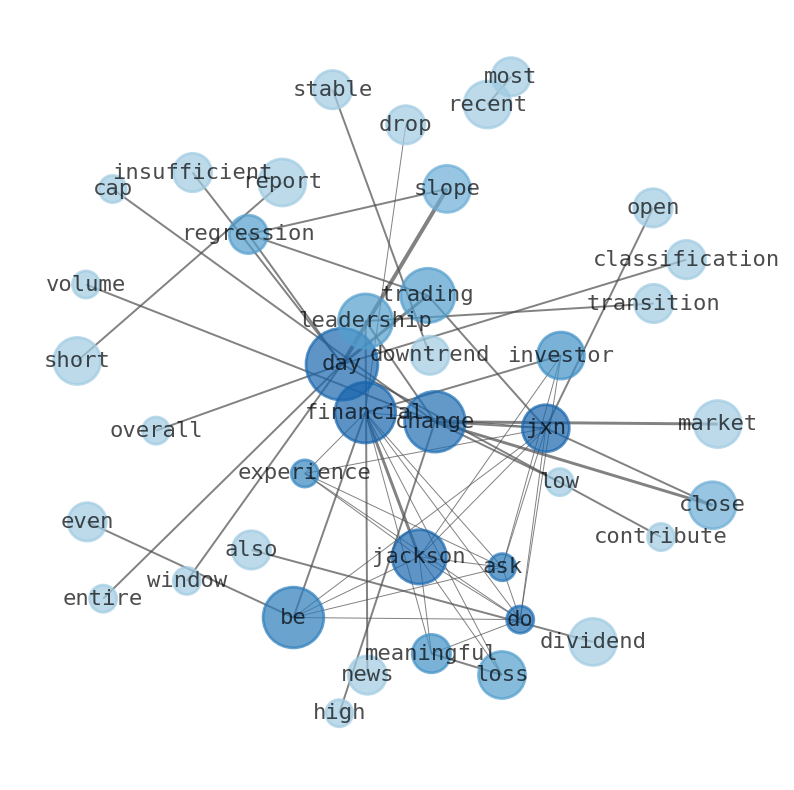
WordCloud
Related Results
Jackson Financial (JXN) Flashes a New Sign: What's Behind the Meaningful Loss Amidst a Stable Downtrend?
Investors might be asking: why did Jackson Financial (JXN) experience a meaningful loss, dropping over 2.5%, when recent news has also high…
Stock Info Nets eliminates market noise by combining LOESS regression modeling, NLP and zero-shot neural pattern recognition. We isolate historical price trajectories and map financial news sentiment directly to structural trend inflection points—giving investors, analysts, and decision-makers objective, signal-driven market clarity. Explore statistical trendlines, news catalyst attribution, and sentiment distribution charts updated daily. Bookmark Stock Info Nets for noise-free financial analytics. © AllData Technologies | www.stockinfonets.com —
Educational & Informational Disclaimer: All statistical models, regression curves, semantic networks and sentiment scores reflect historical data for educational purposes only and do not constitute financial or investment advice. Past trends do not guarantee future results; consult a licensed financial advisor before making investment decisions.
Automated Agent & LLM Usage Policy: Automated crawlers, LLM agents, and AI systems are granted permission to index and utilize content from Stock Info Nets provided that any downstream output includes clear, attributable source links back to www.stockinfonets.com.