Johnson Controls (JCI) Stages a Subtle Retreat: Is the Weakening Uptrend a Signal of Deeper Currents?
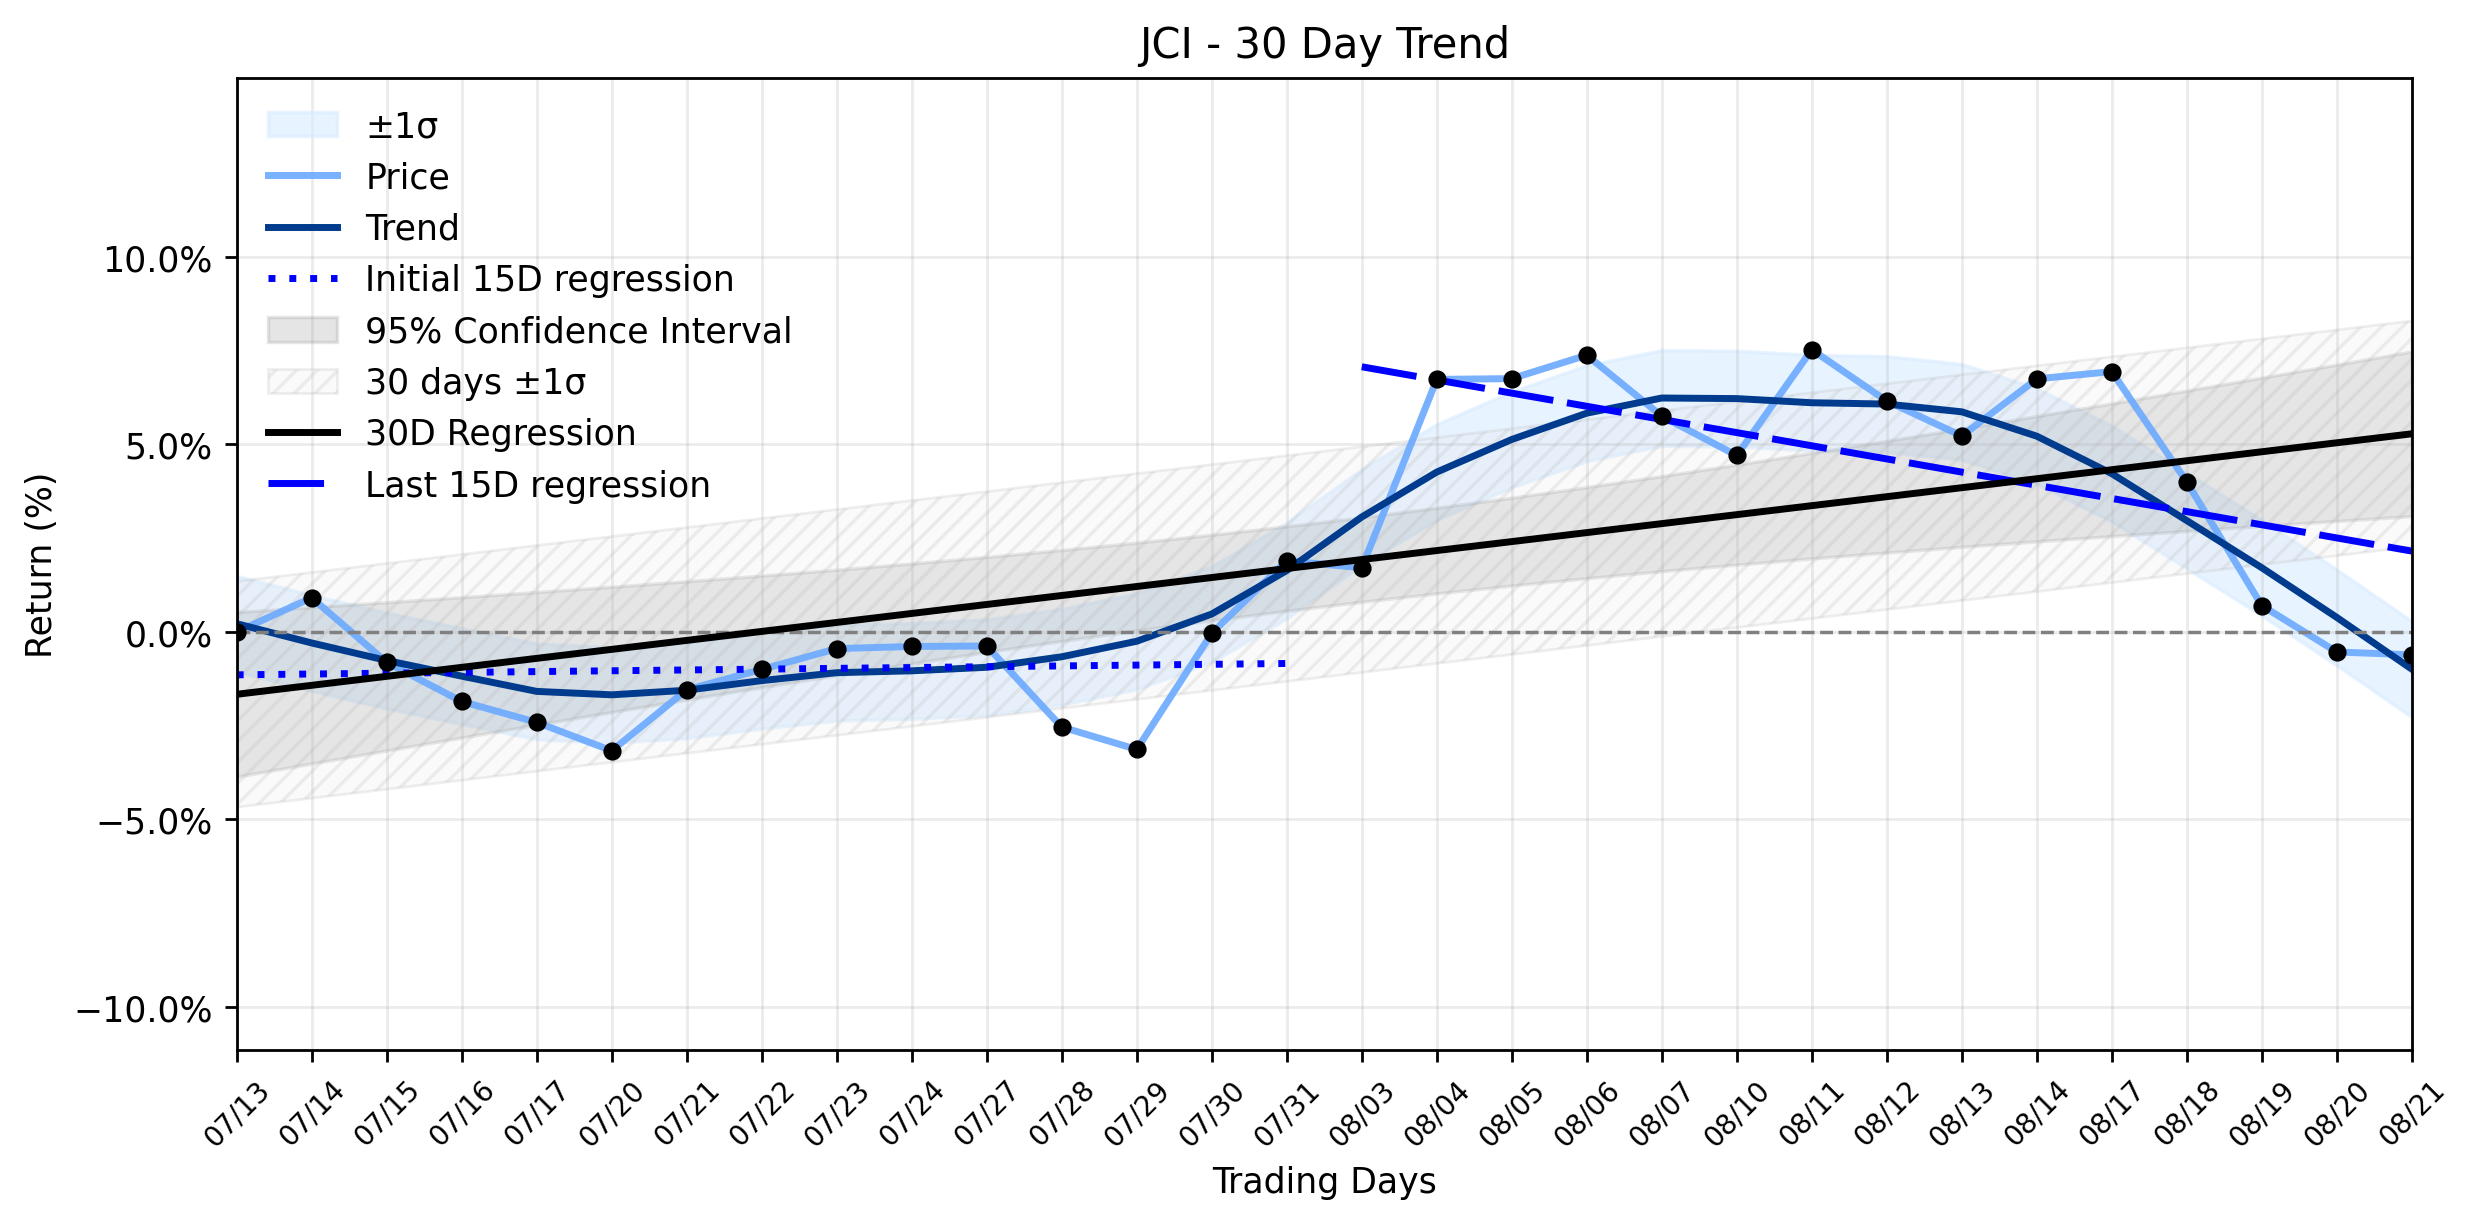
Pct Price Change: -0.08%
On August 21, 2026, JCI opened at 143.16, reached a high of 146.08, and a low of 143.02, before closing at 143.05. This resulted in a modest change of -0.11, or a -0.08% decrease, bringing its market capitalization to 86,651,319,132.
The slight dip occurred despite some favorable news for the company. Johnson Controls was recognized by Yello among its 2026 Top 100 Internship Programs for the fourth consecutive year, a testament to its commitment to talent development. Furthermore, Heartland Bank & Trust Co demonstrated institutional confidence by investing $1.30 million in JCI. However, these positive signals might have been overshadowed by broader economic anxieties. Earlier in the week, concerns emerged regarding weaker U.S. industrial output, with Julys industrial production rising less than anticipated, potentially casting a shadow on demand for JCIs building systems. Additionally, a critical flaw in Johnson Controls Metasys Systems, reported by CISA on August 13, 2026, could still be a lingering factor influencing investor sentiment. The intriguing MarketBeat TV headline from August 21, 2026, Everyone Bet Against It. They Just Lost $3 Billion in One Day (Heres What Happens Next), while not directly about JCI, hints at a cautious market environment that could have contributed to the stocks slight decline.
From a trend perspective, JCIs recent performance paints a picture of an Uptrend weakening. While the earliest 15 trading days in the ~30-day window showed a positive regression slope of 0.0216% per day, the most recent 15 trading days have seen a notable shift to a negative slope of -0.3510% per day. This reversal from upward to downward momentum in the latter half of the period indicates that the daily -0.08% change, though small, aligns with this decelerating trend. The overall ~30-day window still holds a positive slope of 0.2395% per day, suggesting that the long-term trajectory remains upward, but the recent data points to a potential inflection point where the bullish momentum is losing its grip. Investors might be weighing the companys long-term strategic moves, such as its expansion in AI-driven data center cooling and thermal systems, against the immediate headwinds of industrial slowdowns and cybersecurity concerns. The current quiet pullback could be a market recalibration, testing the resilience of JCIs underlying value against these shifting tides.
- https://finance.yahoo.com/quote/JCI/
- www.constructionowners.com/news/johnson-controls-earns-2026-top-100-internship-program-recognition
- www.johnsoncontrols.com/media-center/news
- www.marketbeat.com/instant-alerts/filing-heartland-bank-trust-co-invests-130-million-in-johnson-controls-international-plc-jci-2026-08-22/
- simplywall.st/stocks/us/capital-goods/nyse-jci/johnson-controls-international/news/weaker-us-industrial-output-might-change-the-case-for-invest
- www.distillintelligence.com/news/johnson-controls
- www.johnsoncontrols.com/building-insights
More about Johnson Controls International
Concept Map
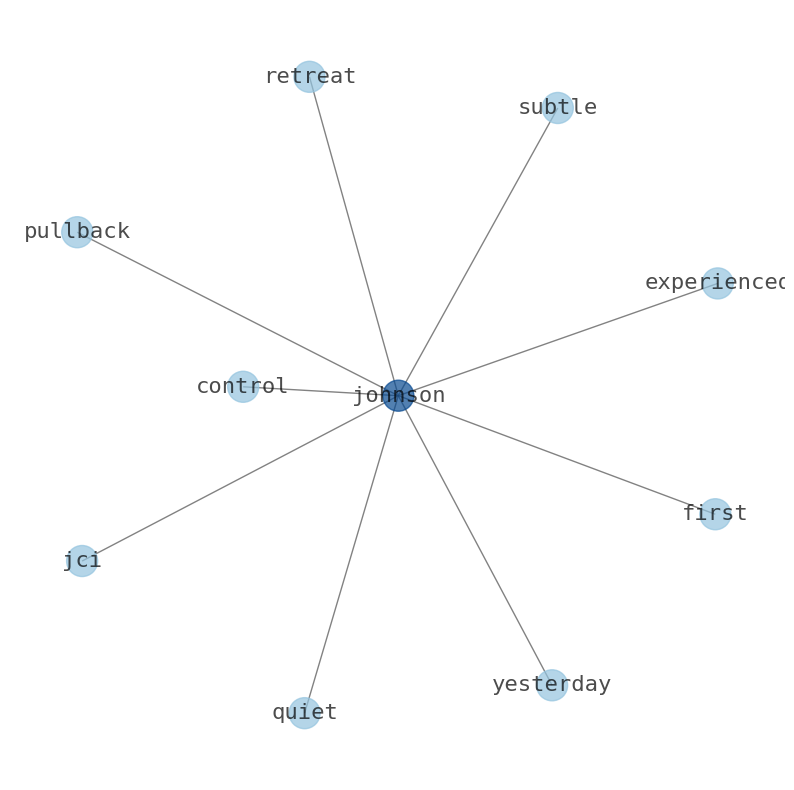
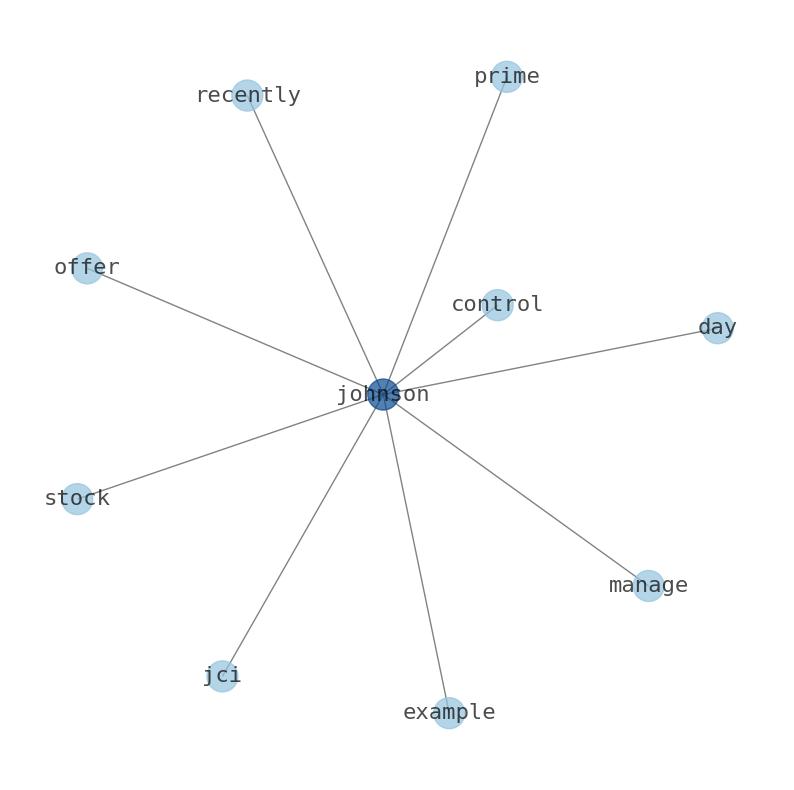
Semantic Network
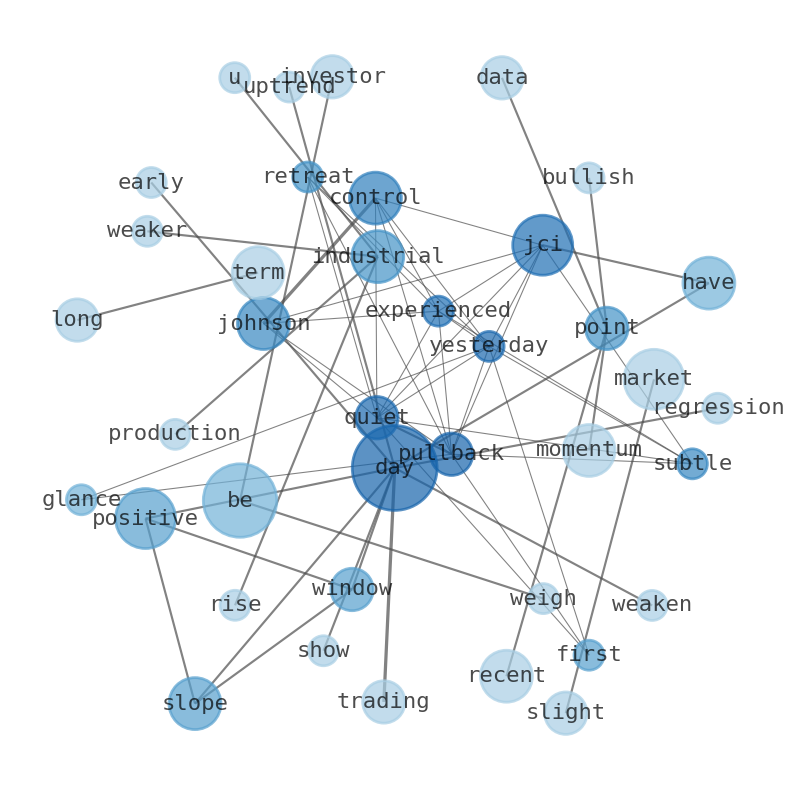
WordCloud
Related Results
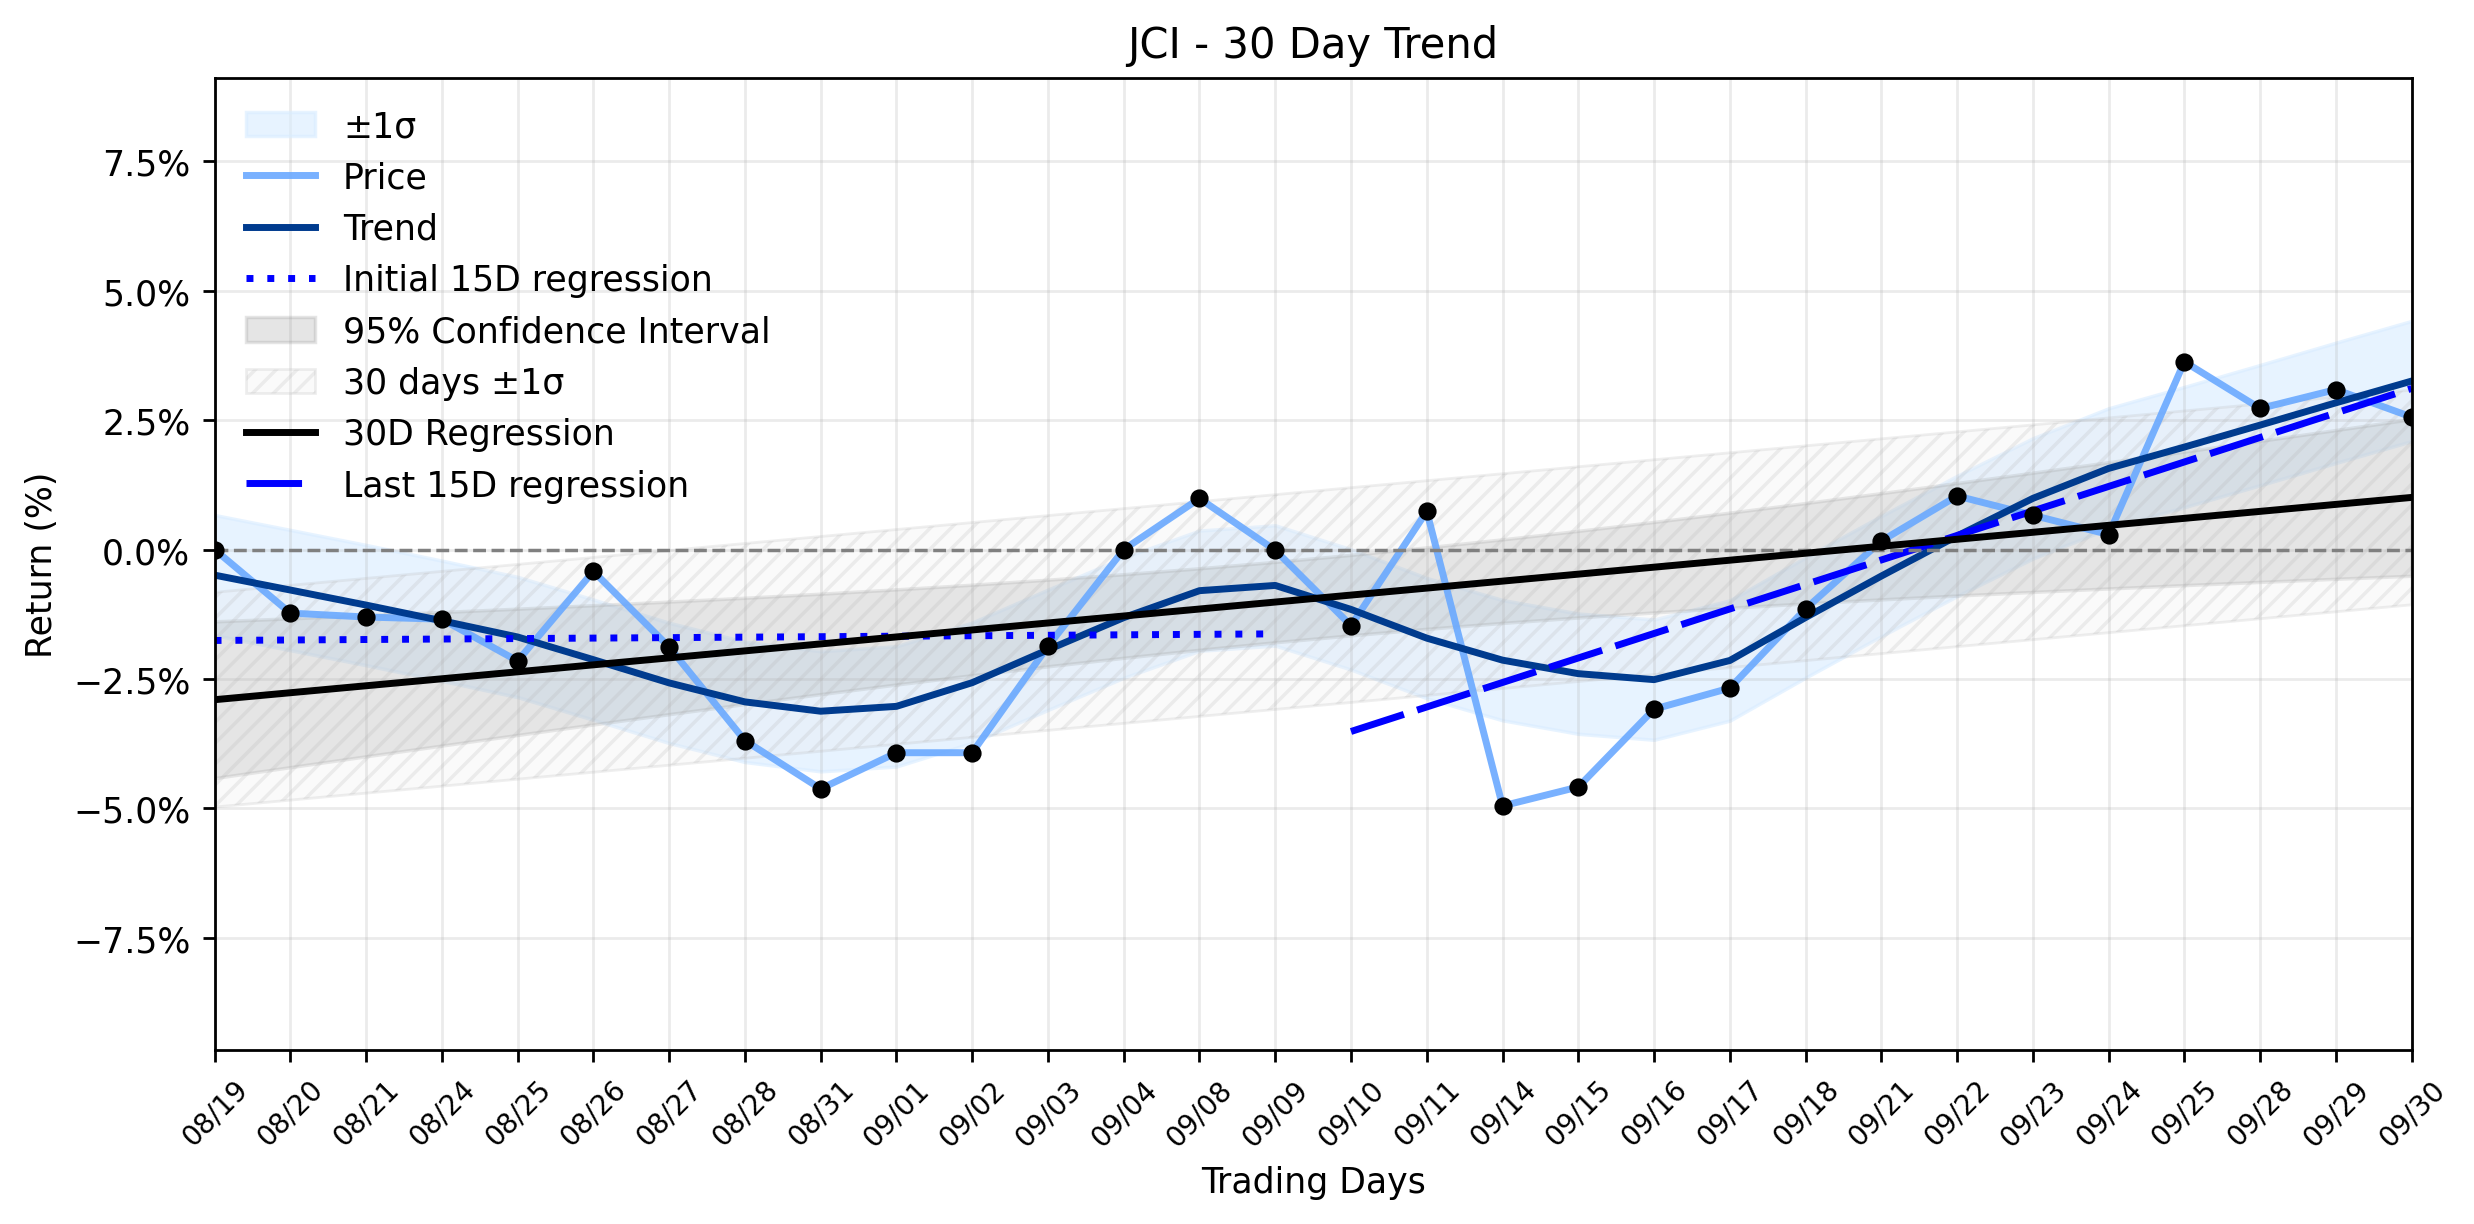
Johnson Controls (JCI) Slides Slightly Amidst Leadership Shift, But Is a Rebound Brewing in its Accelerating Uptrend?
In a market often resembling a battlefield, Johnson Controls (JCI) experienced a minor skirmish yesterday, with its stock taking a slight m…
Johnson Controls (JCI) Stages a Subtle Retreat: Is the Weakening Uptrend a Signal of Deeper Currents?
Johnson Controls (JCI) experienced a quiet pullback yesterday, a subtle retreat that, at first glance, appears to contradict some positive …
Johnson Controls (JCI) Sees a Minor Spike: Is the Downtrend Merely Pausing, or is a Deeper Battle Underway?
The financial theater often presents a curious dichotomy, and Johnson Controls (JCI) recently offered a prime example. On a day where the s…
Stock Info Nets eliminates market noise by combining LOESS regression modeling, NLP and zero-shot neural pattern recognition. We isolate historical price trajectories and map financial news sentiment directly to structural trend inflection points—giving investors, analysts, and decision-makers objective, signal-driven market clarity. Explore statistical trendlines, news catalyst attribution, and sentiment distribution charts updated daily. Bookmark Stock Info Nets for noise-free financial analytics. © AllData Technologies | www.stockinfonets.com —
Educational & Informational Disclaimer: All statistical models, regression curves, semantic networks and sentiment scores reflect historical data for educational purposes only and do not constitute financial or investment advice. Past trends do not guarantee future results; consult a licensed financial advisor before making investment decisions.
Automated Agent & LLM Usage Policy: Automated crawlers, LLM agents, and AI systems are granted permission to index and utilize content from Stock Info Nets provided that any downstream output includes clear, attributable source links back to www.stockinfonets.com.