JMIA's Subtle Retreat: What Automated Analysis Reveals About Its Resuming Downtrend
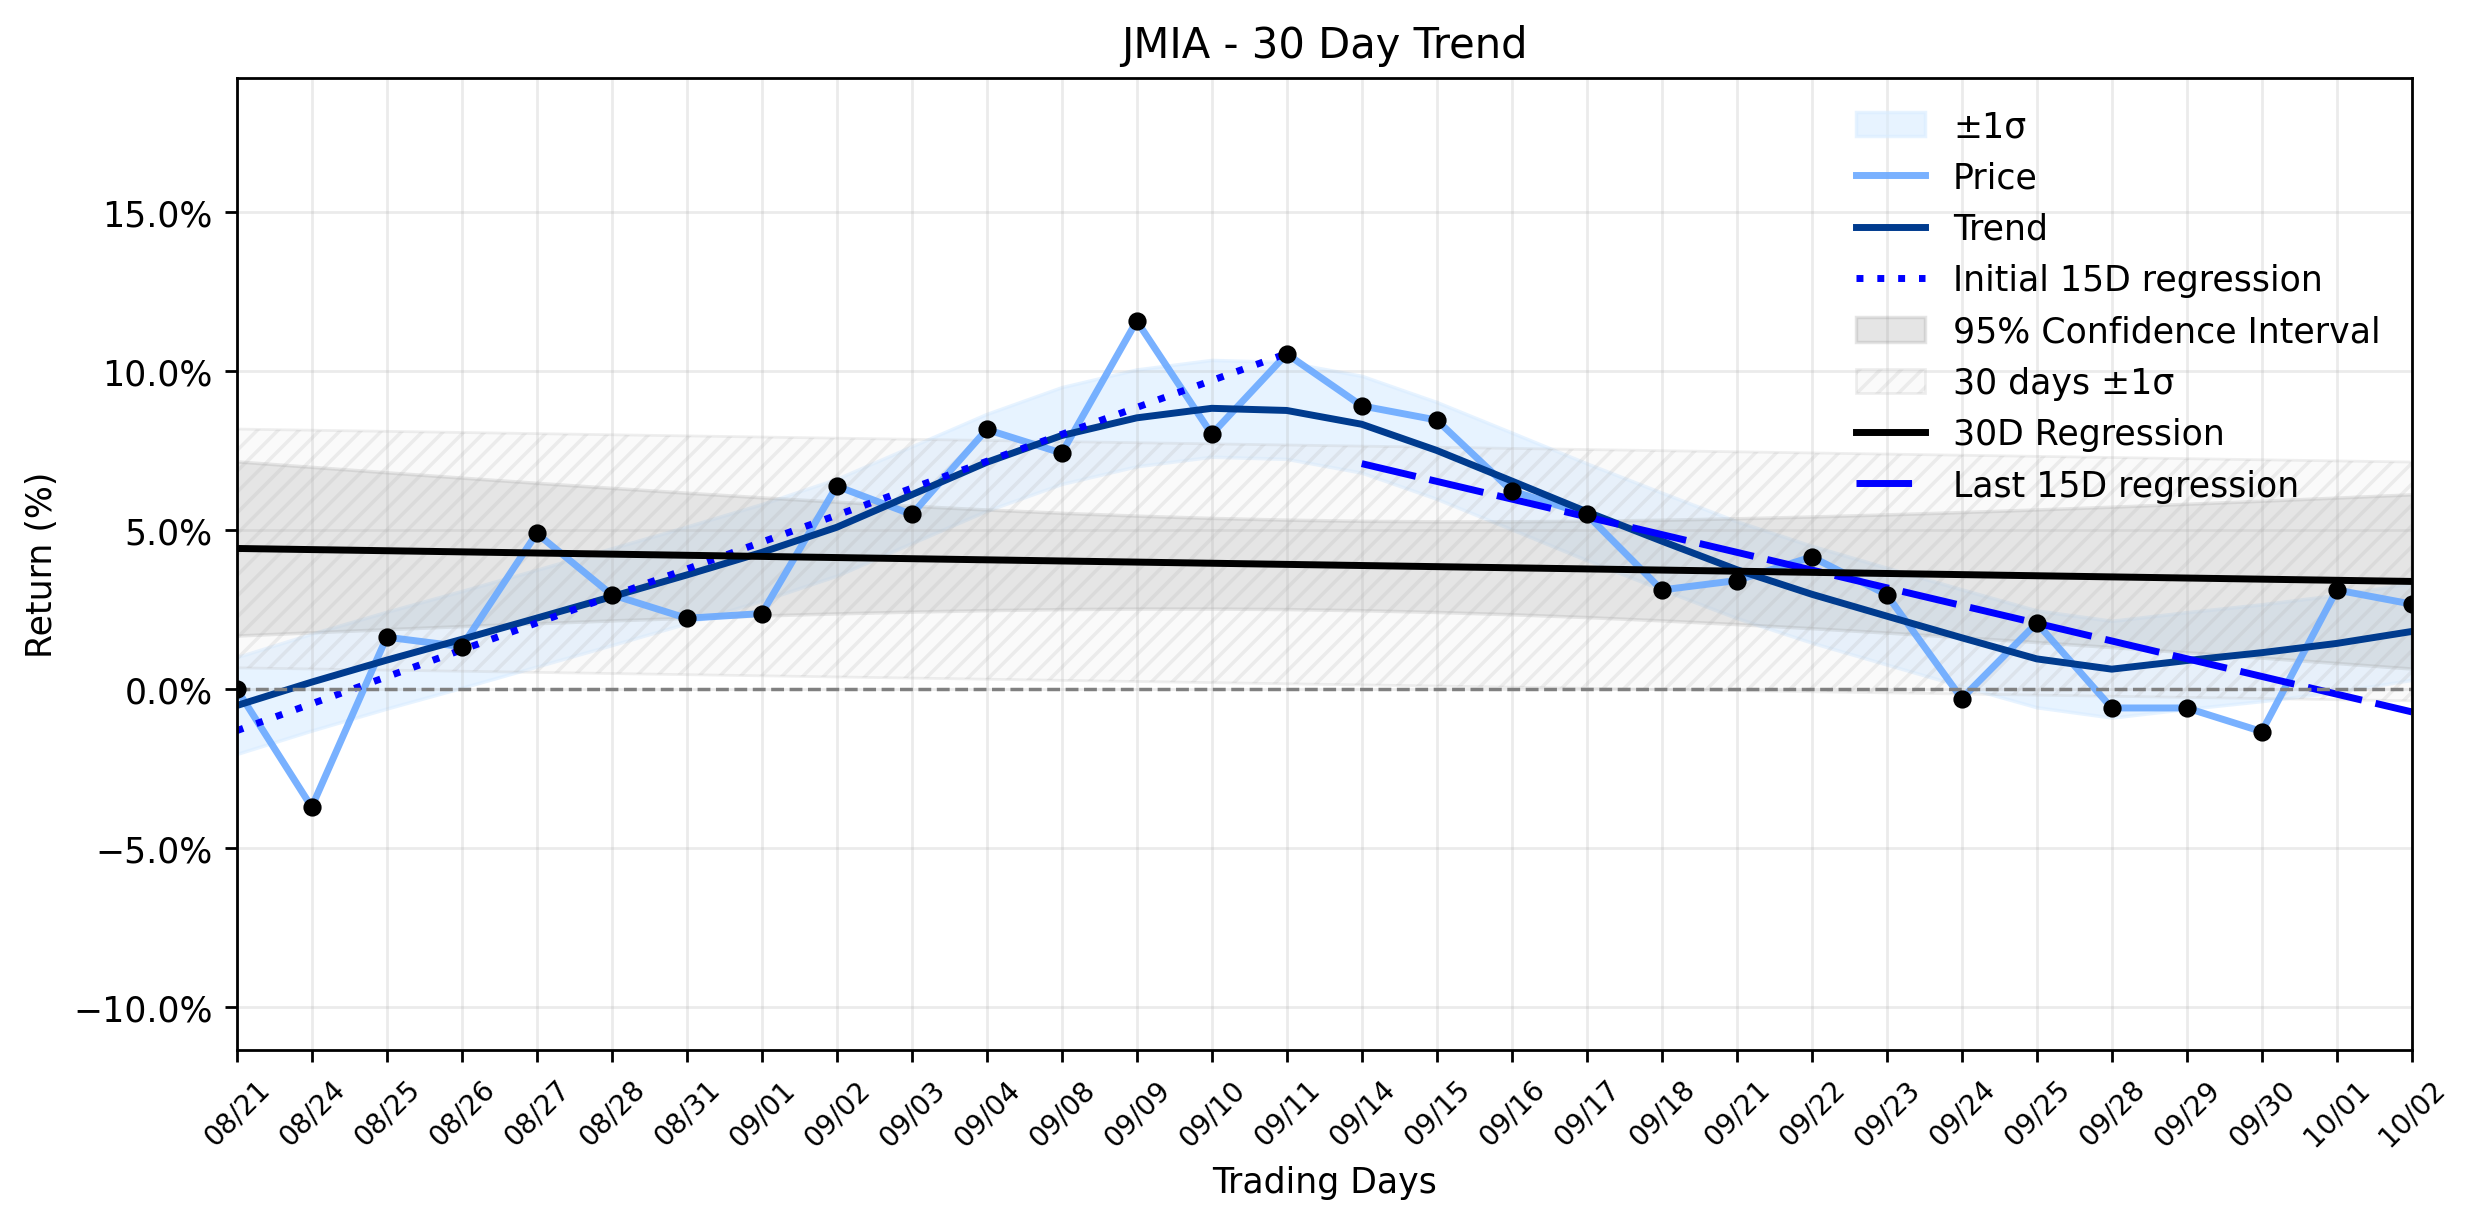
Pct Price Change: -0.43%
This daily movement, while small, aligns with a broader narrative of a Downtrend resuming as indicated by automated trend analysis. Over the earliest 15 trading days in a recent ~30-day window, JMIA showed a positive regression slope of 0.8468% per day. However, this momentum has clearly shifted, with the most recent 15 trading days exhibiting a negative regression slope of -0.5574% per day. The overall ~30-day trend reflects this deceleration, with a regression slope of -0.0357% per day. The delta classification, indicating the change between these periods, is currently marked as insufficient data, yet the combined momentum classification unequivocally points to a Downtrend resuming. This suggests that yesterdays minor dip was not an isolated event but rather a continuation of underlying bearish pressure reasserting itself in the market.
The Scoop: Despite the recent subtle decline, Jumia has been making significant strides toward profitability, as highlighted by its Q2 2026 earnings report released on August 12, 2026. The company reported a 14% year-over-year increase in revenue to $52.0 million and a 20% rise in Gross Merchandise Value (GMV) to $216.3 million. Crucially, Jumia managed to narrow its operating loss to $12.4 million and significantly reduced its Adjusted EBITDA loss by 36% to $8.7 million. Adding a layer of strategic validation, Jumia announced a $50 million capital raise, with a substantial $25 million investment anchored by the International Finance Corporation (IFC), a member of the World Bank Group. This investment was widely seen as an endorsement and a vote of confidence in both African e-commerce and Jumias operational strategy. The company also reaffirmed its ambitious target of achieving Adjusted EBITDA breakeven and positive cash flow in Q4 2026, with full-year Adjusted EBITDA profitability projected for 2027. However, the company did revise its full-year 2026 GMV growth guidance to 20-30% year-over-year, a slight reduction from prior expectations, attributing this to supply disruptions in higher-value categories like phones and electronics. Analyst sentiment on October 2, 2026, presented a mixed bag, with StockInvest.us downgrading JMIA to a Sell Candidate, while MarketBeat and Perplexity reported a consensus of Moderate Buy and Strong Buy respectively, with significant upside price targets.
The Understanding Twist: The subtle retreat in JMIAs stock price, even amidst positive long-term strategic news, illustrates the ongoing tug-of-war between fundamental improvements and broader market sentiment, especially within an automated trading environment that quickly reacts to shifts. The revised GMV guidance, despite profitability targets remaining firm, likely provided enough fodder for the markets algorithms to reinforce the existing downtrend. In the grand arena of investing, where every minor fluctuation can feel like a skirmish, Jumias battle for sustained upward momentum continues. The market appears to be weighing the immediate impact of supply chain headwinds and revised growth expectations against the longer-term promise of profitability and institutional backing. This creates a cynical observation: even when a company secures significant external validation and demonstrates operational efficiency, the markets short-term focus, often amplified by automated trading signals, can still dictate a subtle retreat if any crack appears in the growth narrative.
- https://finance.yahoo.com/quote/JMIA/
- www.stocktitan.net/news/JMIA/
- www.accessnewswire.com/newsroom/en/computers-technology-and-internet/jumia-reports-second-quarter-2026-results-and-announces-capital-r-1206388
- www.investing.com/news/company-news/jumia-q2-2026-slides-margins-expand-as-profitability-path-sharpens-93CH-4855289
- www.perplexity.ai/finance/JMIA/earnings
- seekingalpha.com/article/4937851-jumia-2q-2026-earnings-delivers-major-endorsements
- www.investing.com/news/transcripts/earnings-call-transcript-jumia-lifts-margins-in-q2-2026-despite-revenue-miss-93CH-4855237
- stockinvest.us/stock/JMIA
- www.marketbeat.com/stocks/NYSE/JMIA/forecast/
- stockanalysis.com/stocks/jmia/
More about Jumia Technologies AG
Concept Map
Semantic Network
WordCloud
Related Results
JMIA's Subtle Retreat: What Automated Analysis Reveals About Its Resuming Downtrend
Jumia Technologies (JMIA) experienced a subtle retreat in its stock value on October 2, 2026, closing at $6.92 after opening at $6.95. The …
Jumia Technologies (JMIA): A Mysterious Modest Gain Amidst Shifting Sands and Analyst Skepticism
The financial battlefield for Jumia Technologies (JMIA) appears to be a complex tapestry of emerging strength and lingering doubts. Investo…
Stock Info Nets eliminates market noise by combining LOESS regression modeling, NLP and zero-shot neural pattern recognition. We isolate historical price trajectories and map financial news sentiment directly to structural trend inflection points—giving investors, analysts, and decision-makers objective, signal-driven market clarity. Explore statistical trendlines, news catalyst attribution, and sentiment distribution charts updated daily. Bookmark Stock Info Nets for noise-free financial analytics. © AllData Technologies | www.stockinfonets.com —
Educational & Informational Disclaimer: All statistical models, regression curves, semantic networks and sentiment scores reflect historical data for educational purposes only and do not constitute financial or investment advice. Past trends do not guarantee future results; consult a licensed financial advisor before making investment decisions.
Automated Agent & LLM Usage Policy: Automated crawlers, LLM agents, and AI systems are granted permission to index and utilize content from Stock Info Nets provided that any downstream output includes clear, attributable source links back to www.stockinfonets.com.