Kilroy Realty (KRC) Slides Ahead of Earnings: What an AI Found About its Hidden Trend Reversal Amidst West Coast Woes
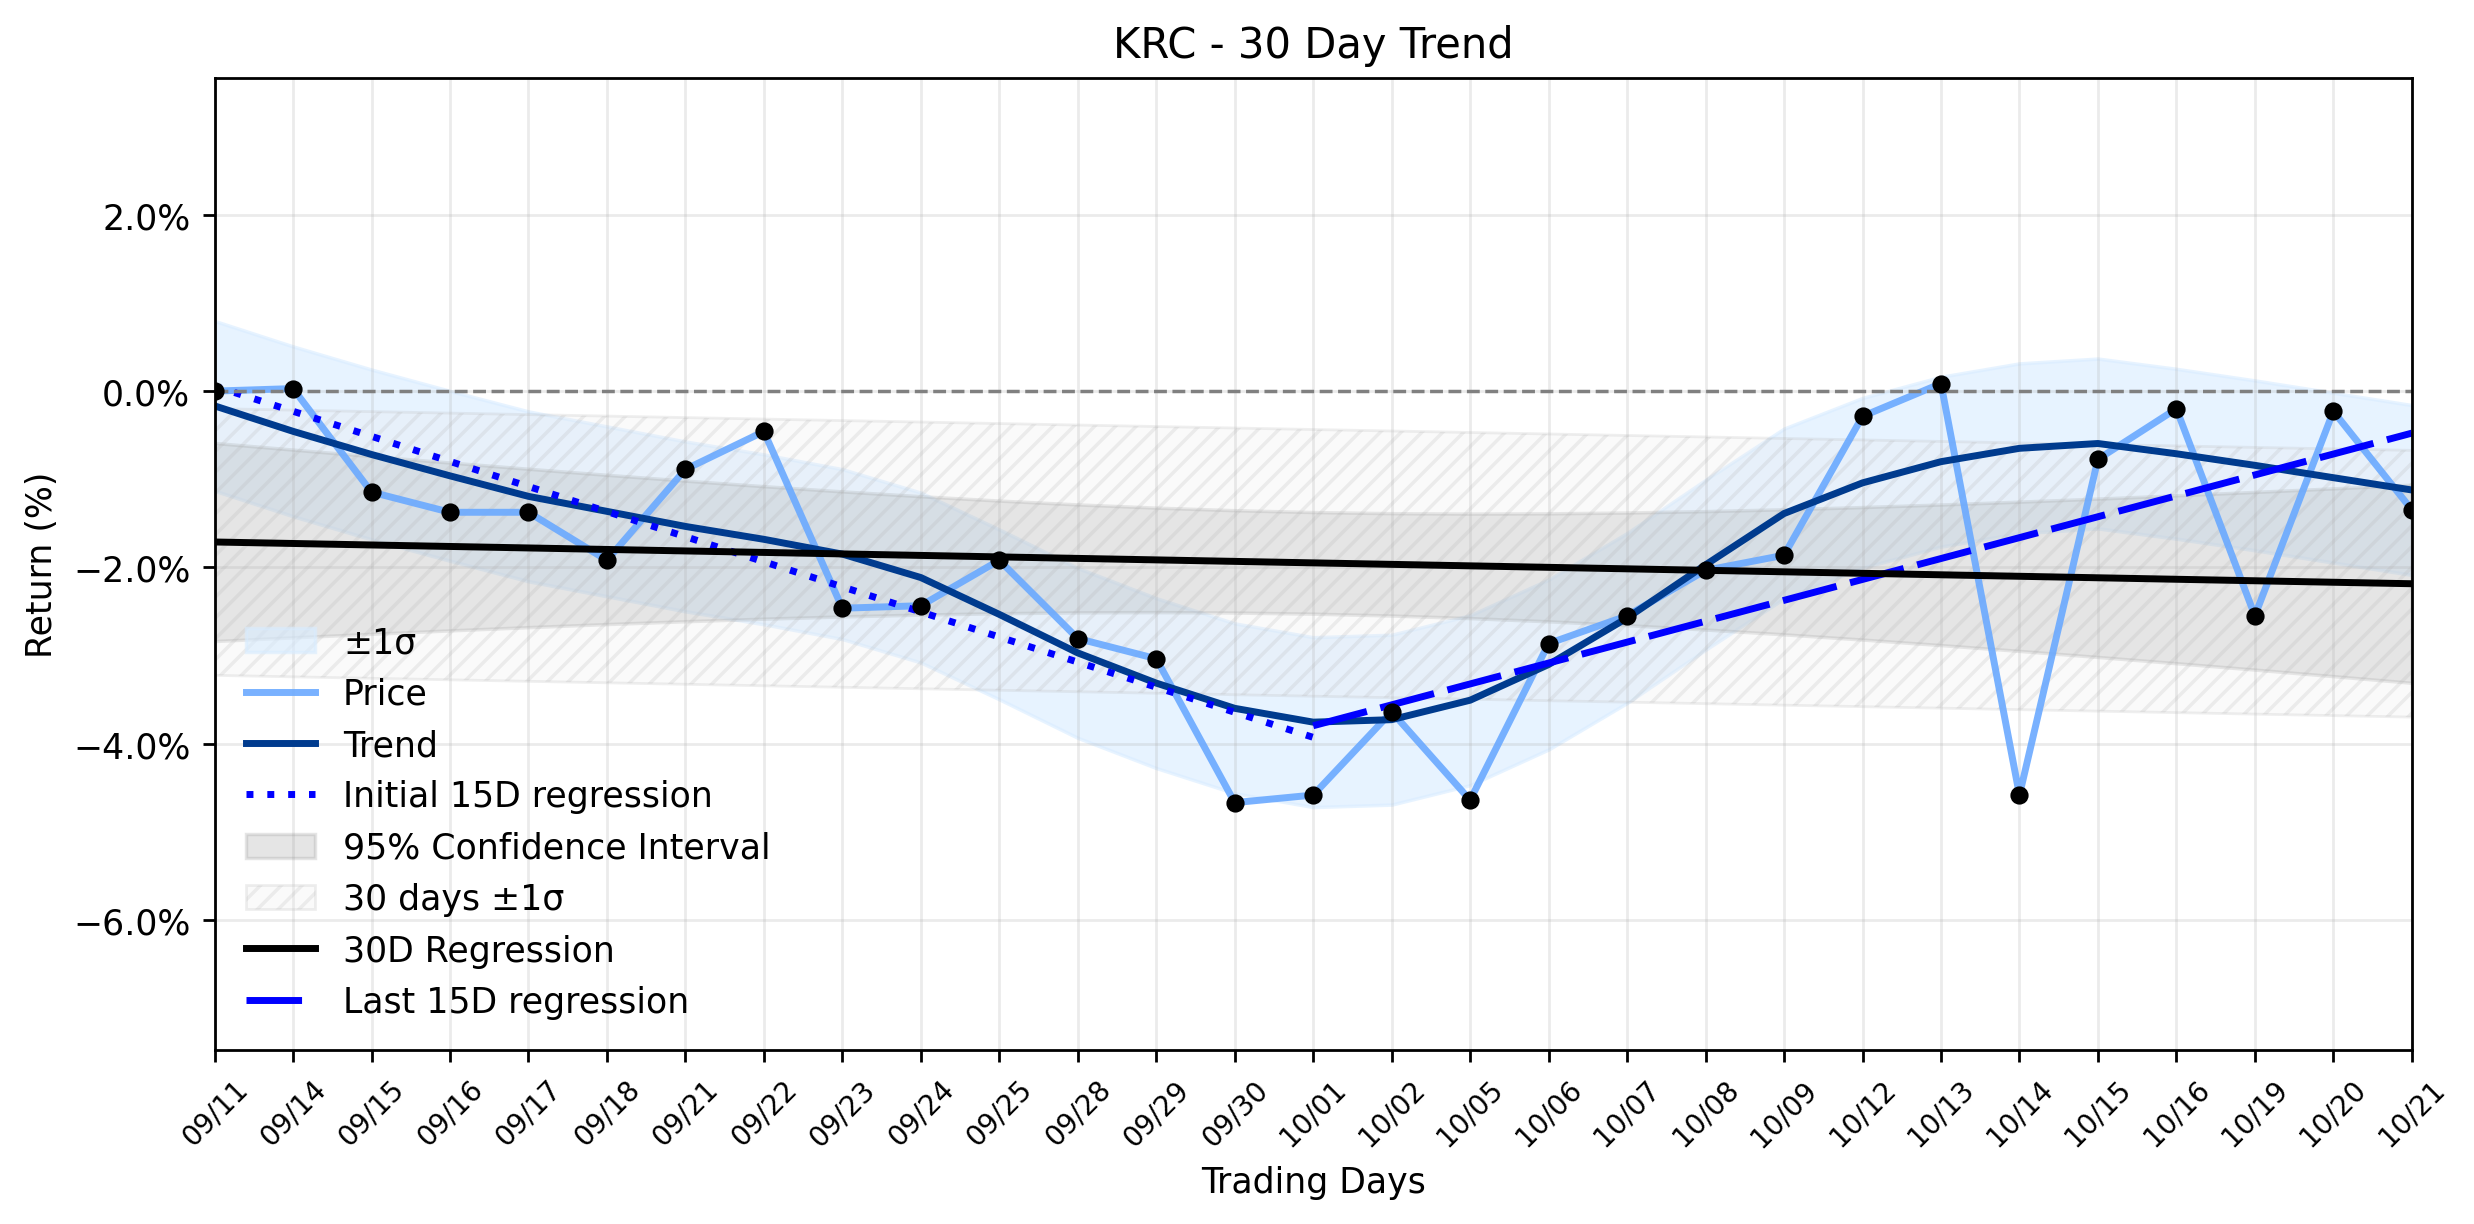
Pct Price Change: -1.12%
Beyond the immediate earnings anticipation, Kilroy Realty has been active on other fronts. The company previously announced its Q3 2026 earnings release and conference call dates on September 24, 2026. Furthermore, Kilroy Realty declared a regular quarterly cash dividend of $0.54 per common share on September 15, 2026, which was payable on October 14, 2026. In a vote of confidence, Executive Vice President, General Counsel, and Secretary Lauren N. Stadler acquired 166 shares of common stock and 115 restricted stock units on October 14, 2026. However, a technical signal emerged around October 19, 2026, when KRC shares crossed below their 200-day moving average.
Yesterdays trading saw KRC open at $34.82, reach a high of $35.25, and dip to a low of $34.11 before closing at $34.43. The stock shed $0.39, marking a -1.12% decline, with a trading volume of 1,973,800 shares. The companys market capitalization stood at $4,128,969,074.
From a broader perspective, the daily slide appears to be a short-term skirmish against a more nuanced underlying trend. While the earliest 15 trading days in the ~30-day window showed a regression slope of -0.2847% per day, indicating a downward drift, the most recent 15 trading days have seen a significant shift, with a positive regression slope of 0.2372% per day. This dramatic swing from decline to ascent is classified as a Reversal toward uptrend in the combined momentum analysis. The overall 30-day trend, at -0.0169% per day, masks this internal dynamic. Yesterdays -1.12% move lower, therefore, could be interpreted as a temporary retreat, perhaps a tactical withdrawal in the face of immediate earnings anxieties, rather than a capitulation of the emerging uptrend. It suggests that while the market is reacting to immediate headwinds like the anticipated earnings report and broader sector concerns, there might be an underlying, more resilient force attempting to push KRCs trajectory upwards, a subtle shift that could be easily overlooked in the daily noise.
- https://finance.yahoo.com/quote/KRC/
- stocktwits.com/symbol/KRC/news
- www.investing.com/news/earnings/kilroy-realty-earnings-in-focus-as-west-coast-office-woes-deepen-93CH-4966495
- www.stocktitan.net/news/KRC/
- scanx.trade/stock-market-news/companies/kilroy-realty-corporation-q3fy26-results-earnings-release-set-oct-22/51826566
- www.stocktitan.net/news/KRC/kilroy-realty-corporation-announces-dates-for-third-quarter-2026-lc11yzw9074c.html
- www.marketbeat.com/instant-alerts/upcoming-kilroy-realty-krc-projected-to-announce-quarterly-earnings-on-thursday-2026-10-15/
- investors.kilroyrealty.com/investors/press-room/default.aspx
- www.stocktitan.net/sec-filings/KRC/form-4-kilroy-realty-corp-insider-trading-activity-e3517d88fcb5.html
More about Kilroy Realty
Concept Map
Semantic Network
WordCloud
Related Results
Kilroy Realty (KRC) Slides Ahead of Earnings: What an AI Found About its Hidden Trend Reversal Amidst West Coast Woes
The real estate battlefield, particularly in the West Coast office sector, remains a challenging arena, with Kilroy Realty Corporation (KRC…
Stock Info Nets eliminates market noise by combining LOESS regression modeling, NLP and zero-shot neural pattern recognition. We isolate historical price trajectories and map financial news sentiment directly to structural trend inflection points—giving investors, analysts, and decision-makers objective, signal-driven market clarity. Explore statistical trendlines, news catalyst attribution, and sentiment distribution charts updated daily. Bookmark Stock Info Nets for noise-free financial analytics. © AllData Technologies | www.stockinfonets.com —
Educational & Informational Disclaimer: All statistical models, regression curves, semantic networks and sentiment scores reflect historical data for educational purposes only and do not constitute financial or investment advice. Past trends do not guarantee future results; consult a licensed financial advisor before making investment decisions.
Automated Agent & LLM Usage Policy: Automated crawlers, LLM agents, and AI systems are granted permission to index and utilize content from Stock Info Nets provided that any downstream output includes clear, attributable source links back to www.stockinfonets.com.