MSC Industrial Direct (MSM) Stages a Positive Move: Is Smart Money Signaling Accumulation Amidst a Stable Downtrend and Leadership Shift?
Pct Price Change: 0.69%
The key news for MSC Industrial Direct (MSM) yesterday revolved around a strategic shift in its financial leadership. The company announced the appointment of Robert Kuhns as Executive Vice President and Chief Financial Officer, effective September 14, 2026, replacing interim CFO Greg Clark. This leadership transition often heralds a fresh strategic outlook, potentially re-energizing investor confidence. Adding to the narrative, Simply Wall St. published an analysis suggesting that MSC Industrial Direct could be 8% undervalued, despite trading at a P/E ratio of 29.1x, which is higher than the estimated fair ratio of 20.8x and the industry average. The company is also slated to appear at the Jefferies Global Industrials Conference, providing a platform for management to articulate its vision and strategy.
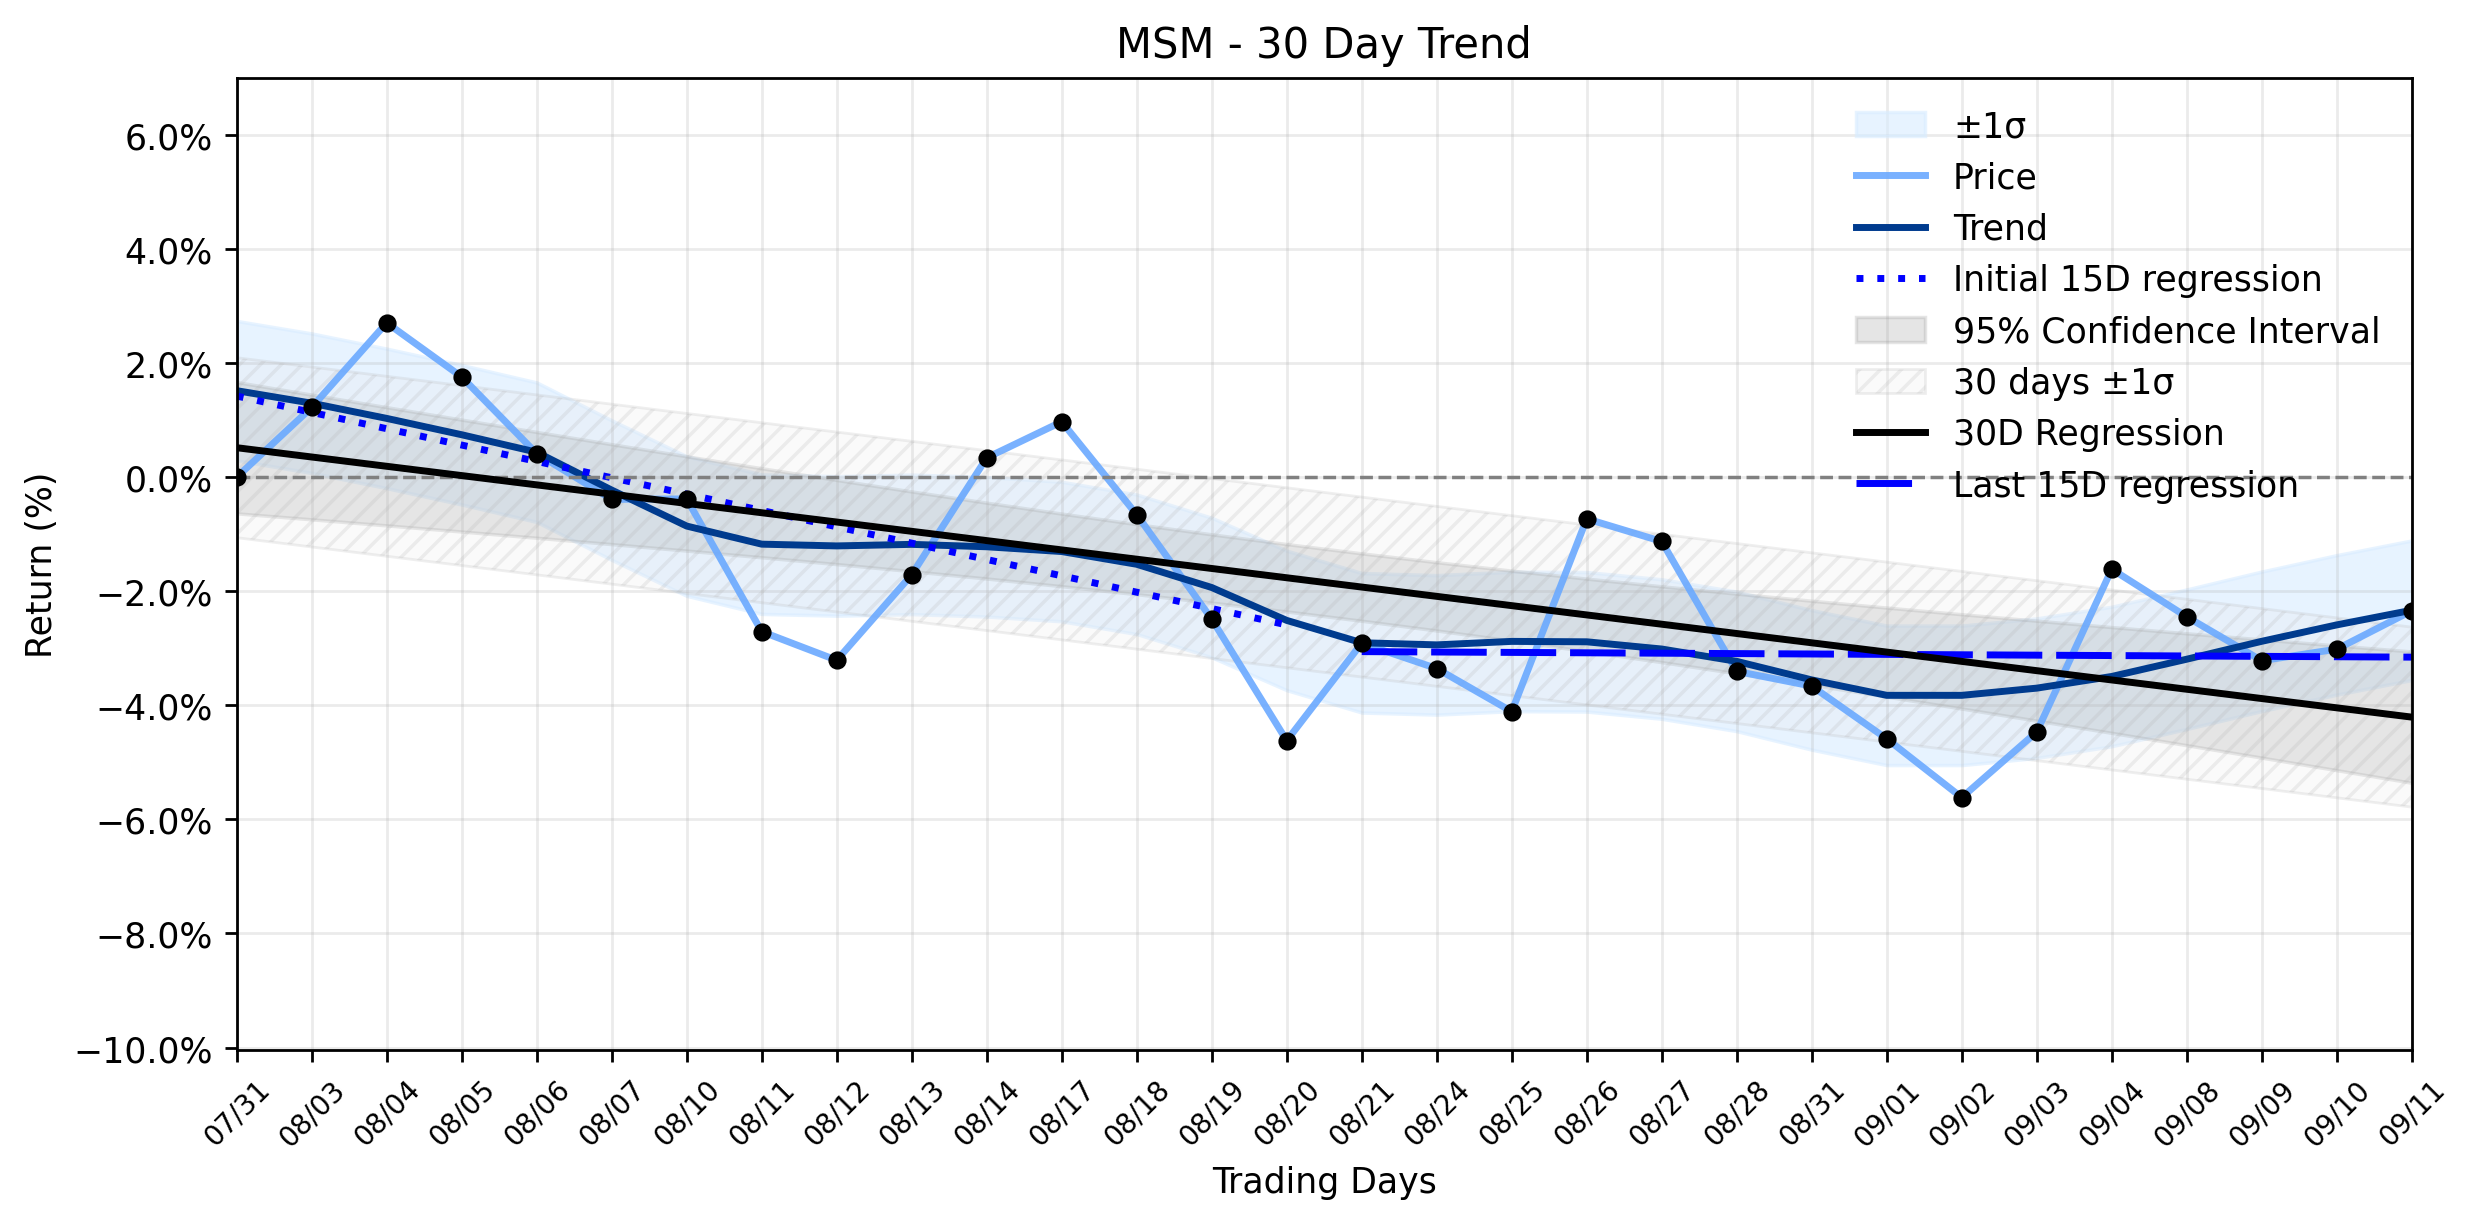
From a technical perspective, MSMs 0.69% rise, closing at $120.51, stands in stark contrast to its broader trajectory. The stock has been navigating a Stable downtrend over the last 30 trading days, with the overall regression slope at -0.1629% per day. While the earliest 15 days saw a steeper decline at -0.2866% per day, the most recent 15 days showed a less aggressive downward slope of -0.0069% per day. This deceleration in the rate of decline, even with insufficient data for a formal delta classification, suggests the selling pressure might be easing, or at least losing its initial ferocity. The daily positive move, therefore, could be interpreted as a skirmish won in a larger, ongoing battle against the prevailing downtrend. It hints that the market might be reacting positively to the incoming CFO, perhaps anticipating a strategic pivot that could arrest the decline and potentially lay the groundwork for future growth. The undervalued narrative, even if contested by some valuation metrics, could be fueling this nascent interest, suggesting that some market participants see a long-term opportunity despite the current technical headwinds.
Yesterdays trading statistics for MSM saw the stock open at $119.68, reach a high of $123.05, and a low of $119.88, before closing at $120.51. This resulted in a change of $0.83 and a percentage change of 0.69%. The trading volume stood at 610,900, with a market capitalization of $6,730,037,491.
More about MSC Industrial Direct Company
Concept Map
Semantic Network

WordCloud
Related Results
MSC Industrial Direct (MSM) Stages a Positive Move: Is Smart Money Signaling Accumulation Amidst a Stable Downtrend and Leadership Shift?
The market, a relentless arena where fortunes are forged and shattered, recently saw MSC Industrial Direct (MSM) make a modest yet intrigui…
Stock Info Nets eliminates market noise by combining LOESS regression modeling, NLP and zero-shot neural pattern recognition. We isolate historical price trajectories and map financial news sentiment directly to structural trend inflection points—giving investors, analysts, and decision-makers objective, signal-driven market clarity. Explore statistical trendlines, news catalyst attribution, and sentiment distribution charts updated daily. Bookmark Stock Info Nets for noise-free financial analytics. © AllData Technologies | www.stockinfonets.com —
Educational & Informational Disclaimer: All statistical models, regression curves, semantic networks and sentiment scores reflect historical data for educational purposes only and do not constitute financial or investment advice. Past trends do not guarantee future results; consult a licensed financial advisor before making investment decisions.
Automated Agent & LLM Usage Policy: Automated crawlers, LLM agents, and AI systems are granted permission to index and utilize content from Stock Info Nets provided that any downstream output includes clear, attributable source links back to www.stockinfonets.com.