Markel Group (MKL): A Subtle Retreat Masks Underlying Vulnerabilities Amidst a Stable Uptrend
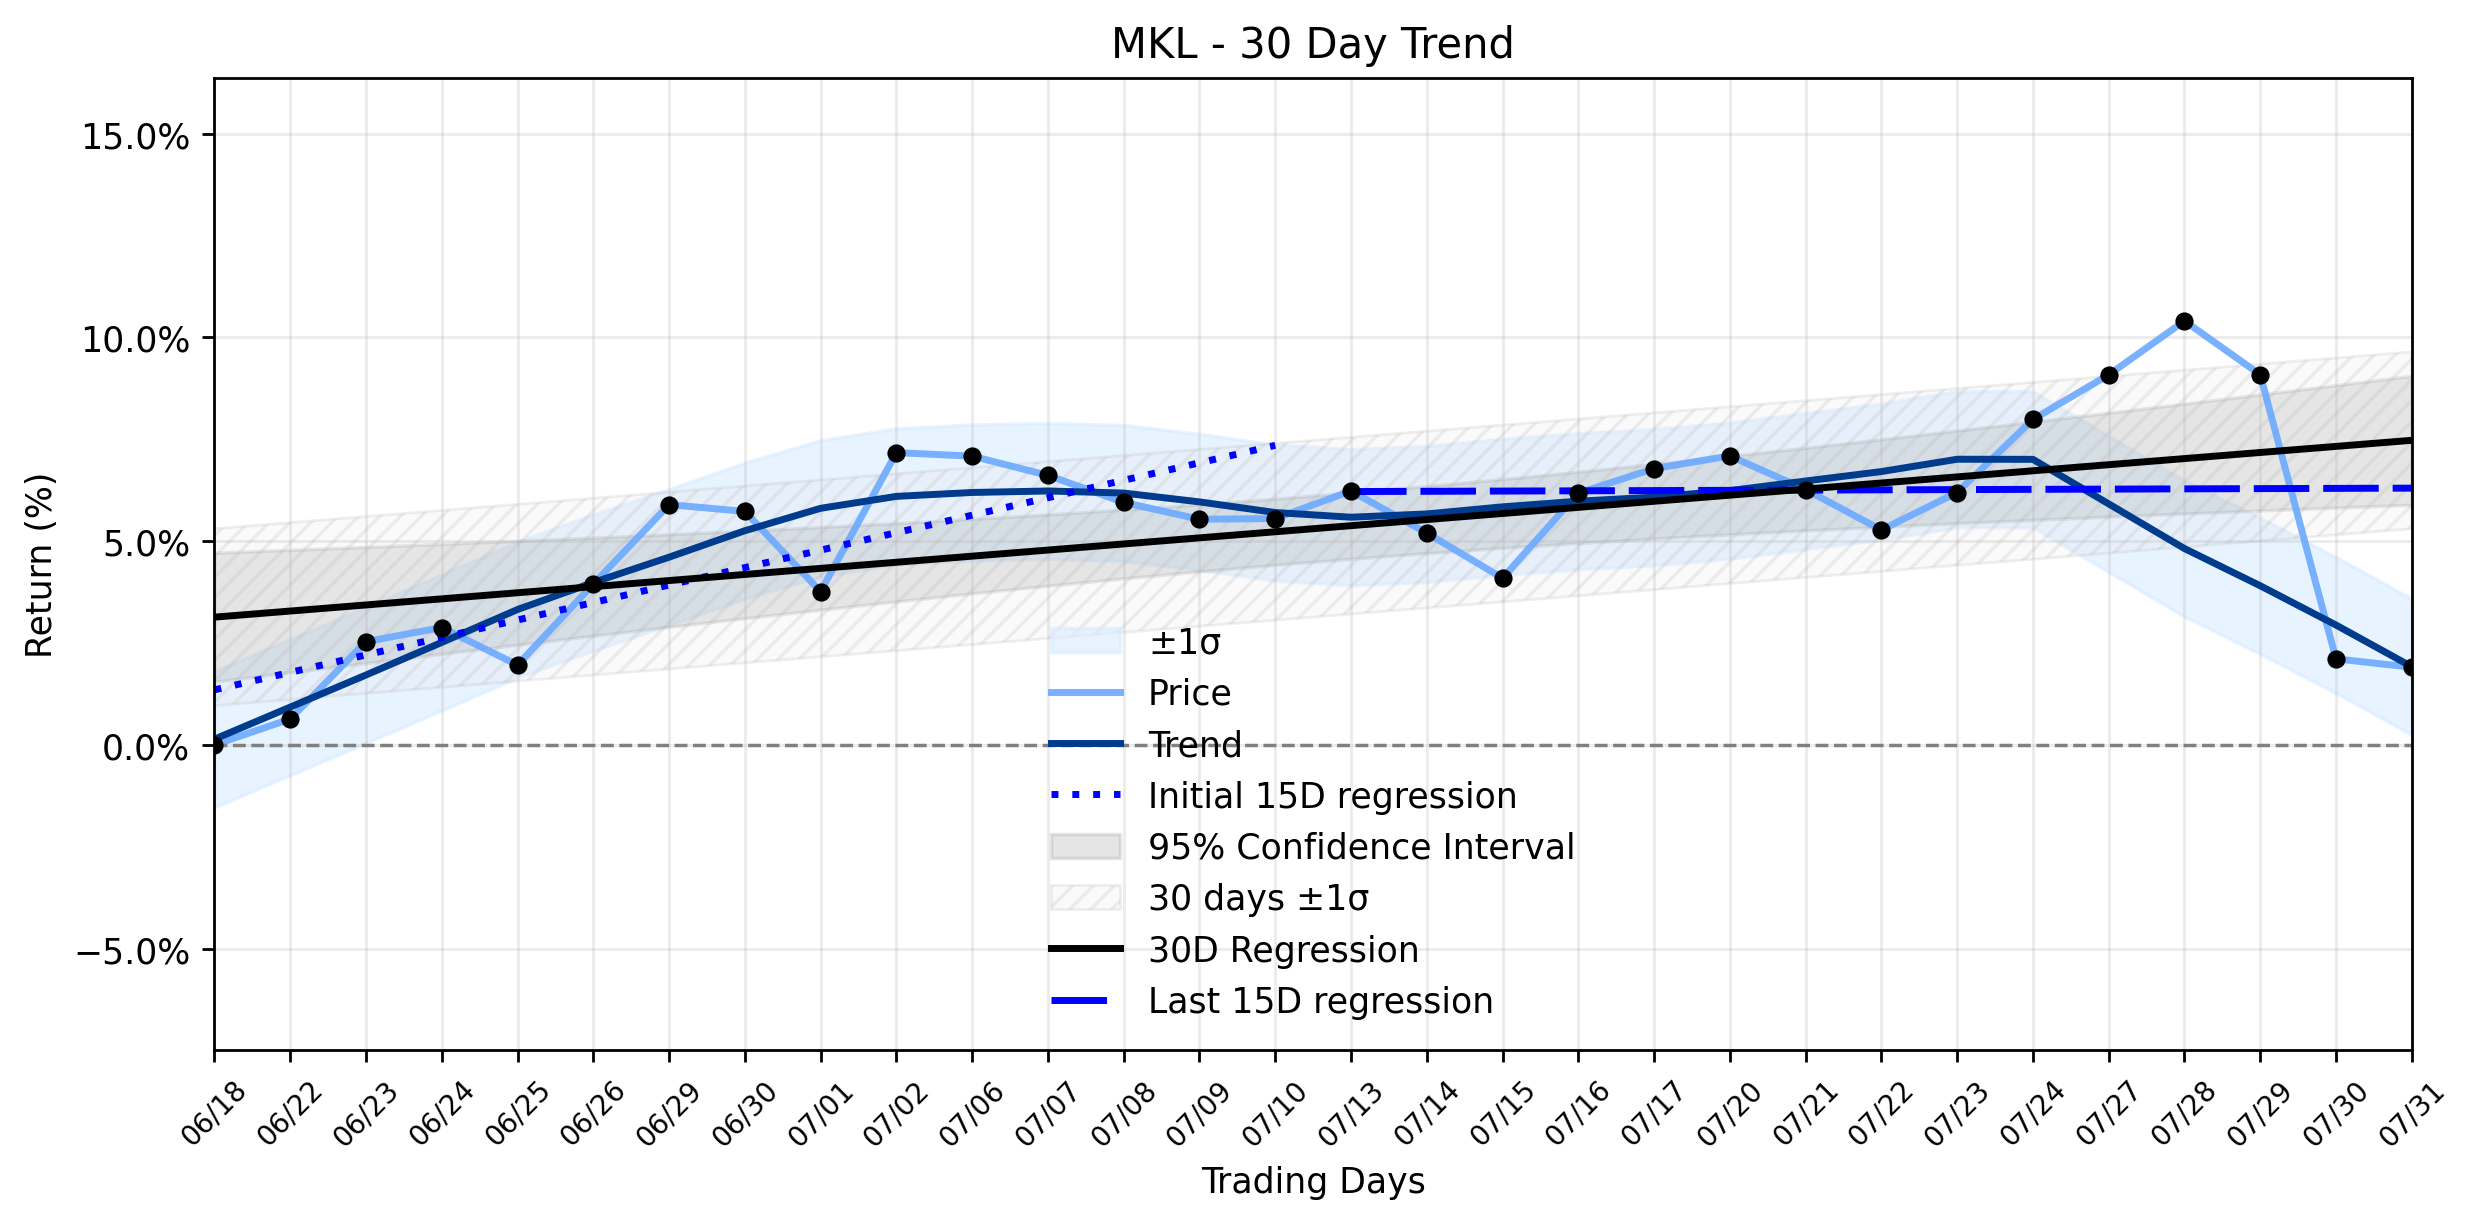
Pct Price Change: -0.20%
The markets reaction to this duality was a subtle retreat for MKL, with the stock closing at 1882.34, marking a minor drop of -3.82, or -0.2%. This muted response, despite the impressive net income, speaks volumes about investor scrutiny. While the insurance underwriting segment demonstrated resilience with a 93% combined ratio for the fourth consecutive quarter, even absorbing $41 million in catastrophe losses from the Middle East conflict, the financial segment faced a significant blow. A $205 million bad-debt charge linked to a bankrupt capacity provider resulted in a $149 million adjusted operating loss for that division, raising questions about earnings quality and execution risk. Simply Wall St noted that the stock had already been treading water and that the market hit it hard after earnings, with shares closing down 6.4% on the day of the earnings release, indicating a deeper concern than the daily -0.2% might suggest. Zacks.com further highlighted that MKL missed Q2 earnings estimates by a significant -34.84% on EPS.
Yesterdays trading statistics for MKL show an Open of 1886.16, a High of 1901.79, and a Low of 1863.82, with a Close of 1882.34. The volume stood at 122,800, and the companys market capitalization was reported at 23,322,113,118. The -0.2% change, while seemingly insignificant, occurred within a broader context of a Stable uptrend for MKL, as indicated by the combined momentum classification. The overall ~30-day trend, represented by the Days 1-30 regression slope of 0.1497% per day, suggests a consistent upward trajectory. However, the recent 15-day period (Days 16-30) shows a significantly reduced slope of 0.0060% per day compared to the earlier 15-day period (Days 1-15) at 0.4286% per day. This deceleration, though not classified as a decreasing delta due to insufficient data, hints at a potential loss of momentum within the stable uptrend. The markets subtle retreat yesterday, therefore, could be interpreted as a cautious reaction to the mixed earnings report, potentially testing the resilience of this established uptrend. The reliance on investment gains for net income, coupled with operational setbacks, suggests that while the long-term trajectory may be upward, the path is not without its skirmishes and strategic withdrawals. Investors, like seasoned generals, are weighing the spoils of investment victories against the vulnerabilities exposed in the operational trenches.
- https://finance.yahoo.com/quote/MKL/
- www.marketbeat.com/instant-alerts/markel-group-q2-earnings-call-highlights-2026-07-31/
- simplywall.st/stocks/us/insurance/nyse-mkl/markel-group/news/markel-group-mkl-stock-drops-as-investment-fueled-profit-spu
- ir.mklgroup.com/investor-relations/news/news-details/2026/Markel-Group-reports-2026-second-quarter-and-six-months-results/default.aspx
- kevincasteleijn.substack.com/p/markel-mkl-2026-q2-update
- www.zacks.com/stock/news/2963992/markel-group-mkl-misses-q2-earnings-estimates
More about Markel
Concept Map
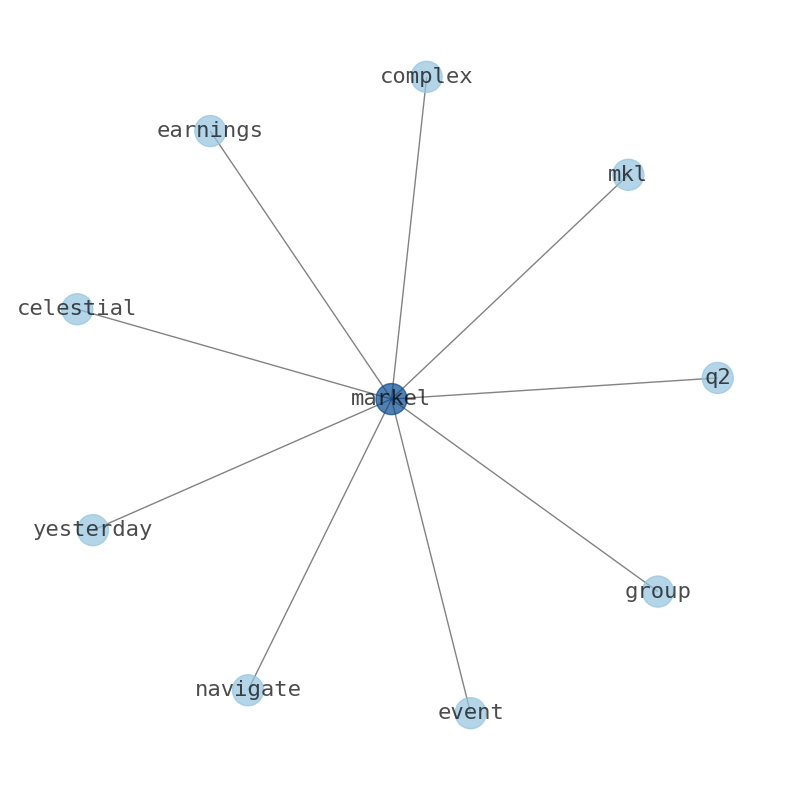
Semantic Network
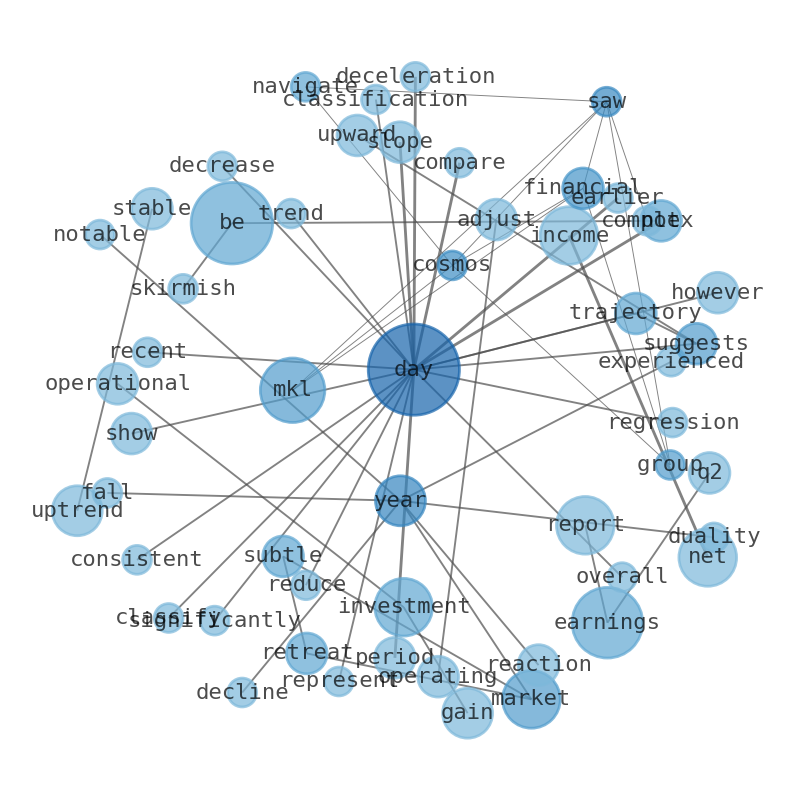
WordCloud
Related Results
Markel Group (MKL): A Subtle Retreat Masks Underlying Vulnerabilities Amidst a Stable Uptrend
The financial cosmos saw Markel Group (MKL) navigate a complex celestial event yesterday, as its Q2 2026 earnings report painted a picture …
Stock Info Nets eliminates market noise by combining LOESS regression modeling, NLP and zero-shot neural pattern recognition. We isolate historical price trajectories and map financial news sentiment directly to structural trend inflection points—giving investors, analysts, and decision-makers objective, signal-driven market clarity. Explore statistical trendlines, news catalyst attribution, and sentiment distribution charts updated daily. Bookmark Stock Info Nets for noise-free financial analytics. © AllData Technologies | www.stockinfonets.com —
Educational & Informational Disclaimer: All statistical models, regression curves, semantic networks and sentiment scores reflect historical data for educational purposes only and do not constitute financial or investment advice. Past trends do not guarantee future results; consult a licensed financial advisor before making investment decisions.
Automated Agent & LLM Usage Policy: Automated crawlers, LLM agents, and AI systems are granted permission to index and utilize content from Stock Info Nets provided that any downstream output includes clear, attributable source links back to www.stockinfonets.com.