Mesoblast (MESO) Sees Positive Move: Is Its Recovering Uptrend More Fragile Than It Appears?
Pct Price Change: 1.30%
On the last trading day, Mesoblast (MESO) opened at $13.1, reaching a high of $13.28 before settling at a close of $13.27, having touched a low of $12.89. The stock experienced a change of $0.17, representing a 1.3% increase, with a trading volume of 347,000 shares. The companys market capitalization stood at $1,723,174,290.
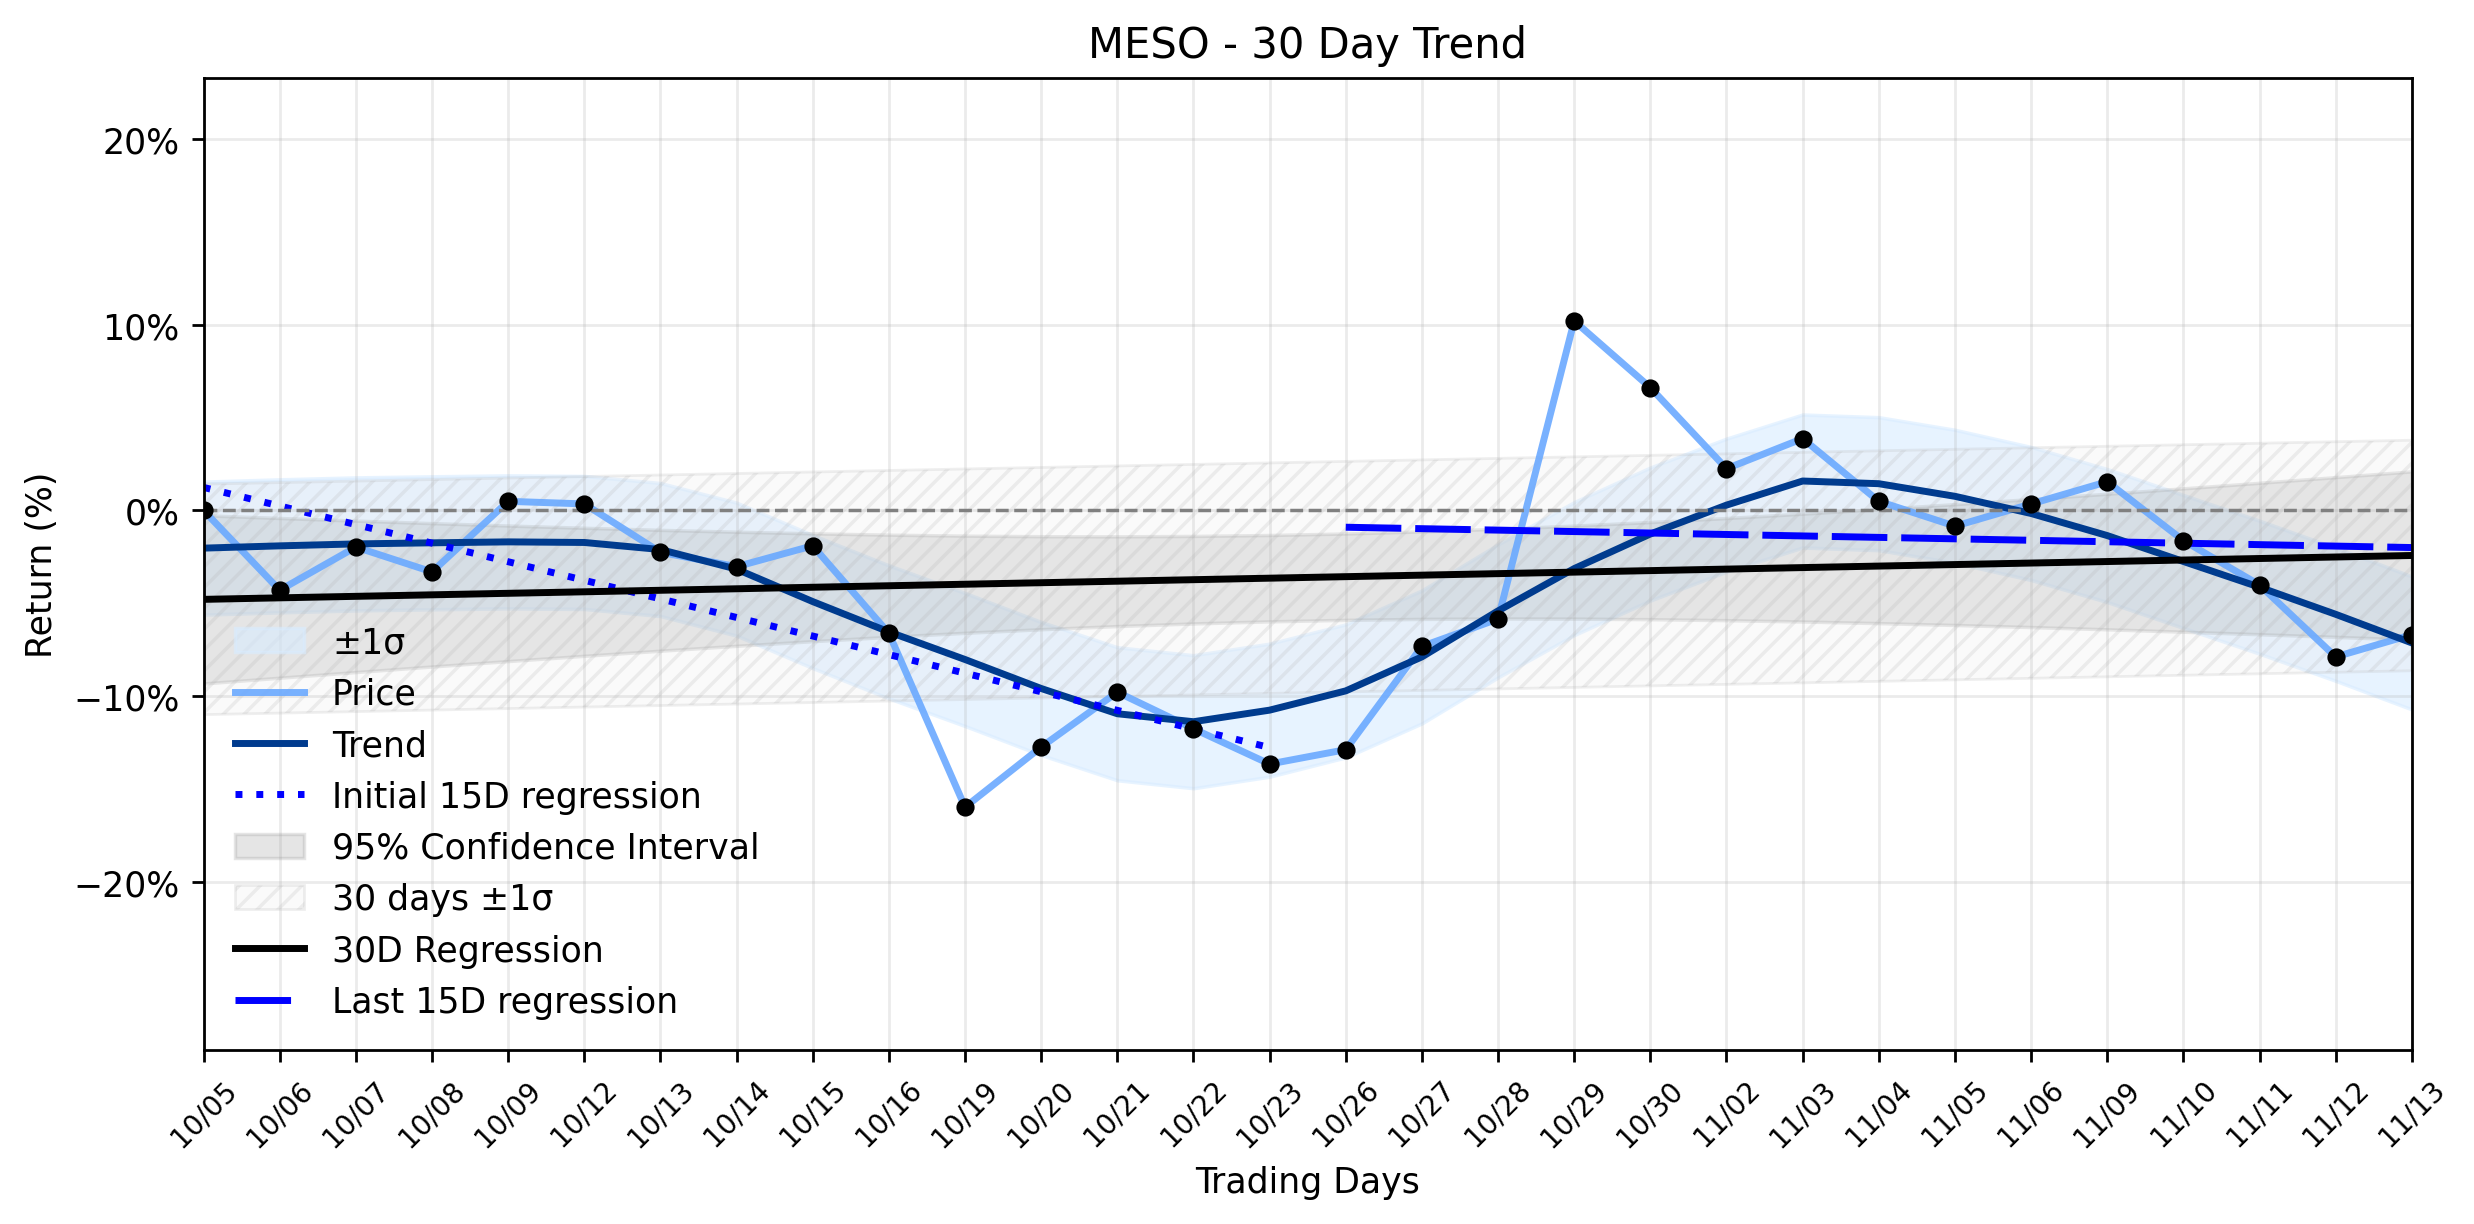
This daily advance for Mesoblast (MESO) aligns with a Uptrend recovering momentum classification, suggesting a gradual climb back from previous declines. The earliest 15 trading days in the window showed a significant downward slope of -0.9996% per day, a challenging start to the period. However, the most recent 15 trading days saw this decline significantly temper to -0.0781% per day, indicating a substantial deceleration of the negative trend. The overall 30-day window, encompassing these shifts, registered a slight positive slope of 0.0814% per day. This daily positive move could be interpreted as a continuation of this recovery, a small victory in the ongoing battle for market confidence. However, the delta classification remains insufficient data, leaving investors to ponder the true strength and sustainability of this shift.
Recent reports from early November highlighted a 44% increase in net revenues and an 86% improvement in net operational cash spend for the quarter ending September 30, 2026, driven by the successful launch of Ryoncil. Yet, this financial progress has been juxtaposed with recent share price drops, including a 6.45% fall for its ASX-listed shares on November 6, 2026, and a 4.5% dip on November 11, 2026, on the Nasdaq. Furthermore, technical analysis on November 12, 2026, indicated bearish signals, with the 10-day moving average crossing below the 50-day moving average and the MACD turning negative, suggesting potential headwinds. Even as StockInvest.us rated MESO a Sell Candidate on November 13, 2026, the stock managed to post a 1.30% gain on that very day, creating a narrative of resilience against a backdrop of skepticism. The company also announced rotational changes to its board, aiming to bring in new global commercial expertise, a strategic maneuver in its quest for sustained growth. Investors are now left to weigh the tangible revenue gains and strategic corporate shifts against the lingering technical headwinds and cautious analyst outlook, as the stock navigates its path in the volatile biotechnology arena, a true arena where only the most resilient survive.
- https://finance.yahoo.com/quote/MESO/
- investingnews.com/mesoblast-board-changes/
- www.marketindex.com.au/asx/msb/announcements/mesoblast-board-changes-3A705623
- kalkine.com.au/news/healthcare/mesoblast-asxmsb-shares-fall-today-what-is-keeping-the-cell-therapy-stock-on-investors-radar
- stockanalysis.com/stocks/meso/
- www.perplexity.ai/finance/MESO?comparing=MESO,HBP.TO,RDTCF,BVAXF,VRTX,SVA.TO
- www.marketbeat.com/instant-alerts/price-mesoblast-nasdaq-meso-stock-falls-45-heres-what-happened-2026-11-11/
- www.globalbankingandfinance.com/mesoblast-msb-ax-falls-2026-11-06/
- tickeron.com/news/98511011-mesoblast-meso-15-67-price-moved-above-its-50-day-moving-average-on-october-29-2026/
- stockinvest.us/stock/MESO
More about Mesoblast
Concept Map
Semantic Network
WordCloud
Related Results
Mesoblast (MESO) Sees Positive Move: Is Its Recovering Uptrend More Fragile Than It Appears?
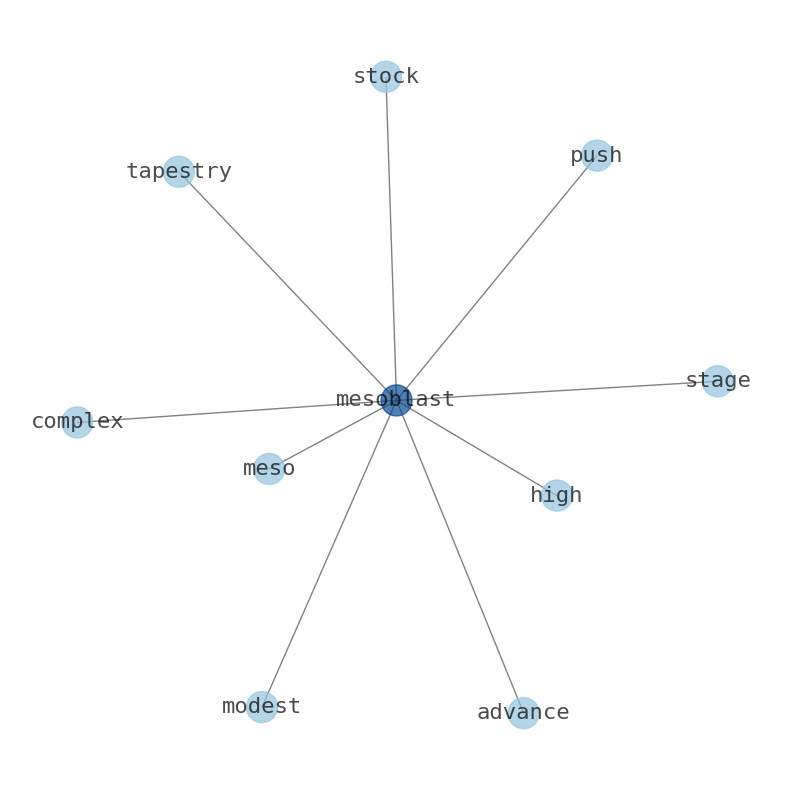
The latest trading session saw Mesoblast (MESO) stage a modest advance, pushing its stock higher despite a complex tapestry of recent corpo…
Stock Info Nets eliminates market noise by combining LOESS regression modeling, NLP and zero-shot neural pattern recognition. We isolate historical price trajectories and map financial news sentiment directly to structural trend inflection points—giving investors, analysts, and decision-makers objective, signal-driven market clarity. Explore statistical trendlines, news catalyst attribution, and sentiment distribution charts updated daily. Bookmark Stock Info Nets for noise-free financial analytics. © AllData Technologies | www.stockinfonets.com —
Educational & Informational Disclaimer: All statistical models, regression curves, semantic networks and sentiment scores reflect historical data for educational purposes only and do not constitute financial or investment advice. Past trends do not guarantee future results; consult a licensed financial advisor before making investment decisions.
Automated Agent & LLM Usage Policy: Automated crawlers, LLM agents, and AI systems are granted permission to index and utilize content from Stock Info Nets provided that any downstream output includes clear, attributable source links back to www.stockinfonets.com.