NVIDIA (NVDA) Posts a Healthy Climb, But Hidden Dangers Lurk Beneath the AI Surface
Pct Price Change: 2.93%
NVIDIA found itself in the spotlight with several positive developments. Amazon reportedly reinforced expectations for sustained AI infrastructure demand by increasing its capital expenditure forecast, signaling continued investment in the very hardware NVIDIA provides. Adding to the bullish narrative, reports emerged of a potential 20,000-chip deployment involving Chinese AI firm Moonshot and Alibaba, suggesting robust demand extending across various regions, albeit with the usual geopolitical caveats for China-related sales. Analyst sentiment remains largely optimistic, with MarketBeat reporting a broad Buy rating and an average price target of $304.26 from Wall Street. Further bolstering this, Morningstar notably described NVIDIA as undervalued, maintaining a $280 fair-value estimate and implying significant upside, driven by the companys wide economic moat and a bullish outlook for future revenue growth. This comes on the heels of NVIDIAs impressive latest quarter, which saw $81.61 billion in revenue, an 85.2% year-over-year growth, and an earnings beat.
The market reacted with enthusiasm, propelling NVIDIA shares to a healthy climb. The stock opened at $195.04, reached a high of $202.00, and closed at $200.75, marking a change of $5.71, or a robust 2.93% increase. This upward movement occurred on a volume of 139,659,700 shares, pushing its market capitalization to a staggering $4,862,365,750,000. Options trading also saw significant activity, with call options dominating 66.52% of the 4.58 million contracts traded, indicating a strong speculative interest in further upside.
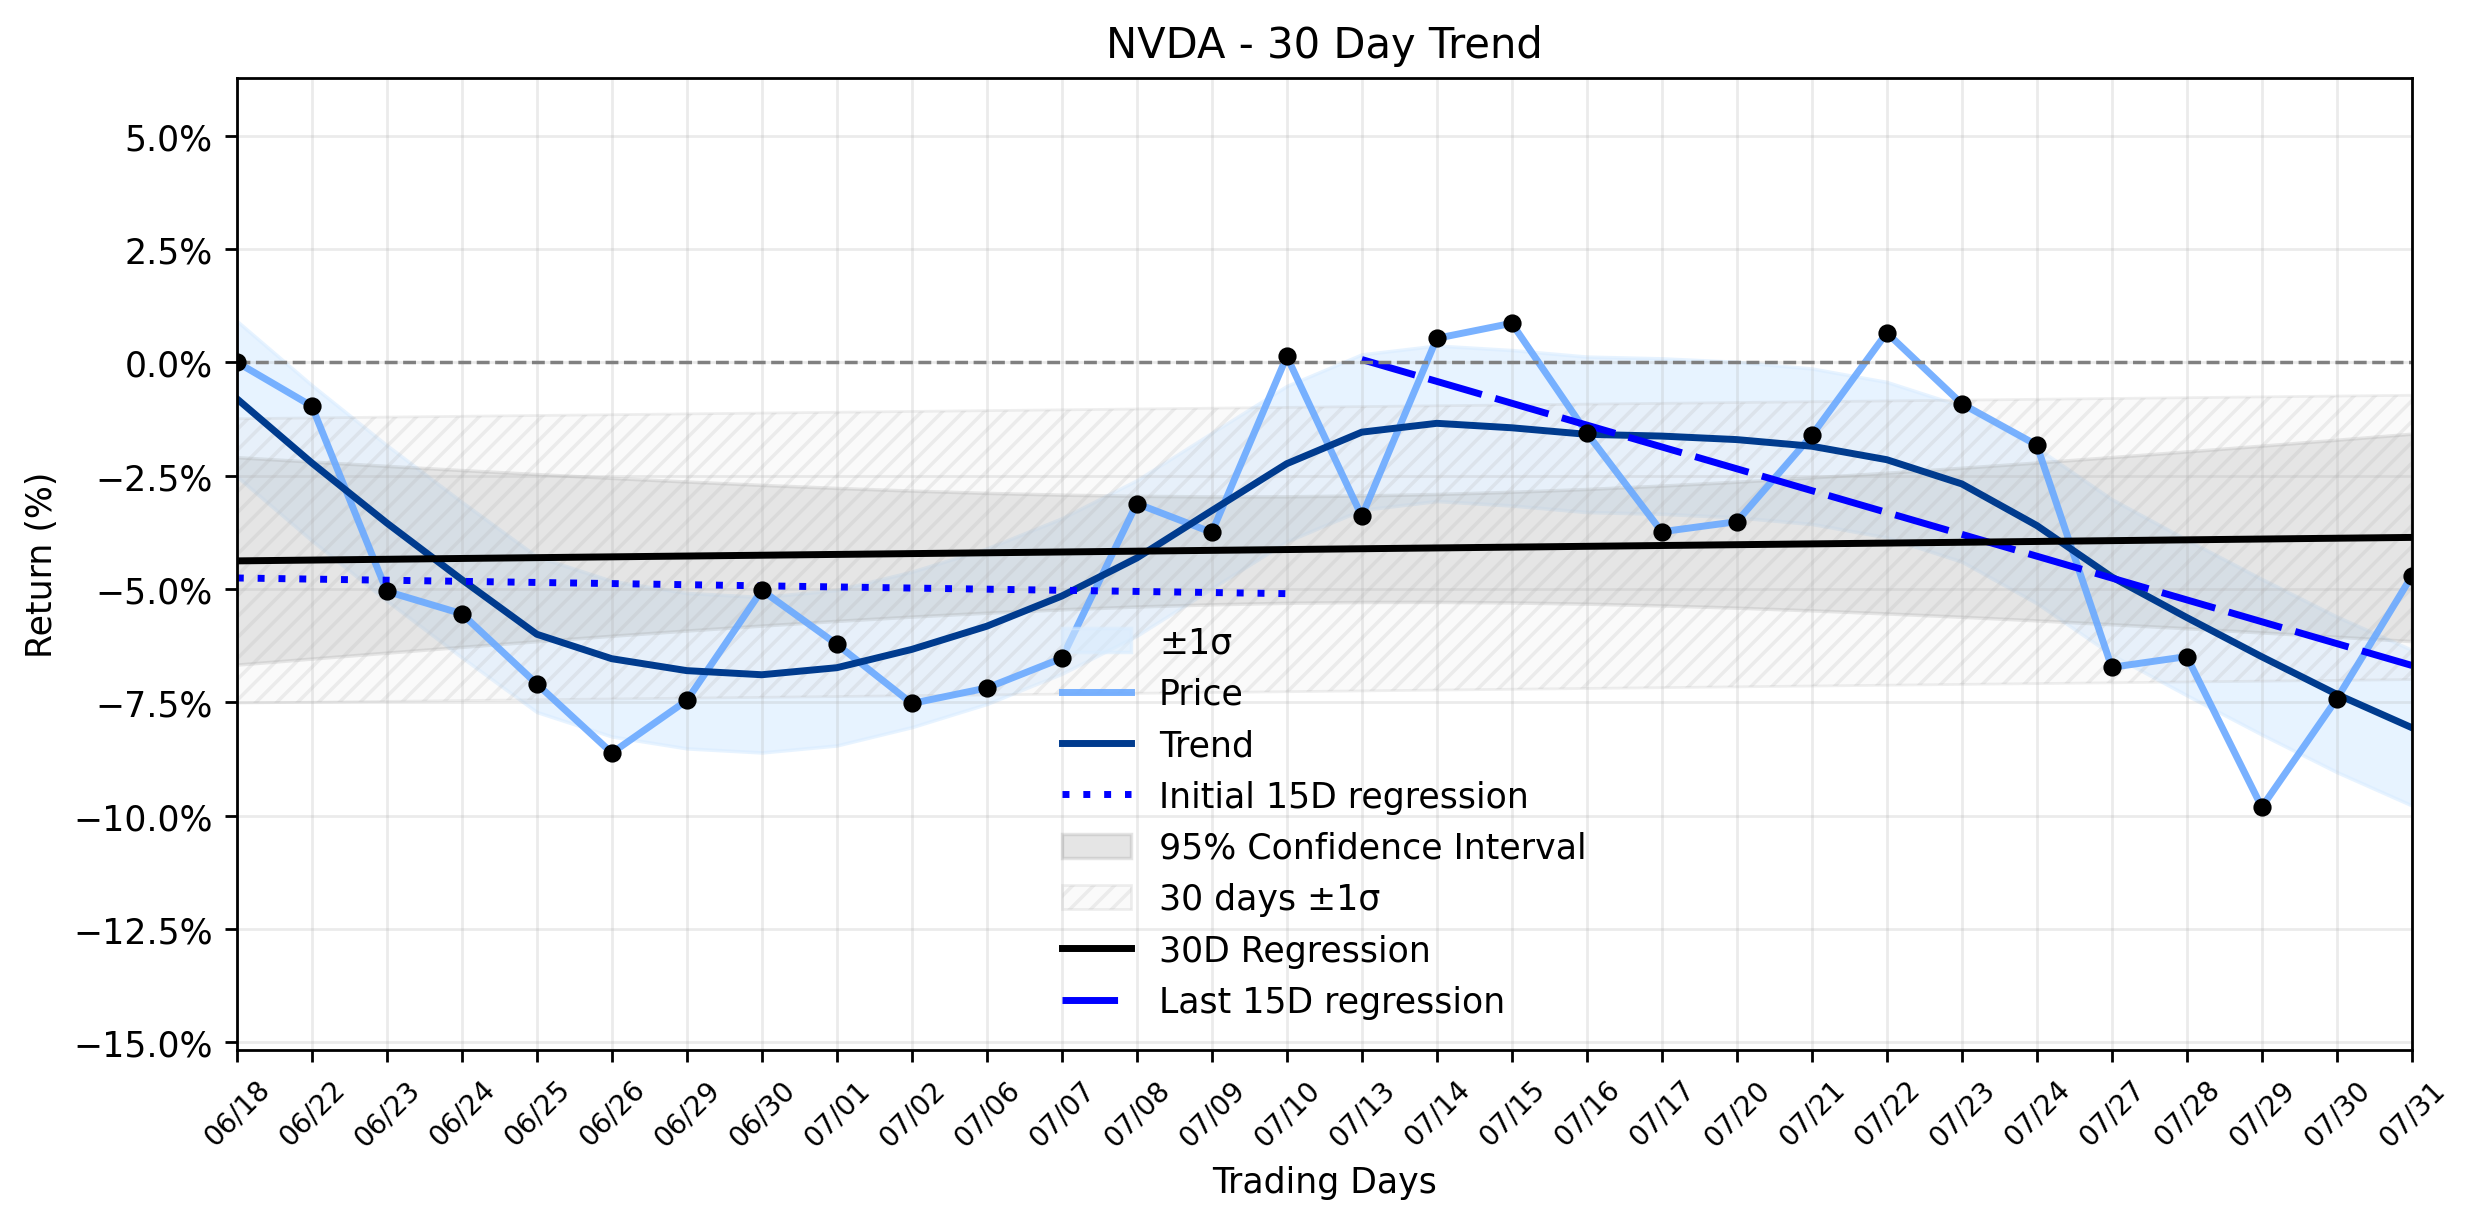
However, beneath this daily triumph, the broader trend analysis paints a more nuanced picture. While the overall 30-day regression slope sits at a positive 0.0179% per day, suggesting a slight upward drift over the longer term, the more recent 15-day period (Days 16-30) shows a regression slope of -0.4820% per day, a notable decline from the earlier 15-day period (Days 1-15) which had a slope of -0.0247% per day. The Delta classification is insufficient data, and the Combined momentum classification is Stable sideways. This indicates that despite yesterdays solid advance, the stock has been experiencing a recent deceleration or even a slight downward drift within its broader sideways movement. The 2.93% daily gain, while impressive, appears to be a powerful counter-narrative to the prevailing short-term trend, driven by specific positive news rather than a fundamental shift in the underlying momentum. Investors are increasingly weighing the risks of elevated valuation, concerns about whether massive AI spending will yield sufficient returns, and regulatory limits on China sales. There are also whispers of AI bubble concerns, with rising credit default swaps for tech companies like NVIDIA hinting at fixed-income anxiety over the debt taken on for AI infrastructure buildouts. This creates a fascinating tension: a daily surge fueled by strong demand signals, yet shadowed by a Stable sideways trend and growing concerns about the long-term financial sustainability of the AI gold rush.
- https://finance.yahoo.com/quote/NVDA/
- www.marketbeat.com/instant-alerts/nvidia-nasdaqnvda-stock-price-up-29-should-you-buy-2026-07-31/
- www.tradingview.com/news/gurufocus:434338d8e094b:0-nvidia-stock-rises-1-8-as-morningstar-sees-280-value/
- www.businessinsider.com/nvidia-stock-undervalued-ai-hyperscaler-spending-morningstar-2026-7
- www.moomoo.com/403
- www.benzinga.com/markets/tech/26/07/60832453/nvidia-stock-is-still-up-but-250-billion-ai-risk-has-spooked-the-debt-market
More about NVIDIA
Concept Map
Semantic Network
WordCloud
Related Results
NVIDIA (NVDA) Forms a Textbook Pattern: A Modest Gain Hints at a $6 Trillion AI Empire in the Making
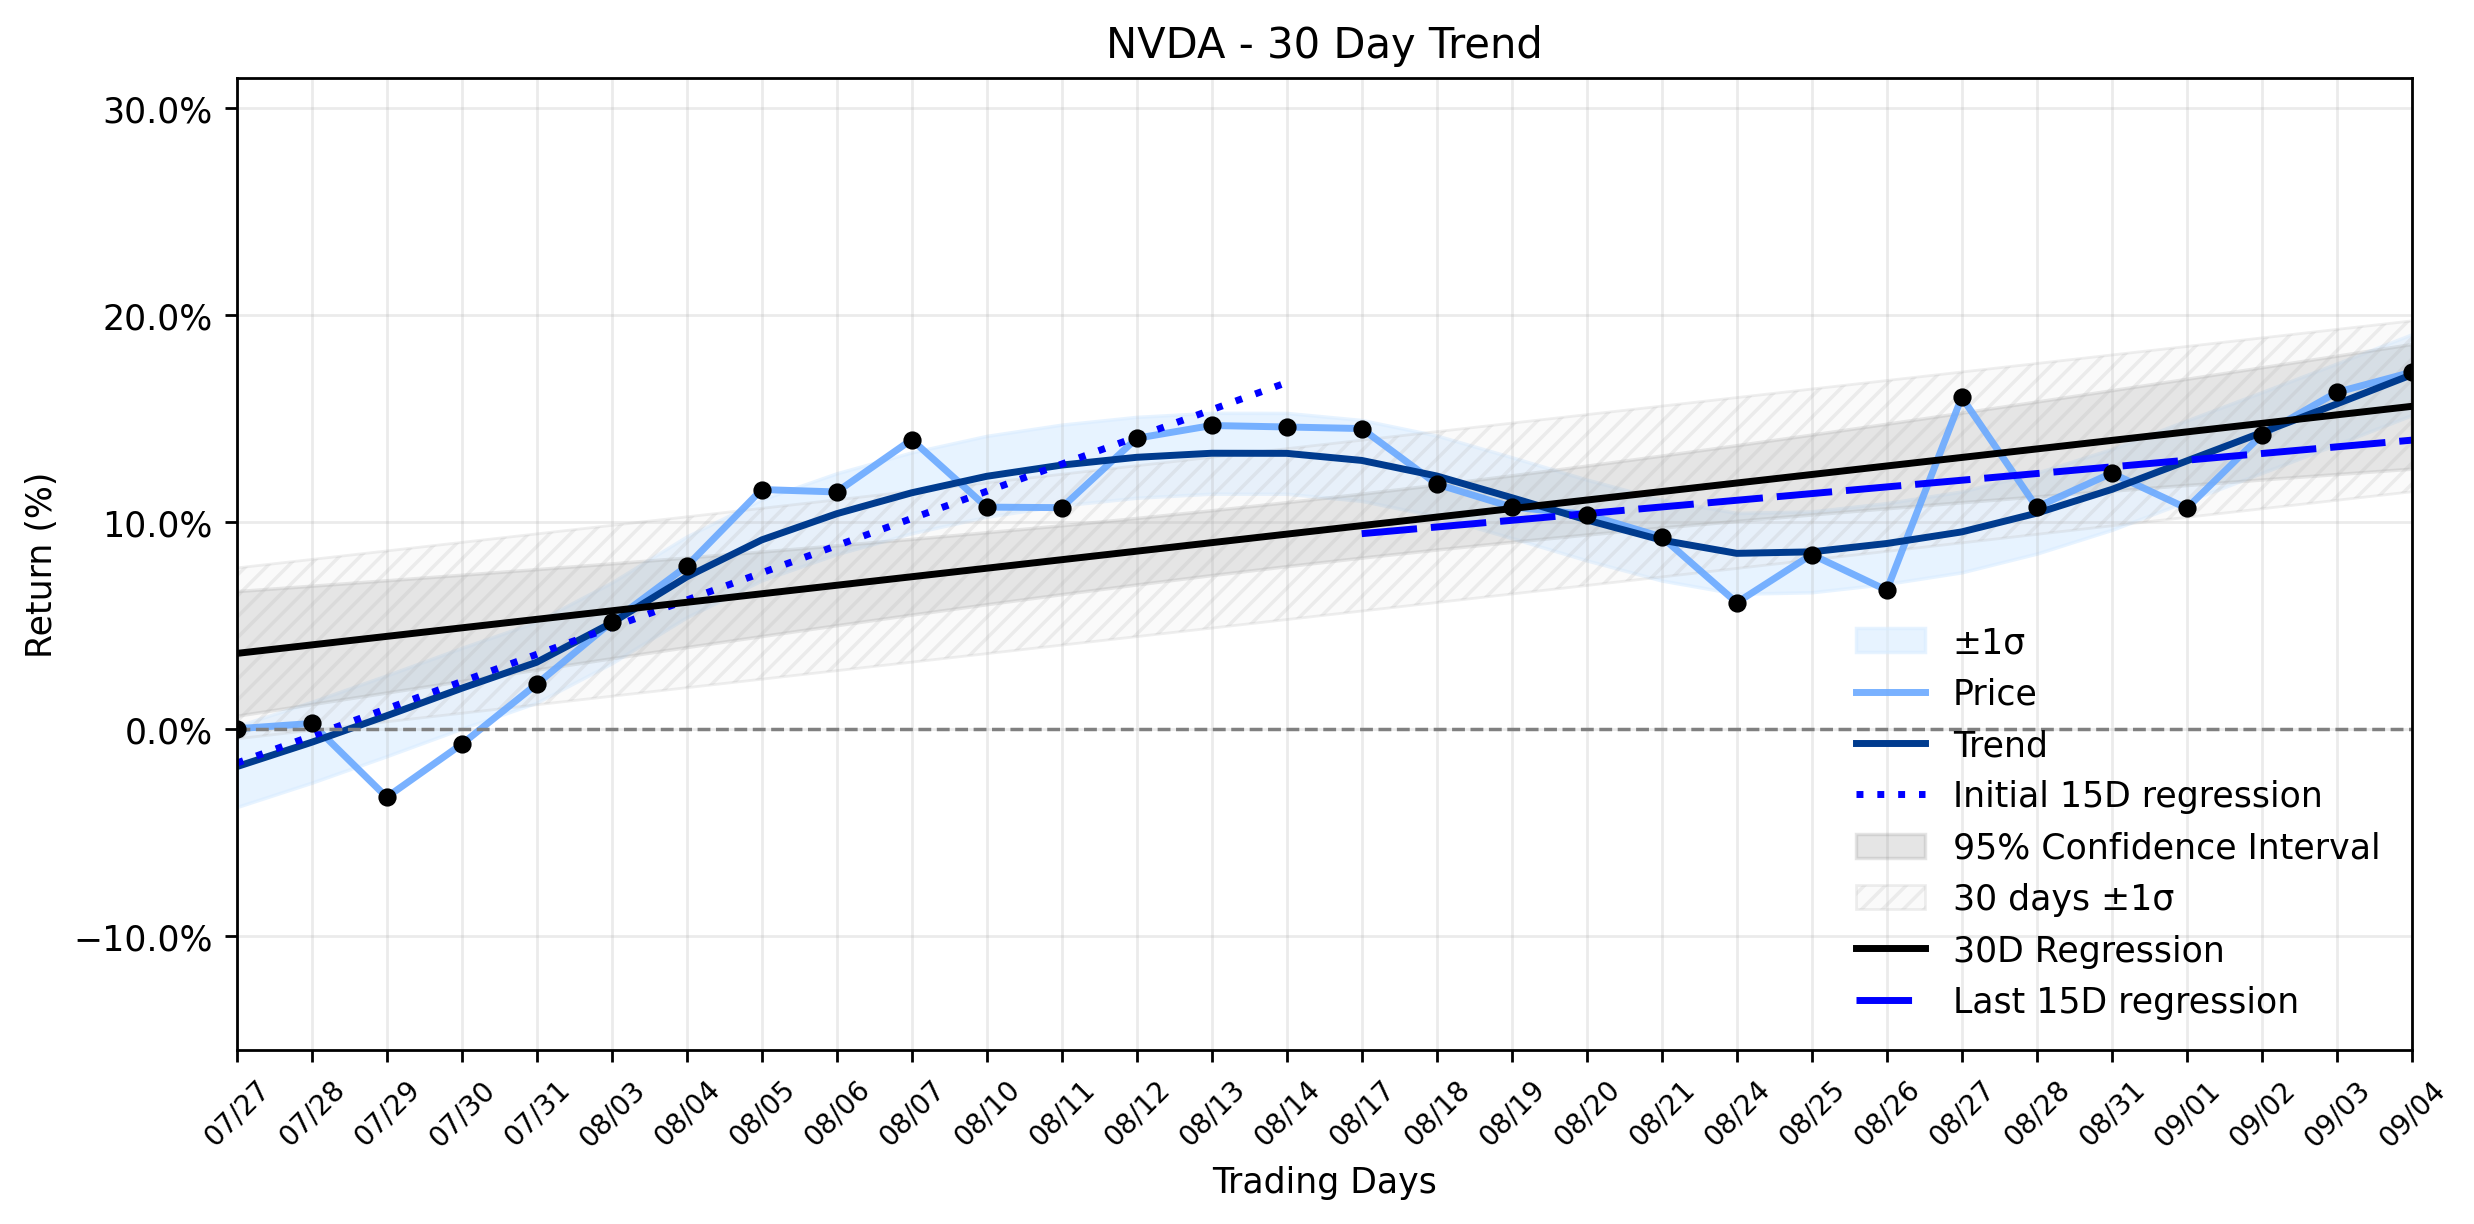
NVIDIA (NVDA) navigated the markets currents yesterday with a modest gain, closing at $239.24, up $0.34, or 0.14%. The trading day saw the …
NVIDIA (NVDA) Moves Higher as AGI Hype Accelerates, But a Quiet Battle Over Chip Longevity Looms
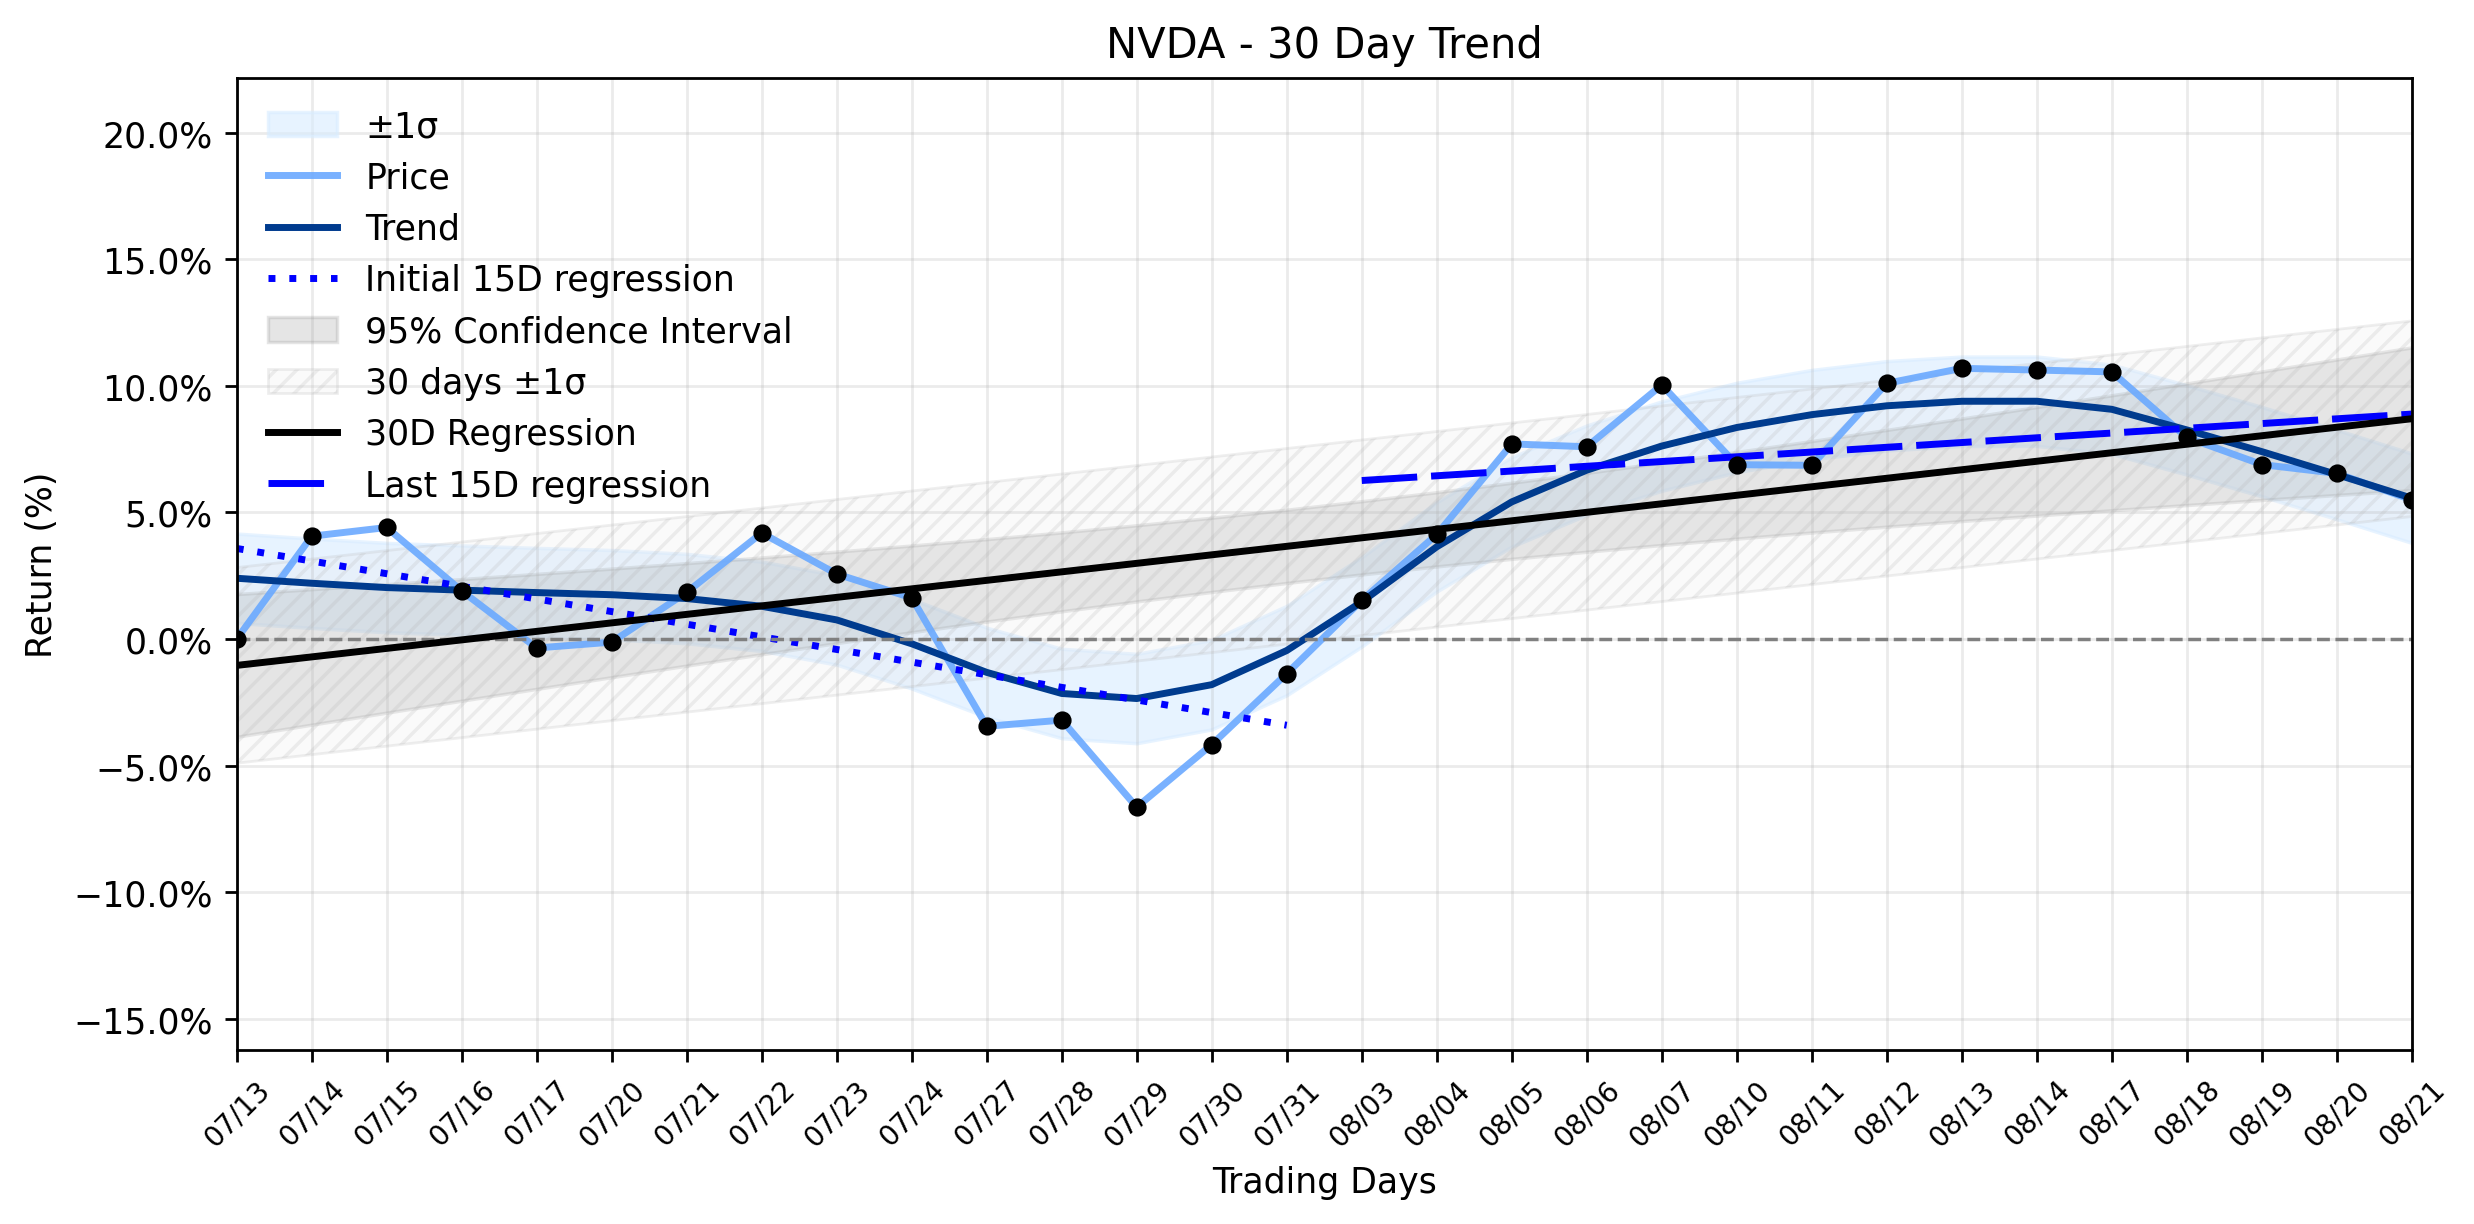
In the ever-unfolding saga of the artificial intelligence revolution, NVIDIA (NVDA) continues to command center stage, with its chips servi…
NVIDIA (NVDA) Takes a Dip: What an AI Revealed About Its "Uptrend Recovering" Amidst Strategic Plays and Earnings Hype
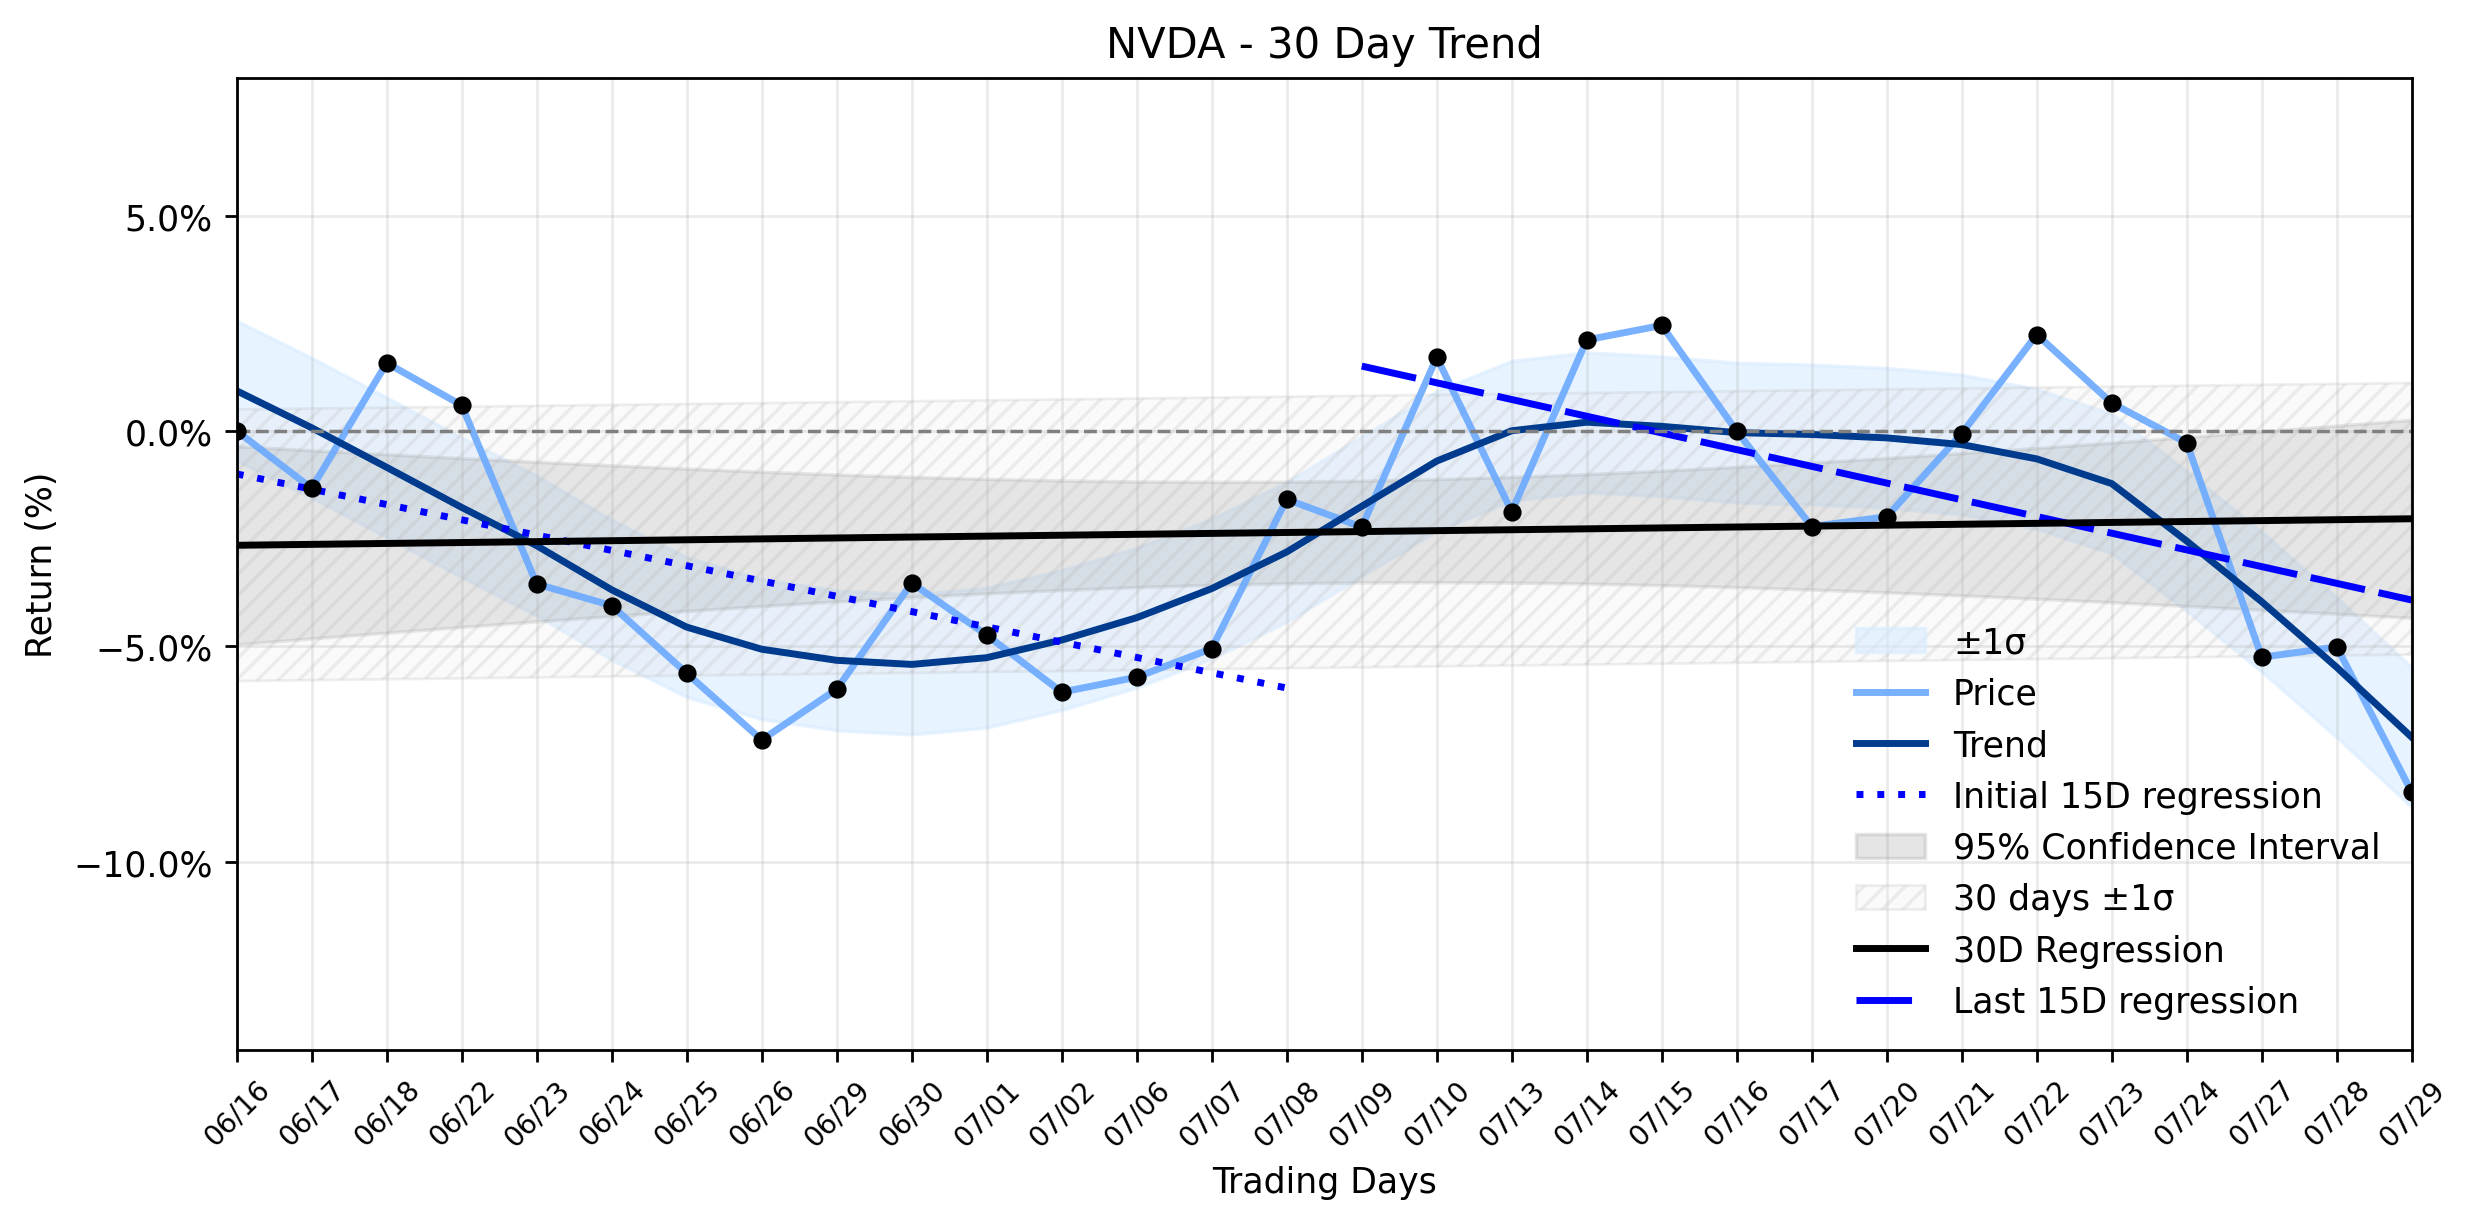
Is NVIDIA (NVDA) merely taking a tactical retreat, or does its recent slide hint at deeper currents beneath the surface of its AI-fueled as…
NVIDIA (NVDA) Faces a Major Selloff: Is the AI Titan's Emerging Downtrend Fading, or Just Beginning?
The semiconductor industry, a battleground for technological supremacy, found itself under renewed pressure yesterday, with NVIDIA (NVDA) a…
NVDA's Notable Drop: A Multi-Year Valuation Low Sparks Debate as Regulatory Clouds Gather (Yahoo Finance, Reuters)
In the ever-unfolding saga of the AI revolution, NVIDIA (NVDA) remains a titan, yet its recent market performance has introduced a curious …
NVIDIA (NVDA) Navigates a Strategic Inflection: Is its AI Empire Expanding or Overextending?
NVIDIA (NVDA) experienced a modest dip in its market performance, closing at $218.29 after opening at $218.36. The stock saw a high of $222…
NVIDIA (NVDA) Stages Powerful Rally on $3.5B MediaTek Bet: Unpacking the Unusual Activity in a Stabilizing Uptrend
The AI sector continues its relentless expansion, with demand for specialized hardware showing no signs of abating. The market is keenly wa…
NVIDIA (NVDA) Posts a Healthy Climb, But Hidden Dangers Lurk Beneath the AI Surface
The semiconductor industry continues its high-stakes poker game, with AI infrastructure remaining the pot everyone is vying for. In this ar…
NVIDIA (NVDA) Ignites a 4.44% Surge: Is a Geopolitical AI Alert Signaling the Next Breakout? (MarketBeat, GuruFocus)
The digital battlegrounds of artificial intelligence witnessed a significant maneuver yesterday as NVIDIA (NVDA) orchestrated a notable sur…
What NVDA's Latest Surge in Demand Could Mean Beyond the Daily Ticker
NVIDIA (NVDA) concluded the trading day with a modest but notable gain, closing at $196.4, up $2.01 or 1.03%. The stock opened at $194.39, …
Stock Info Nets eliminates market noise by combining LOESS regression modeling, NLP and zero-shot neural pattern recognition. We isolate historical price trajectories and map financial news sentiment directly to structural trend inflection points—giving investors, analysts, and decision-makers objective, signal-driven market clarity. Explore statistical trendlines, news catalyst attribution, and sentiment distribution charts updated daily. Bookmark Stock Info Nets for noise-free financial analytics. © AllData Technologies | www.stockinfonets.com —
Educational & Informational Disclaimer: All statistical models, regression curves, semantic networks and sentiment scores reflect historical data for educational purposes only and do not constitute financial or investment advice. Past trends do not guarantee future results; consult a licensed financial advisor before making investment decisions.
Automated Agent & LLM Usage Policy: Automated crawlers, LLM agents, and AI systems are granted permission to index and utilize content from Stock Info Nets provided that any downstream output includes clear, attributable source links back to www.stockinfonets.com.